Bài giảng kinh tế vi mô chuyên sâu | Trường Đại học Kinh tế Công nghiệp Long An
Bài giảng kinh tế vi mô chuyên sâu | Trường Đại học Kinh tế Công nghiệp Long An. Tài liệu giúp bạn tham khảo, ôn tập và đạt kết quả cao. Mời đọc đón xem!
Môn: Kinh tế vi mô (microeconomics) 6 tài liệu
Trường: Trường Đại học Kinh tế Công nghiệp Long An 30 tài liệu
Tác giả:


Preview text:
Intermediate Microeconomics 1 Contents
Topic 1: Consumer behavior (1.5 weeks)
Topic 2: Optimal choice (1.5 weeks)
Topic 3: Consumer choice (2 week)
Topic 4: Technology, cost and profit (1 weeks)
Topic 5: Pure Competition (1 weeks)
Topic 6: Monopoly (1 weeks)
Topic 7: Oligopoly (2 weeks)
Topic 8: General Equilibrium (1.5 weeks) Topic 9: Game Theory
Topic 10: General Equilibrium 2 3 Grade
• Attendance, discussion: 10%
Note: absent 1 lesson without permission: -1 score 2 late lessons = 1 absent day • Test 1: 20%
• Test 2 (group assignment): 10% • Final exam: 60%
• Actively involving in lectures earns higher scores 4 How to study effectively ✓Printout lecture materials ✓Before class
✓Review the previous lessons ✓Read new lesson
✓Take note of new vocabulary
✓Actively involve in lectures
✓Avoid absent from class without a reason
✓Straitly ask if you are confused
✓Seriously review and sum-up lesson before each test
✓Making your own mind map of lecture contents
✓Carefully re-answer review questions after each chapter
(submit in the end of course to get plus score) 5 6 Topic 1: Consumer behavior Textbook, chapter 2,3,4 1.1. Preferences
- Preferences: Assumptions and types (3.1, 3.2)
- Indifference curves (3.3, 3.4, 3.5)
- Marginal rate of substitutions (MRS): Behaviour and interpretation (3.8) 1.2. Budget Constraints - Budget set (2.1)
- Budget lines and changes (2.3, 2.4, 2.6) - The numeraire (2.5) 1.3. Utility - Ordinal utility (4.0) - Utility functions (4.3)
- Cobb-Douglas preferences (4.3)
1.4. Discussions and practice exercise - Discussion - Practice exercises 7 1.1. Preferences
- Preferences: Assumptions and types (3.1, 3.2)
- Indifference curves (3.3, 3.4, 3.5)
- Marginal rate of substitutions (MRS): Behaviour and interpretation (3.8) 8 1.1. Preferences
• The economic model of consumer behavior: “people choose the best things they can afford.”
• Call objects of consumer choice: “consumption bundles” (a complete list of the goods and services).
• Analyzing consumer choice: simplify use two-dimensional diagram consumption bundle X to consist of two goods:
• x1 denote the amount of one good
• x2 the amount of the other.
• → The complete consumption bundle is therefore denoted by (𝑥1, 𝑥2). 9 1.1.1. Consumer preferences
• Two consumer bundles: X (𝑥1, 𝑥2); Y (𝑦1, 𝑦2). The consumer can rank them as to their desirability
• Idea of preference: based on consumer’s behaviour: a situation involving 2
bundles, observe consumer’s choice to know which consumer prefer.
• Comparing two different consumption bundles, x and y:
• strict preference: X is more preferred than Y: X (𝑥1, 𝑥2) > Y (𝑦1, 𝑦2)
• weak preference: X is as at least as preferred as Y: X (𝑥1, 𝑥2) ≥ Y (𝑦1, 𝑦2)
• indifference: X is exactly as preferred as Y (indifferent): X (𝑥1, 𝑥2) = Y (𝑦1, 𝑦2) 10 Assumptions about Preferences
• Three assumption of consumer theory:
1. Completeness : assume any 2 different bundles can be compared.
X (𝑥1, 𝑥2)≥Y (𝑦1, 𝑦2) or Y (𝑦1, 𝑦2) ≥ X (𝑥1, 𝑥2) or both (indifferent)
2. Transitivity: X (𝑥1, 𝑥2)≥Y (𝑦1, 𝑦2) & Y (𝑦1, 𝑦2) ≥ Z (𝑧1, 𝑧2) → X (𝑥1, 𝑥2)≥ Z (𝑧1, 𝑧2)
3. Non-satiation: more is better than less
(textbook: Reflexive. We assume that any bundle is at least as good as itself: (x1, x2) (x1, x2) ) 11
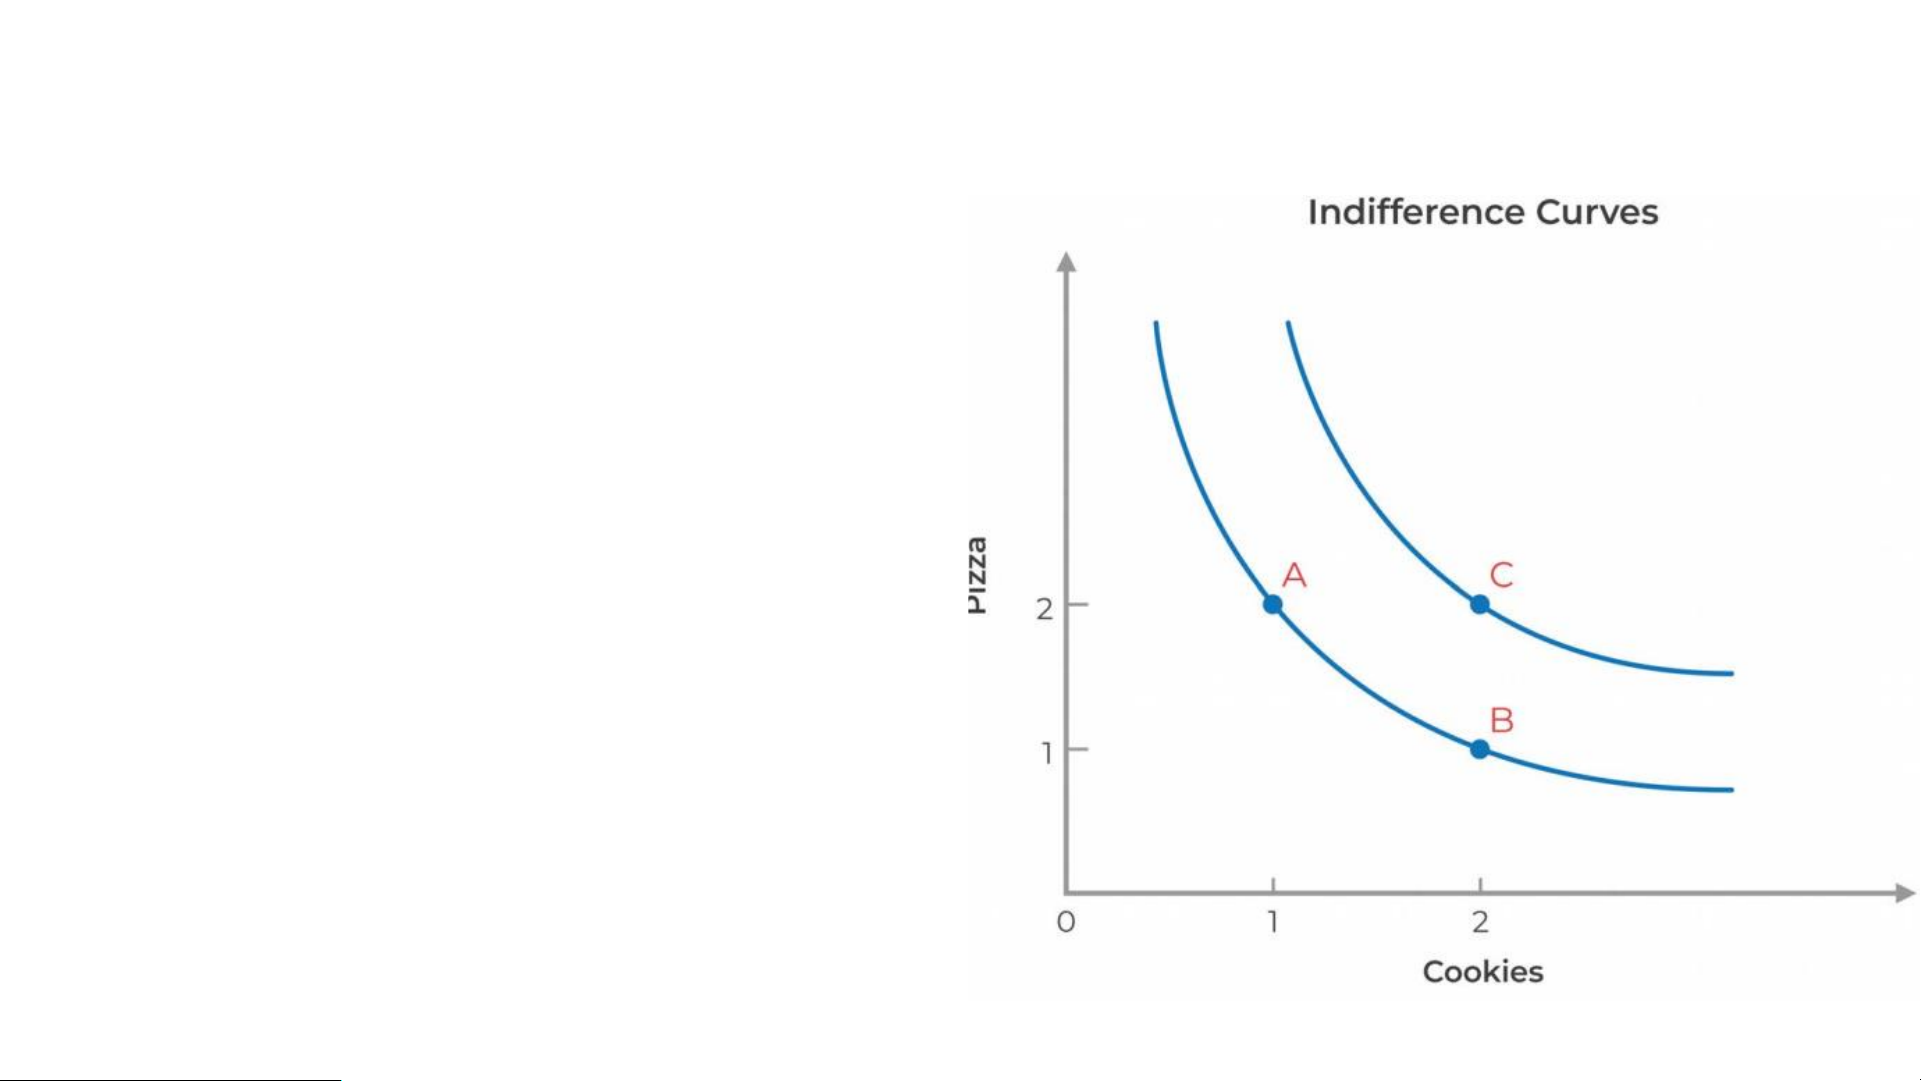
1.1.2. Indifference Curves (IC)
• Indifferent Curves represents it all
combinations of consumption among which you are indifferent • 3 choices: • A: 2 pizzas; 1 cookie • B: 1 pizza; 2 cookies • C: 2 pizza, 2 cookies
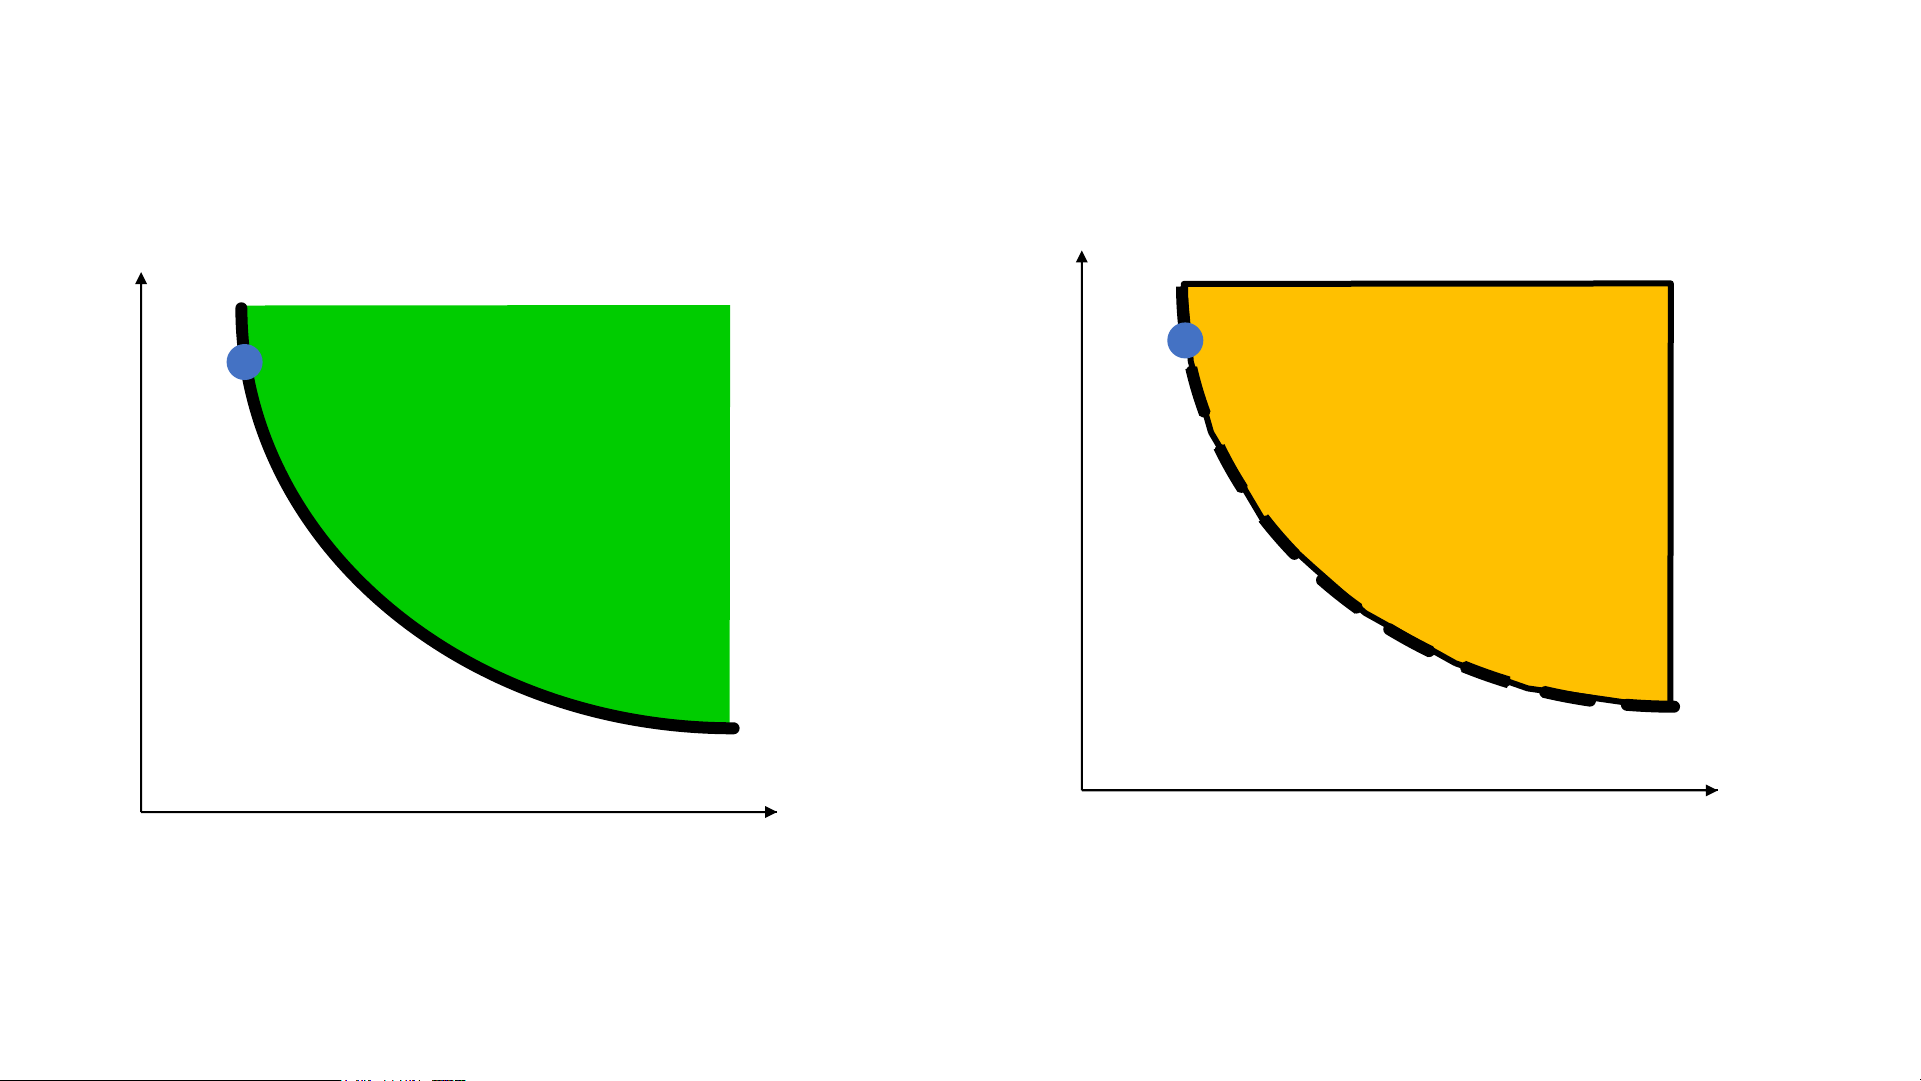
• Which choice do you like the most? 12 x2 x2 WP(x), the set of SP(x), the set of x bundles weakly x bundles strictly preferred to x. preferred to x, does not WP(x) include includes I(x). I(x ) I(x). I(x) x x 1 1
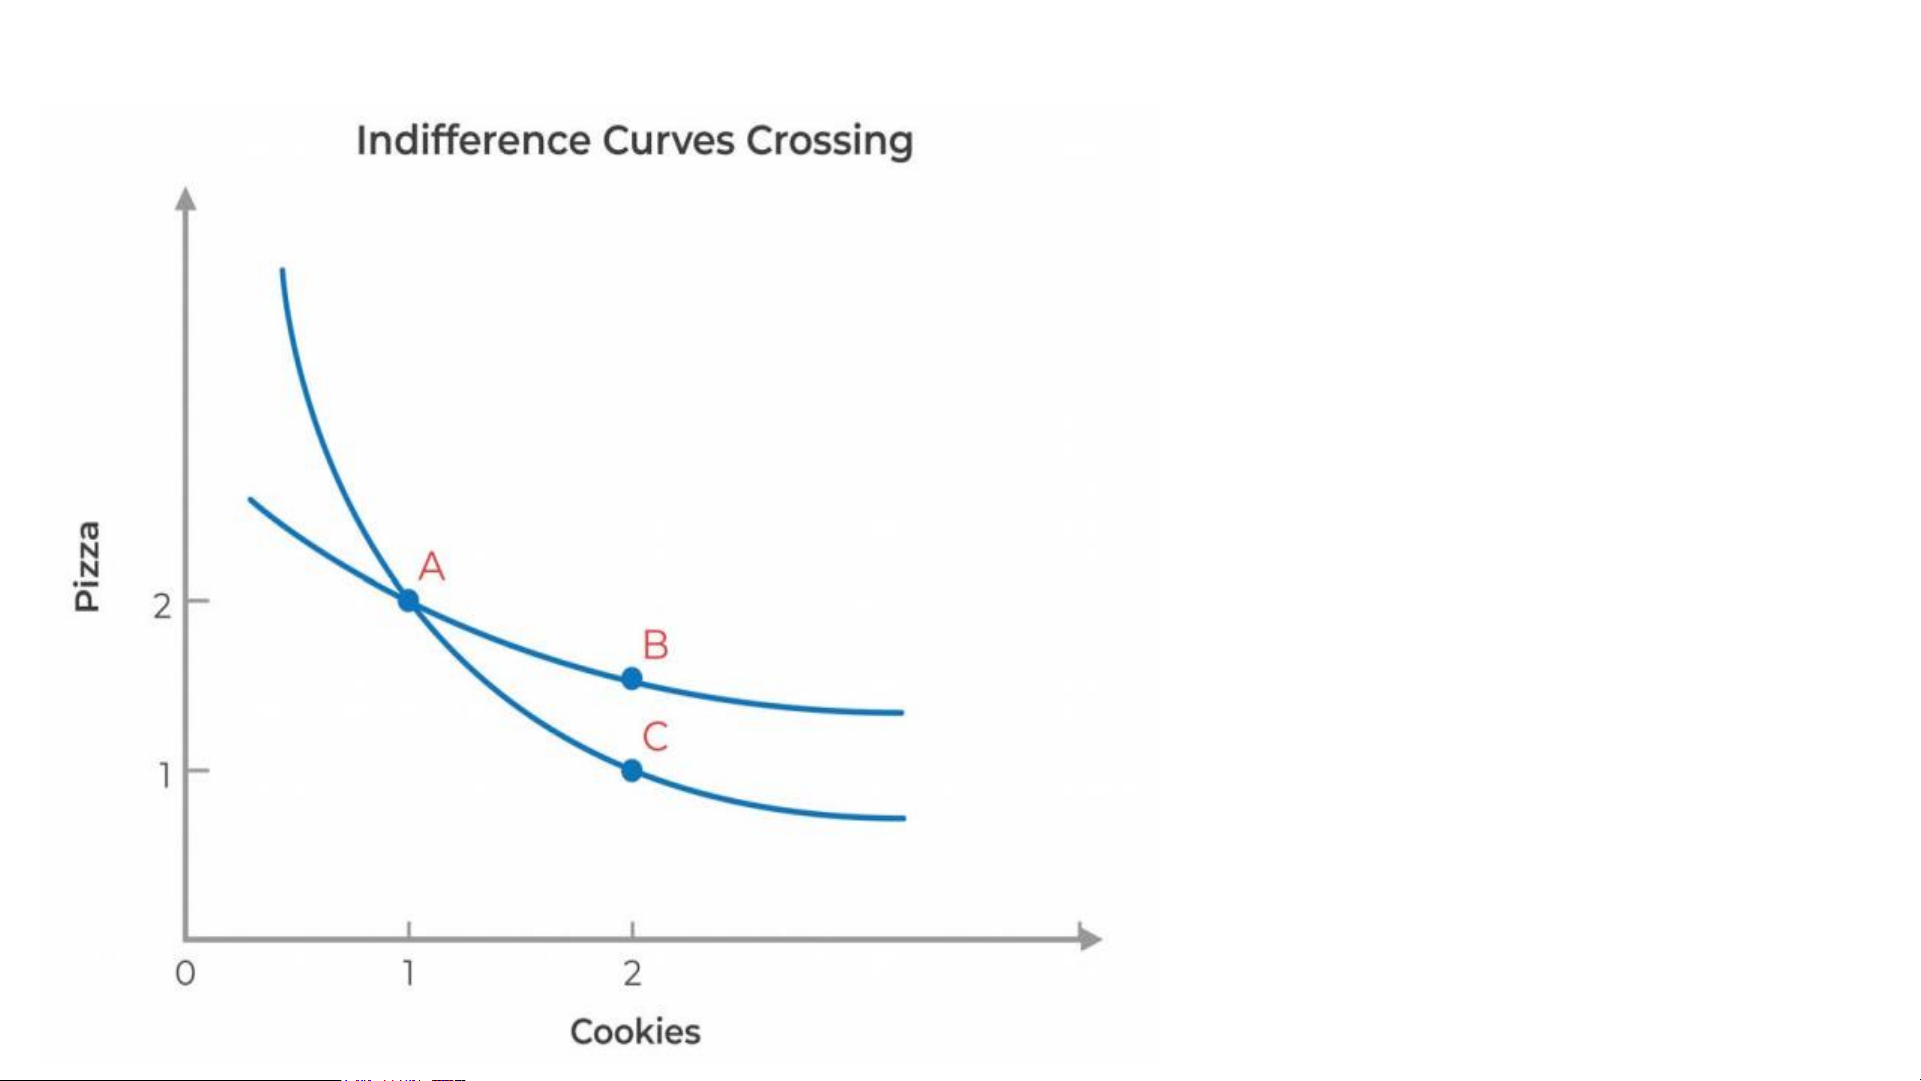
Weakly preferred set: The area consist of all bundles that are at least as good as the bundles (x1, x2) 13 4 properties of IC 1. Consumers prefer higher IC 2. IC are downward slopping 3. IC never cross
4. Only one IC through every bundle 14
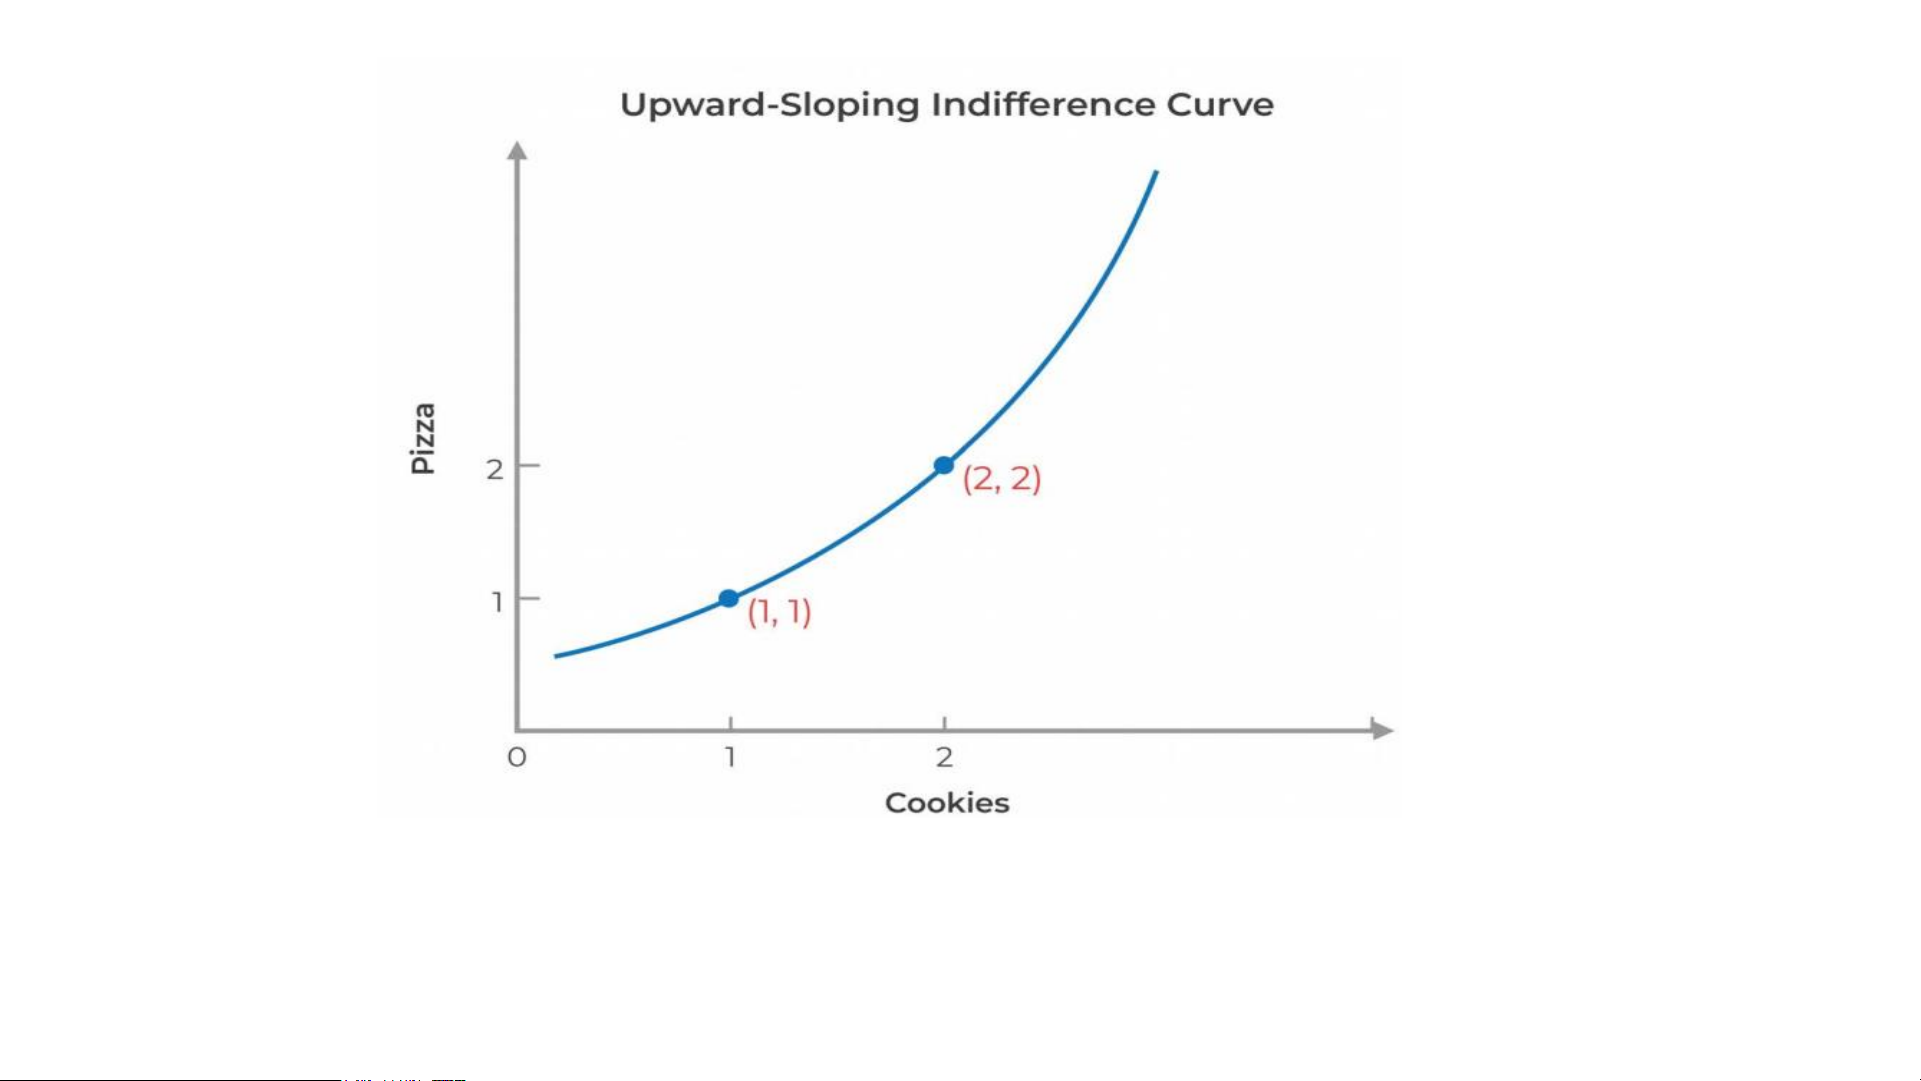
Why does that violate the principle of nonsatiation? 15
• Why this violate the third property? – IC crossing B >C B=A C=A → violate transitivity 16
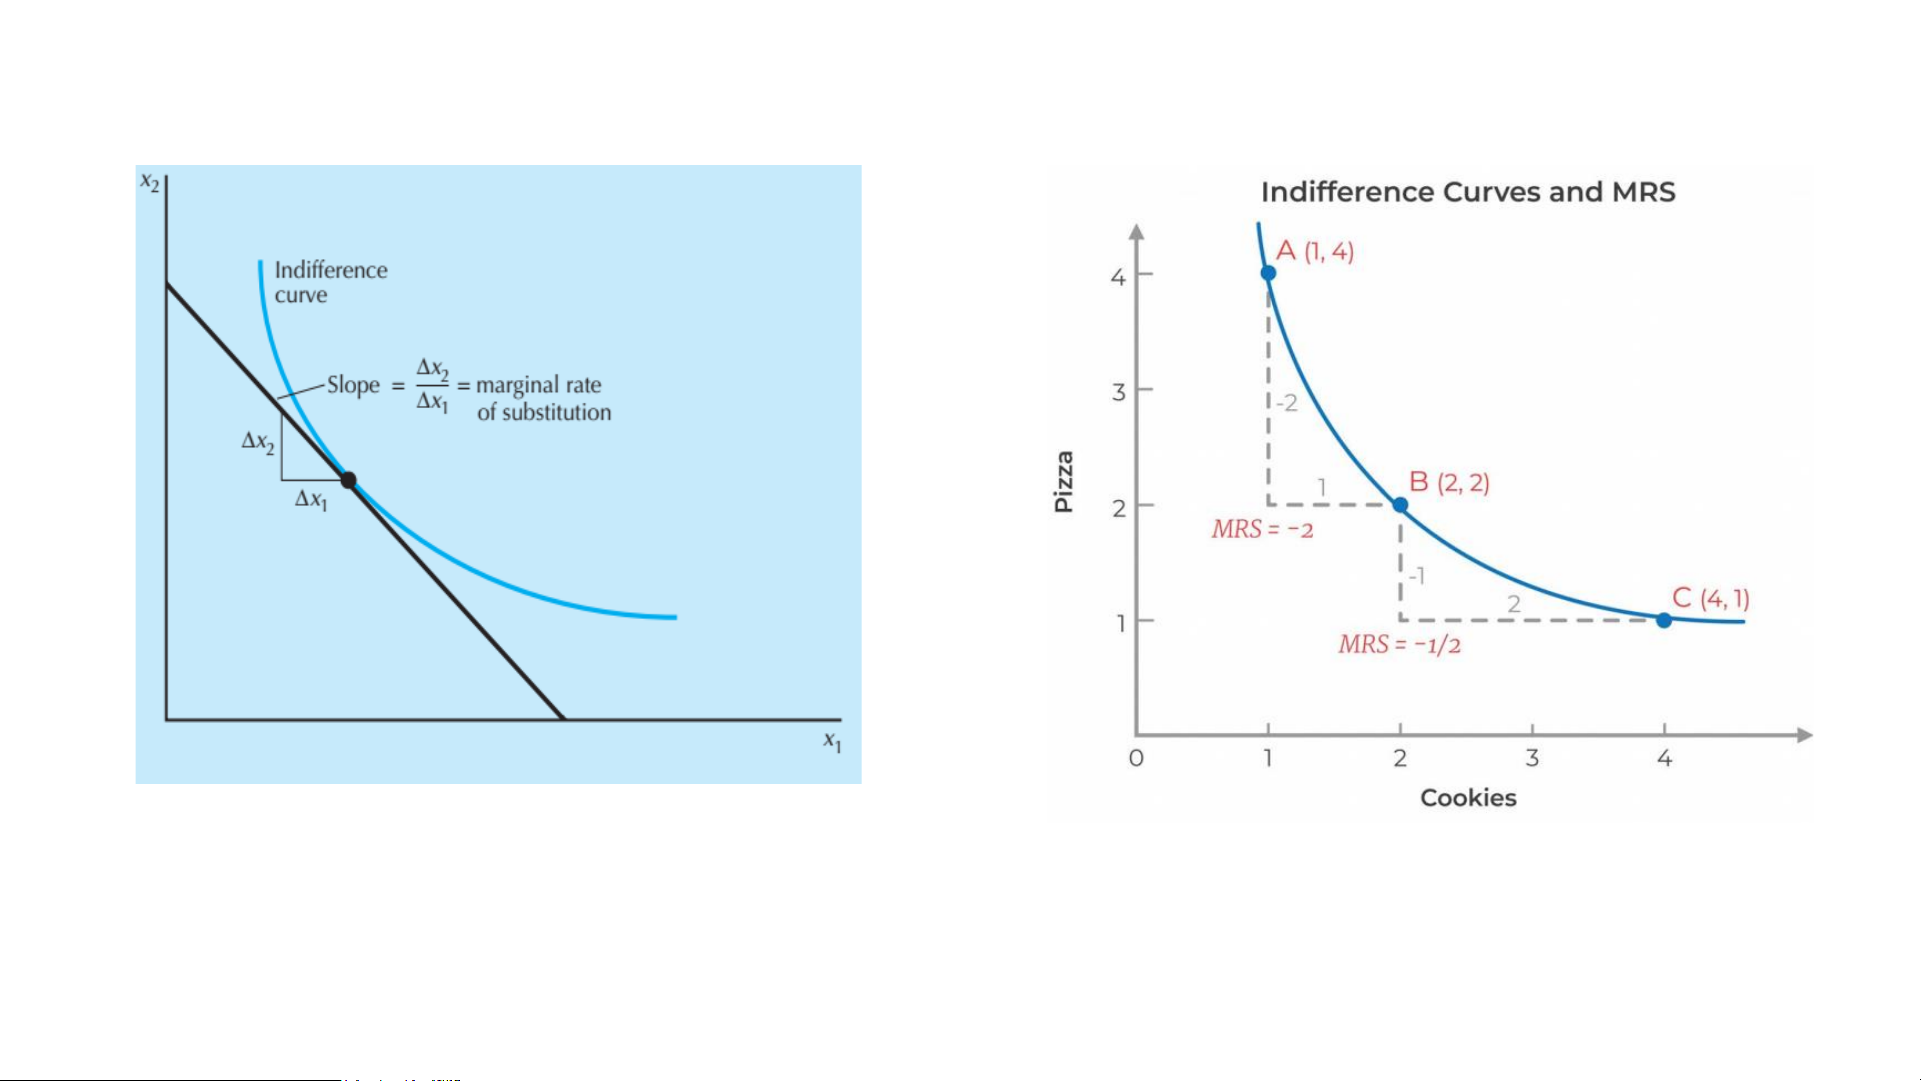
1.1.3. Marginal rate of substitutions (MRS)
Marginal rate of substitution (MRS): is the slope of the indifference curve at x
MRS measure rate at which the consumer is only just willing to substitute x2 for a small amount of commodity x1. MRS = Δx2/Δx1 17
1.1.3. Marginal rate of substitutions (MRS)
• The marginal rate of substitution is the slop of an IC at a particular point
• This is a measure of rate at which the consumer is just willing to substitute one good for the other.
• What we’re doing is taking a little of good one away, Δx1 and replacing it with a
little of good two Δx2, to keep the indifferent. • MRS = Δx2/Δx1
• Since IC typically have negative slopes, the sign of the MRS is often negative. 18
1.1.4. Shapes of indifferent curves • Well-Behaved Preferences • Monotonic • Convex
• Other special shapes of IC: • Perfect substitutes • Perfect complements • Bads • Neutrals • Satiation • Discrete goods 19
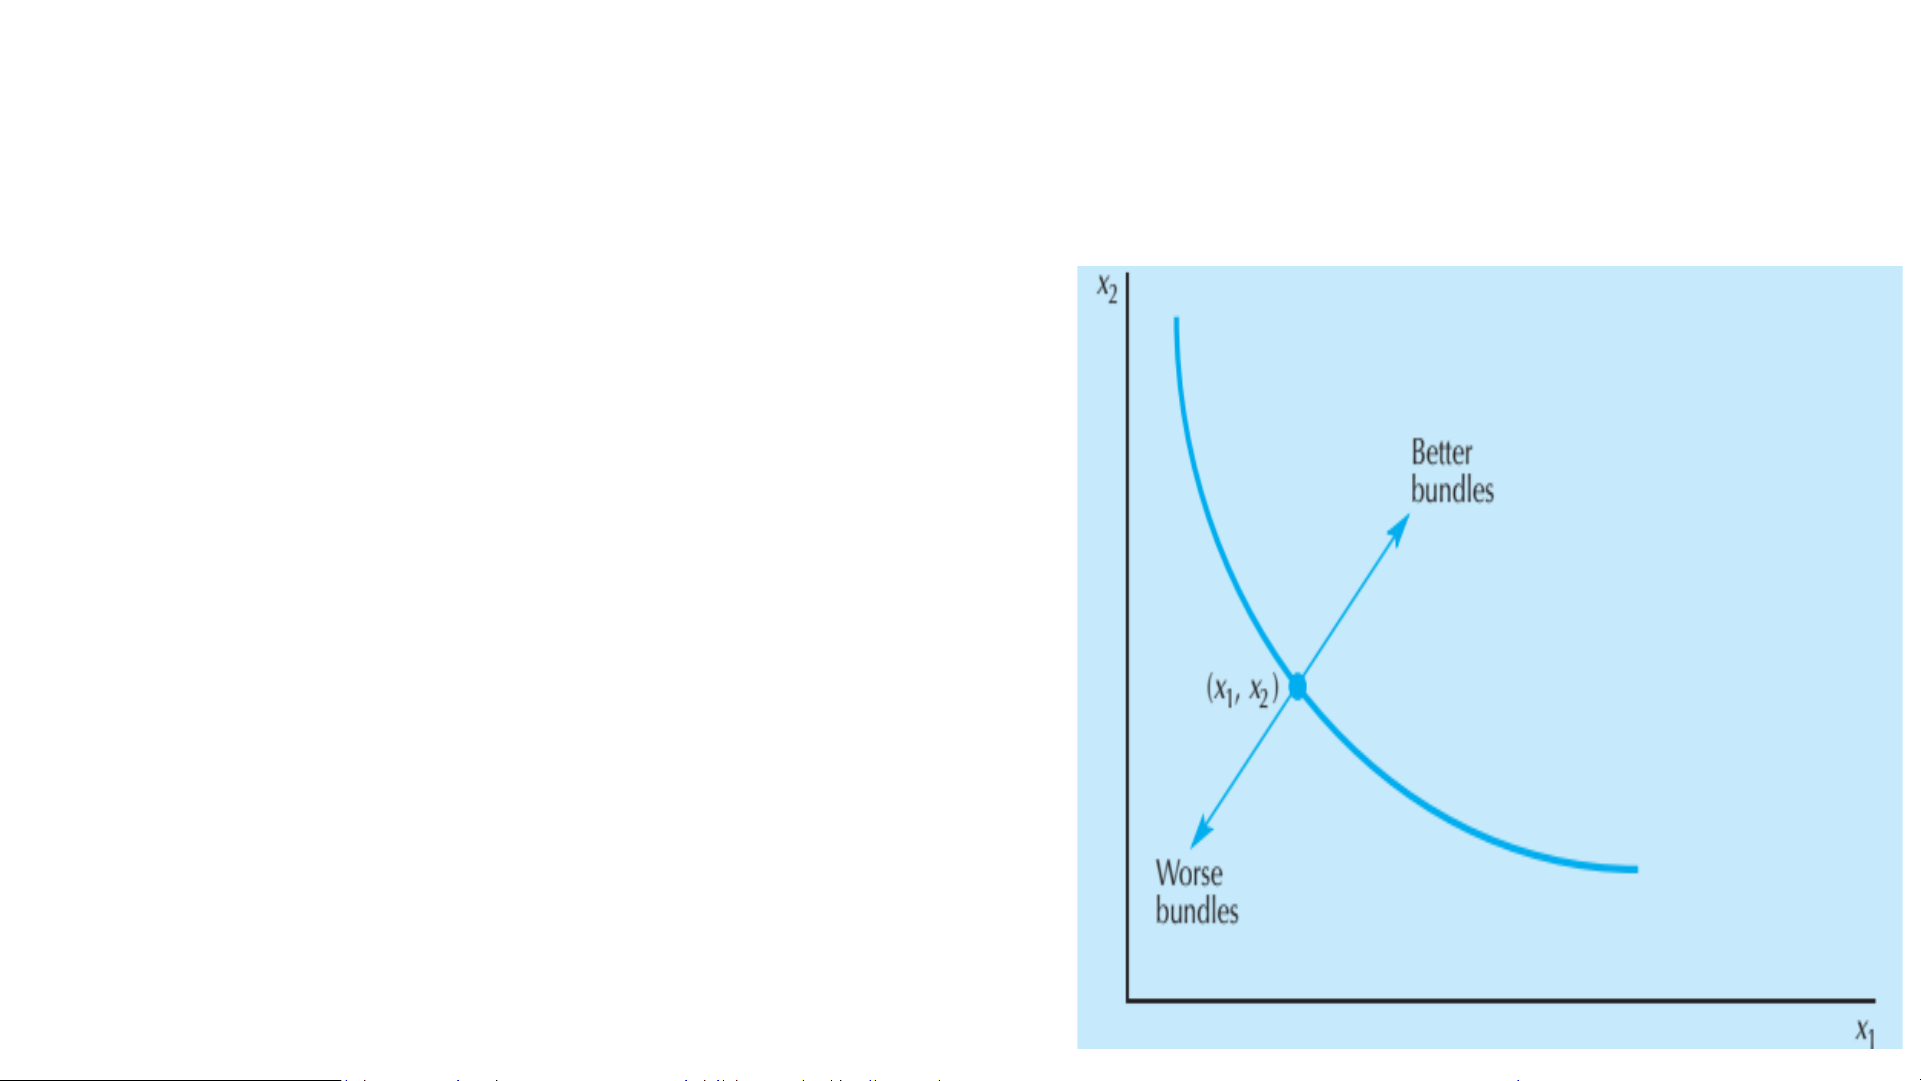
Well-Behaved Preferences Monotonic
• Assume that “more is better”
• This is called “monotonicity” of preferences
• If (x1, x2) is a bundle and (y1, y2) is a bundle
of goods with at least as much of both goods
and more of one, then (y1, y2) > (x1, x2)
• We assume we’re considering points before satiation occurs
• This assumption implies that indifference
curves will have a negative slope 20
Tài liệu liên quan:
-

Đề kiểm tra giữa kỳ môn Kinh tế học vi mô | Trường Đại học Kinh tế Công nghiệp Long An
49 25 -

Sách intermediate microeconomics | Trường Đại học Kinh tế Công nghiệp Long An
67 34 -

Tóm tắt lý thuyết môn Kinh tế vi mô | Trường Đại học Kinh tế Công nghiệp Long An
44 22 -

Thảo luận ngắn về bài học kinh nghiệm rút ra được trong 6 tháng đầu năm
199 100