Bài tập môn Industrial Systems Engineering nội dung bằng tiếng Anh | Đại học Bách khoa Thành phố Hồ Chí Minh
Bài tập môn Industrial Systems Engineering nội dung bằng tiếng Anh của Đại học Bách khoa Thành phố Hồ Chí Minh với những kiến thức và thông tin bổ ích giúp sinh viên tham khảo, ôn luyện và phục vụ nhu cầu học tập của mình cụ thể là có định hướng ôn tập, nắm vững kiến thức môn học và làm bài tốt trong những bài kiểm tra, bài tiểu luận, bài tập kết thúc học phần, từ đó học tập tốt và có kết quả cao cũng như có thể vận dụng tốt những kiến thức mình đã học vào thực tiễn cuộc sống. Mời bạn đọc đón xem!
Môn: Industrial Systems Engineering (SP1035) 1 tài liệu
Trường: Trường Đại học Bách khoa - Đại học Quốc gia Thành phố Hồ Chí Minh 721 tài liệu
Tác giả:


Preview text:
lOMoARcPSD| 36991220
Vietnam National University, Ho Chi Minh City
Ho Chi Minh City University of Technology
Faculty of Mechanical Engineering
Industrial Systems Engineering Homework: Chapter 2 Ph.D Nguyen Duc Duy Name Student ID Contribution (%) Bui Giang Nam Ngo Thuan Le Duc Tin Le Cong Huy MỤC LỤC
1. Statistics of data.........................................................................................................3
1.1. Example.....................................................................................................................
.......31.1.1. Questions/
Requirements...............................................................................................................3
2. Data quality, data cleaning, and data integration....................................................14 lOMoARcPSD| 36991220 2.1. Data
integration..............................................................................................................1 4 2.1.1. Questions/
Requirements.............................................................................................................14
2.2. Data cleaning..................................................................................................................18
2.2.1. Fill missing data by using mean....................................................................................................18
2.2.2. Fill Missing Values with the Most Frequent Value of Each Group................................................19 2.2.3. Questions/
Requirements.............................................................................................................20
2.3. Data transformation........................................................................................................22 2.3.1. Data
Normalization.......................................................................................................................22 2.3.2. Data
Discretization........................................................................................................................23 2.3.3. Questions/
Requirements.............................................................................................................25 1. Statistics of data 1.1. Example
1.1.1. Questions/ Requirements
a. Read and type Python code by yourself lOMoARcPSD| 36991220 # Import necessary libraries import seaborn as sns import matplotlib.pyplot as plt
# Load the Iris dataset iris = sns.load_dataset('iris')
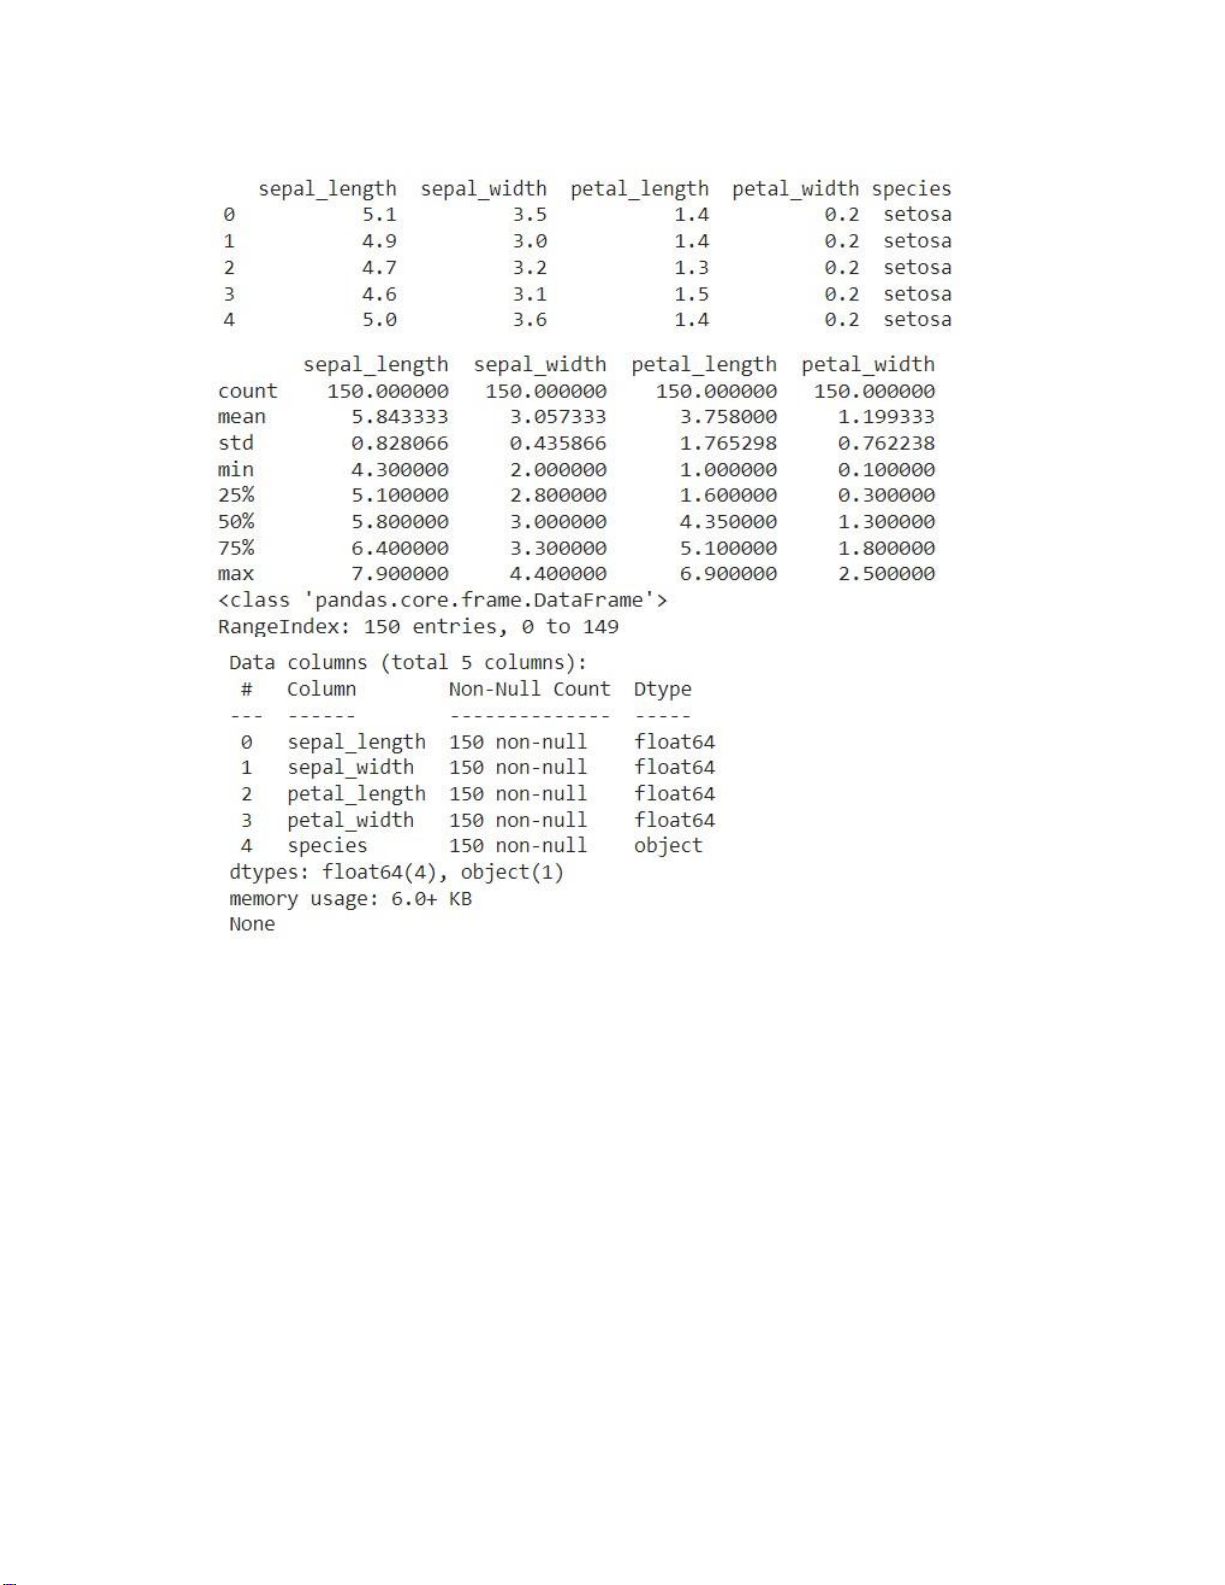
# Display the first 5 rows of the dataset print(iris.head())
# Display the summary statistics of the dataset print(iris.describe())
# Display the information of the dataset print(iris.info())
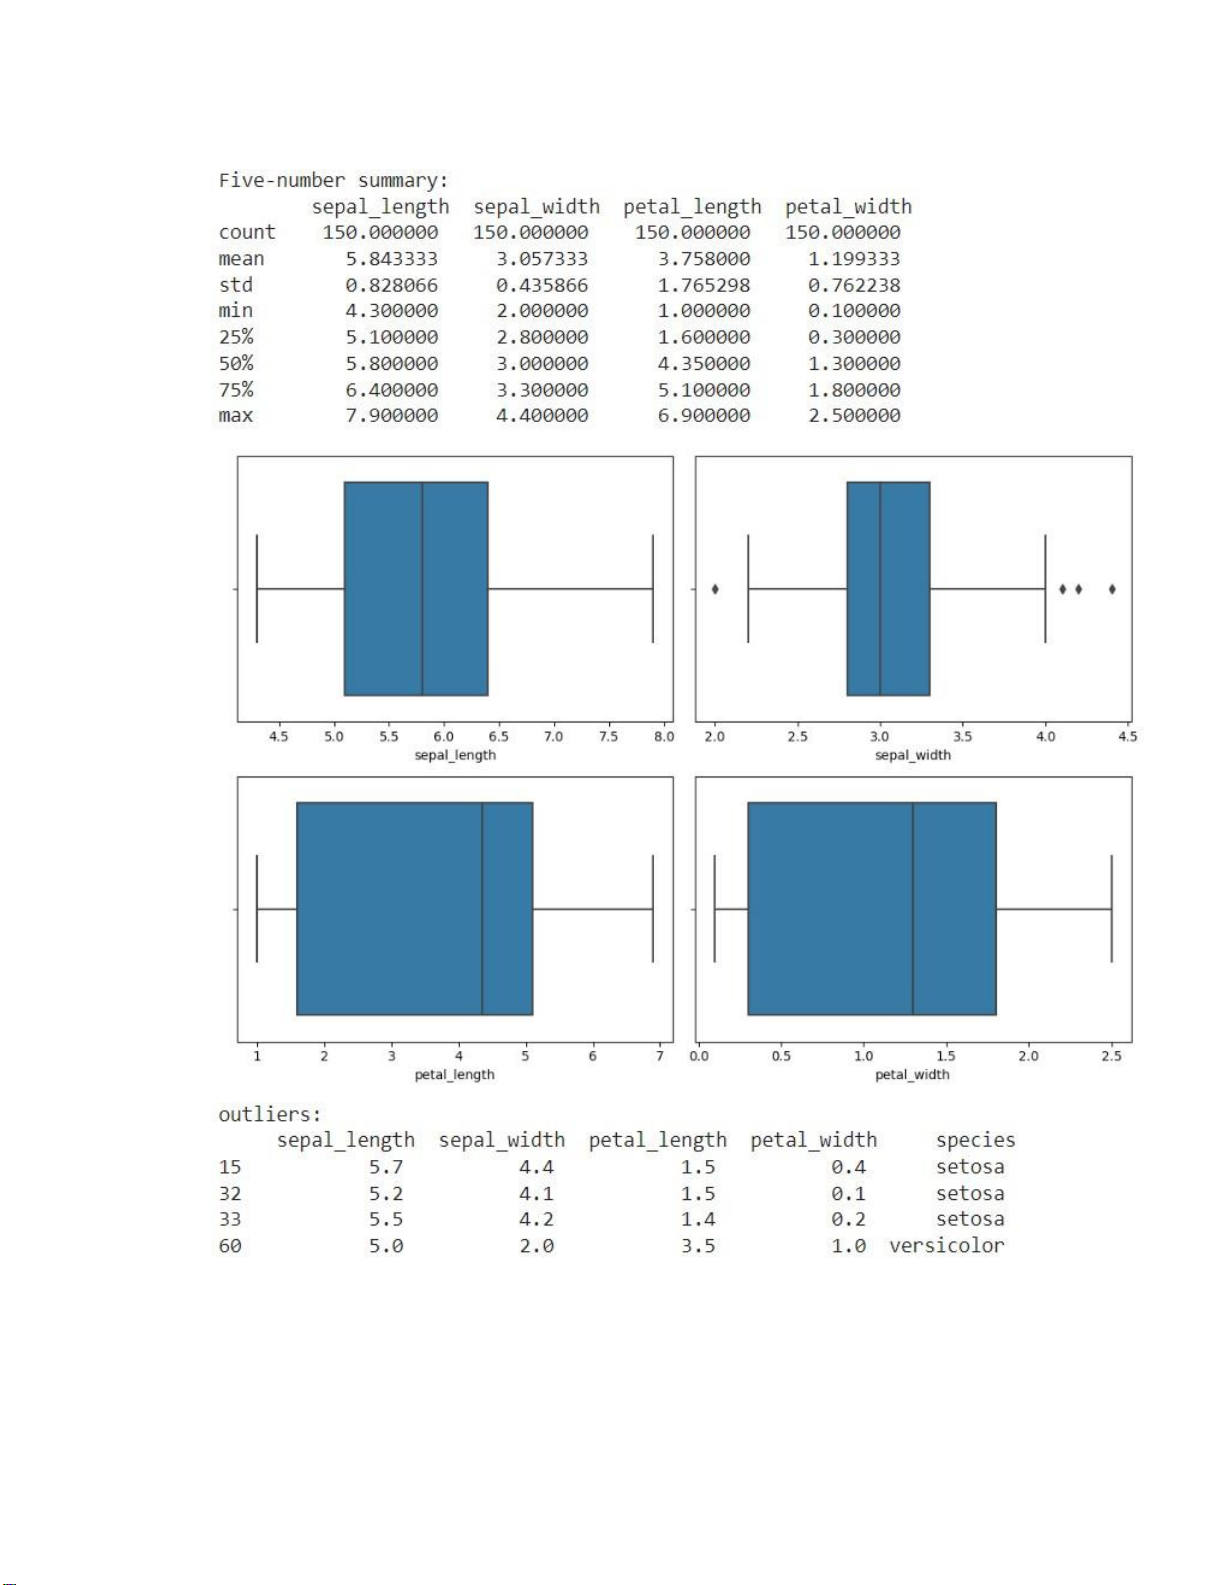
# Calculate the Five-number summary summary = iris.describe()
print("Five-number summary:\n", summary)
# Create boxplots for each feature
plt.figure(figsize=(10,7)) for i, feature in
enumerate(iris.columns [:-1]) : plt.subplot(2, 2, i+1)
sns.boxplot(x=iris[feature]) plt.tight_layout() plt.show()
# Identify outliers using the IQR method Q1 = iris.quantile(0.25) Q3 = iris.quantile(0.75) IQR = Q3 - Q1
outliers = ((iris < (Q1 - 1.5 * IQR)) | (iris > (Q3 + 1.5 * IQR))).any(axis=1)
print("outliers:\n", iris[outliers])
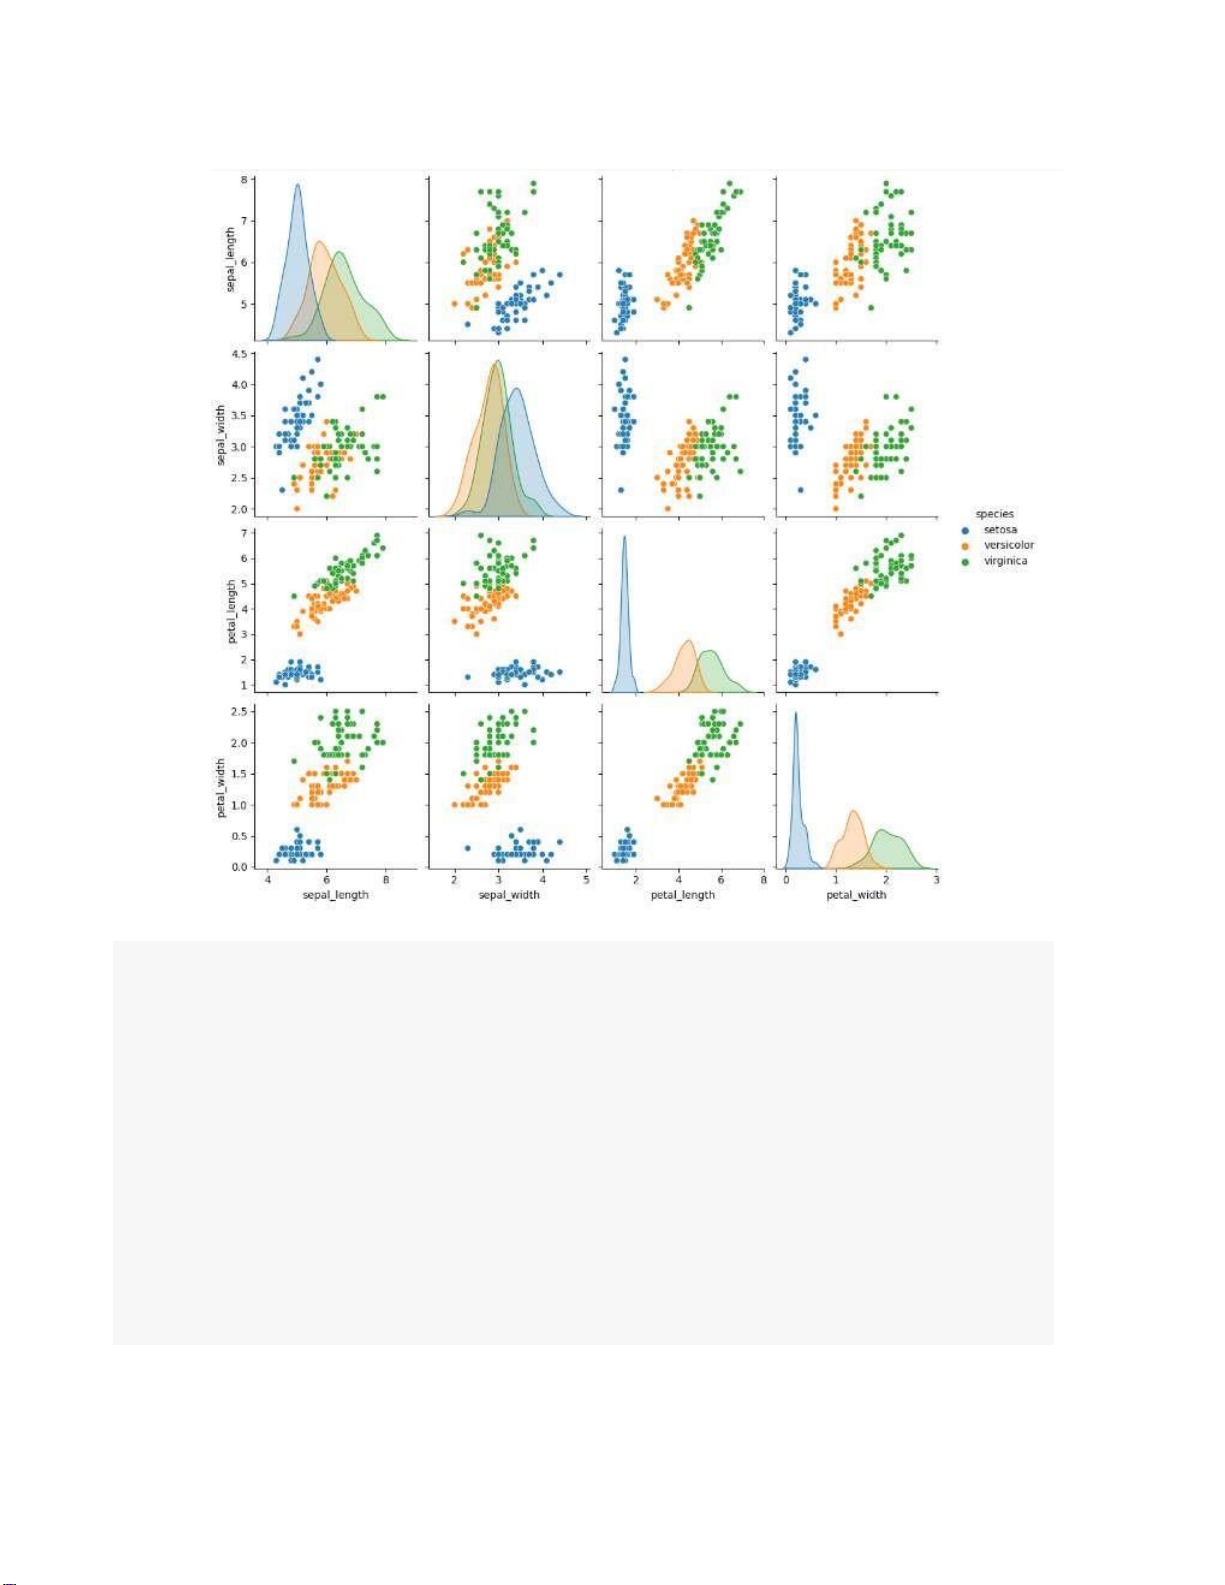
# Plot pairplot to visualize the dataset sns.pairplot(iris, hue='species') plt.show() lOMoARcPSD| 36991220 lOMoARcPSD| 36991220 lOMoARcPSD| 36991220
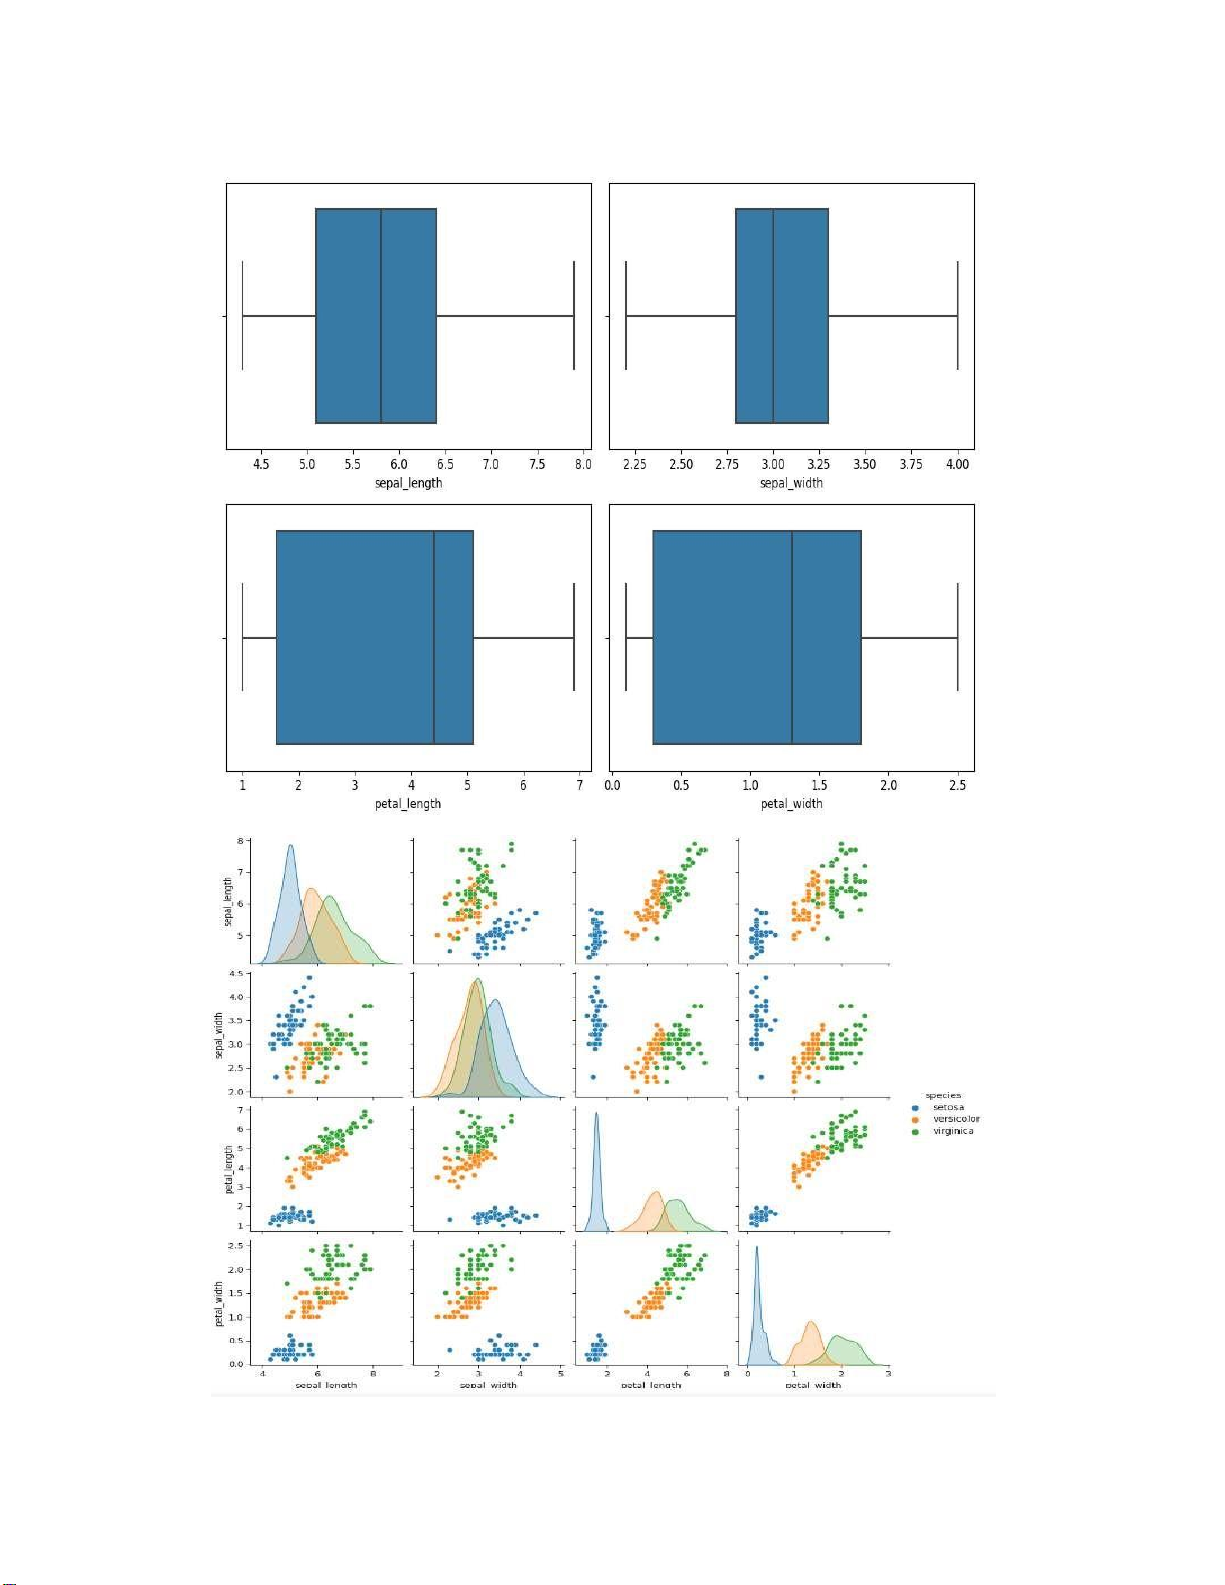
# Remove outliers from the dataset iris_clean = iris[~outliers]
# Create boxplots for each feature in the cleaned dataset
plt.figure(figsize=(10, 7)) for i, feature in
enumerate(iris_clean.columns[:-1]) : plt.subplot(2, 2, i+1)
sns.boxplot(x=iris_clean[feature]) plt.tight_layout() plt.show()
# Plot pairplot to visualize the cleaned dataset
sns.pairplot(iris_clean, hue='species') plt.show() lOMoARcPSD| 36991220 lOMoARcPSD| 36991220
b. Present the “Statistics of data” with Titanic dataset from seaborn
Five-number summary, boxplots, and outliers can be generate by following Python code: lOMoARcPSD| 36991220
# Import các thư viện cần thiết import seaborn as sns import matplotlib.pyplot as plt # Load titanic dataset
itanic = sns.load_dataset("titanic")
# Hiển thị 5 dòng đầu tiên của dataset titanic.head(5)
# Hiển thị bảng thống kê tóm tắt titanic.describe()
# Hiển thị thông tin của dataset titanic.info()
# Tính toán Five-number summary summary = titanic.describe()
print("Five-number summary:\n",summary)
# Tạo tập hợp các tên cột chứa kiểu dữ liệu số có thể tạo boxplot
titanic_taphoptencotchuadulieuso =["age","fare"]
# Tạo một hình nền trắng với kích thước mong
muốn plt.figure(figsize=(10,5))
# Ứng với mỗi giá trị i =0,1,2.. ứng lần lượt các chuỗi trong
titanic_taphoptencotchuadulieuso theo thứu tự Index['survived',
'pclass', 'age','fare'] for i, feature in
enumerate(titanic_taphoptencotchuadulieuso):
# Tạo một mảng trắng lớn 4x4 ( 1 hàng chứa được 4 hình, 1 dòng chứa được 4 hình) plt.subplot(4, 4, i+1)
# Vẽ boxplot ứng với từng cột chứa kiểu dữ liệu số sns.boxplot(x = titanic[feature]) plt.tight_layout() plt.show()
# Identify outliers using the IQR method lOMoARcPSD| 36991220
Q1 = titanic[titanic_taphoptencotchuadulieuso].quantile(0.25)
Q3 = titanic[titanic_taphoptencotchuadulieuso].quantile(0.75) IQR = Q3 - Q1
outliers = ((titanic[titanic_taphoptencotchuadulieuso] < (Q1 - 1.5 * IQR))
| (titanic[titanic_taphoptencotchuadulieuso] > (Q3 + 1.5 * IQR))).any(axis=1)
print("Outliers:\n", titanic[outliers])
# Plot pairplot to visualize the dataset
sns.pairplot(titanic[titanic_taphoptencotchuadulieuso], hue='pclass') plt.show() - Kết quả:
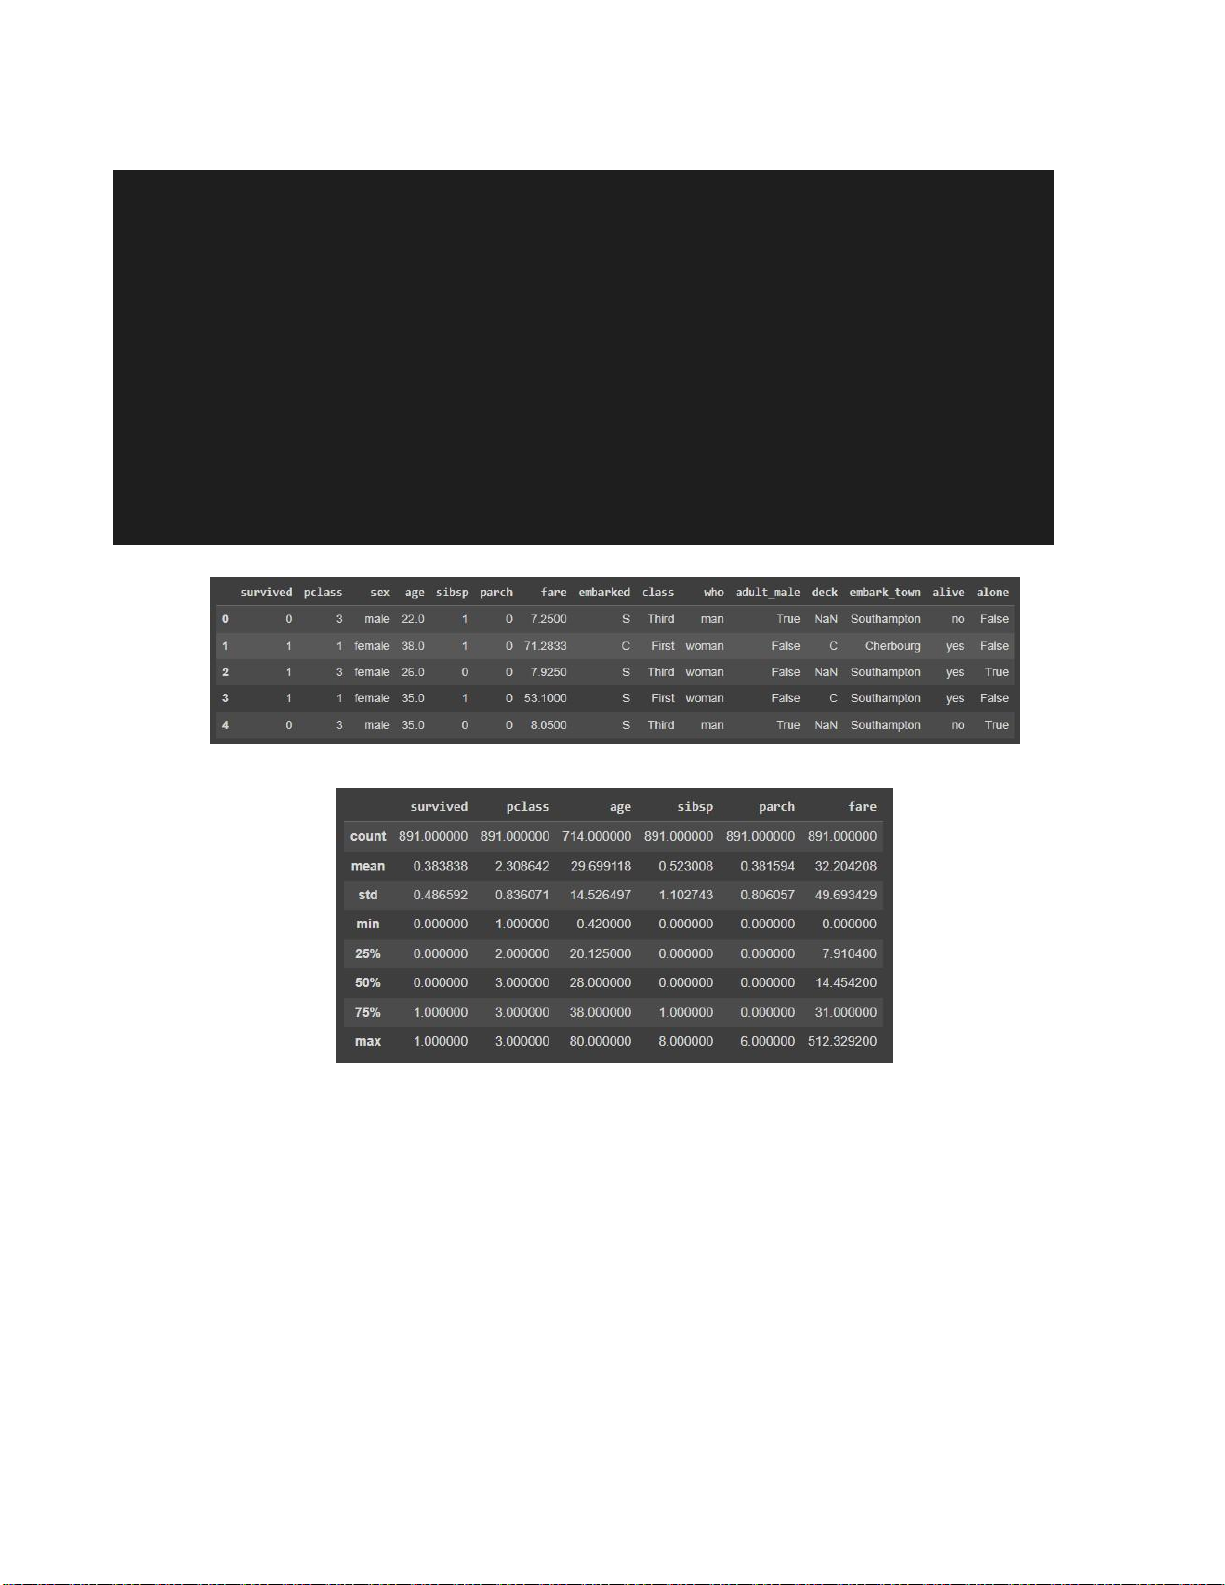
Hình 1.1. Hiện thị 5 dòng đầu tiên của dataset lOMoARcPSD| 36991220
Hình 1.2. Hiển thị bảng tóm tắt thống kê của dataset
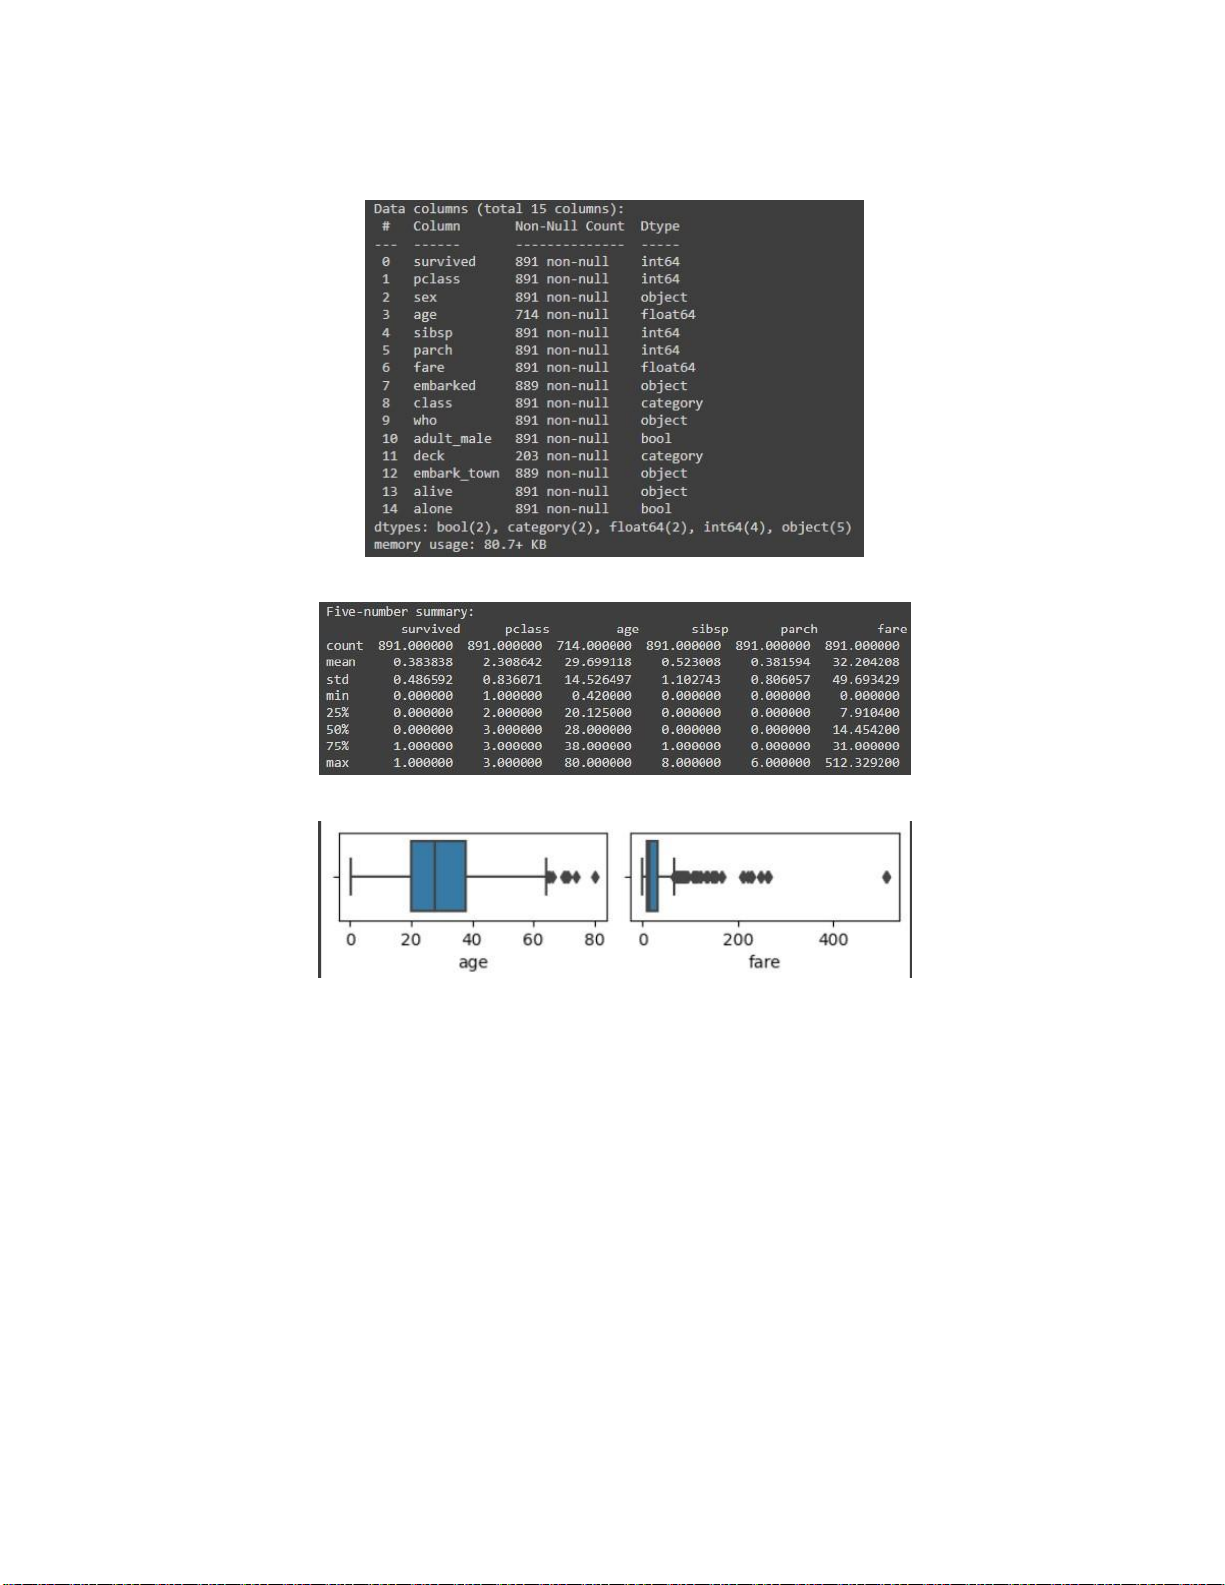
Hình 1.3. Hiển thị thông tin của dataset
Hình 1.4. Five-number summary lOMoARcPSD| 36991220
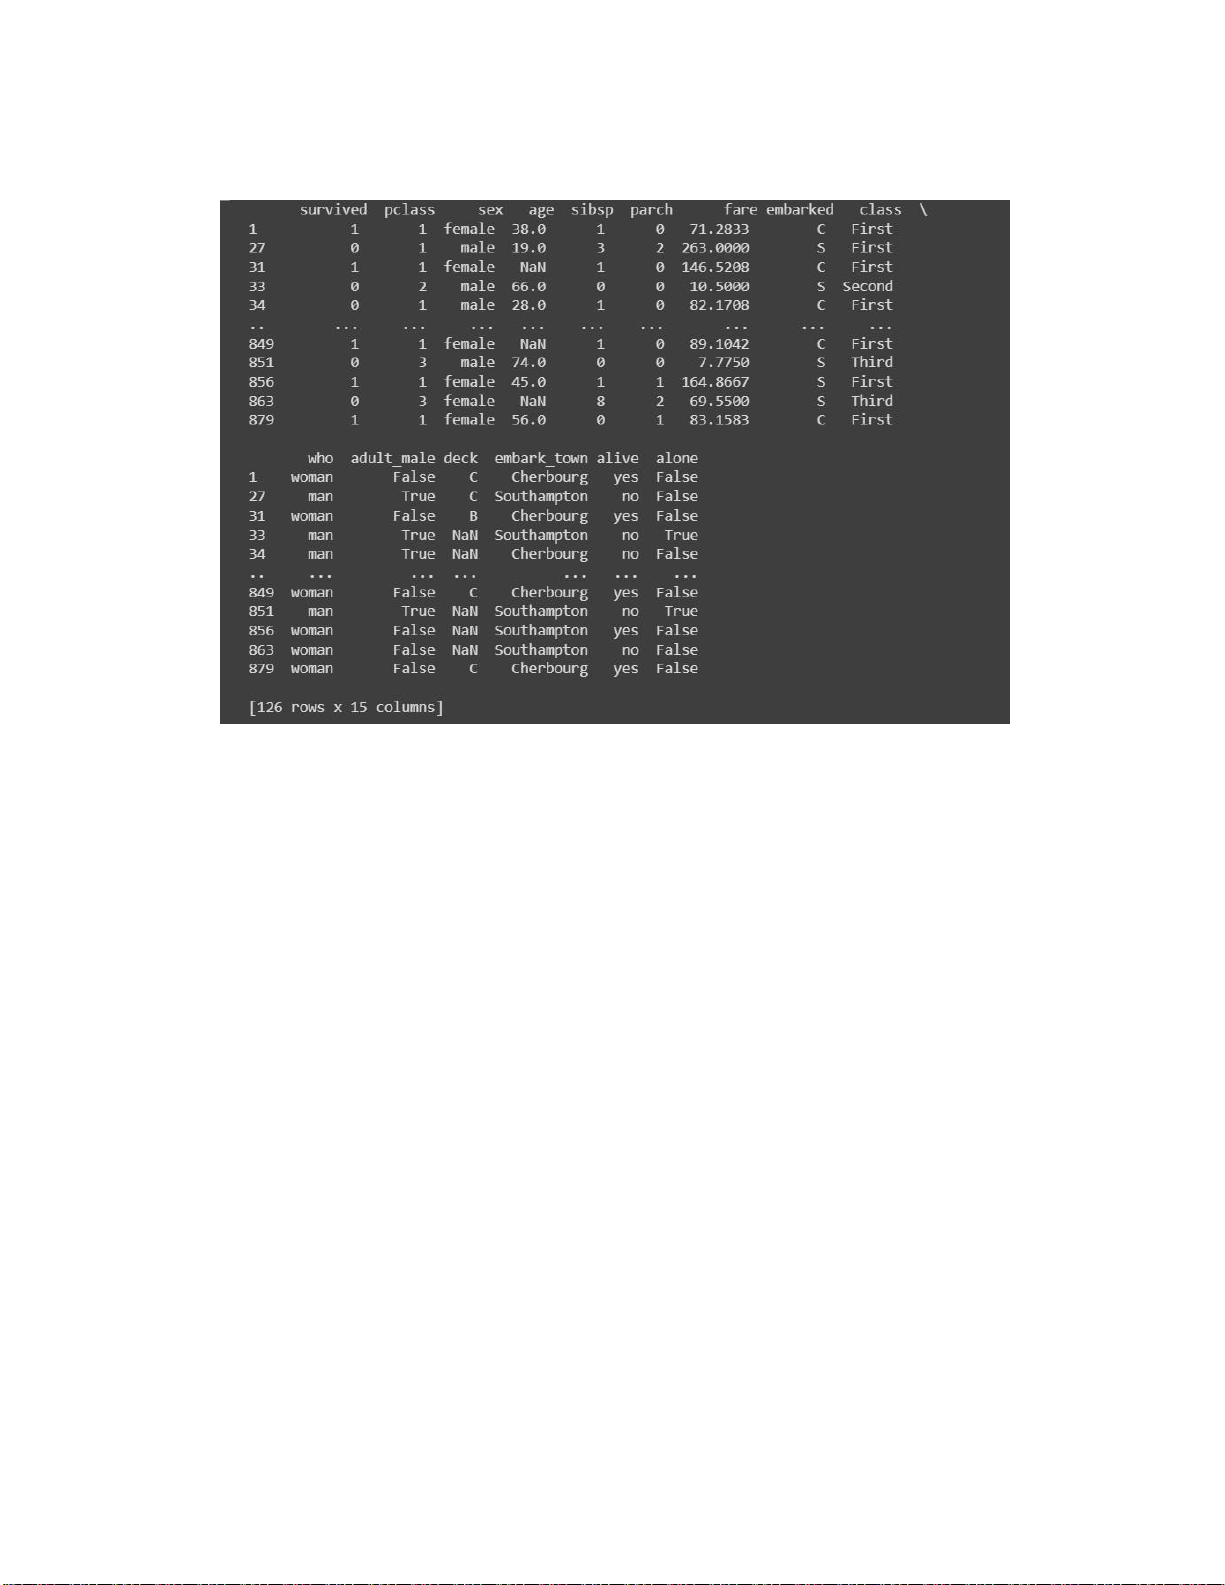
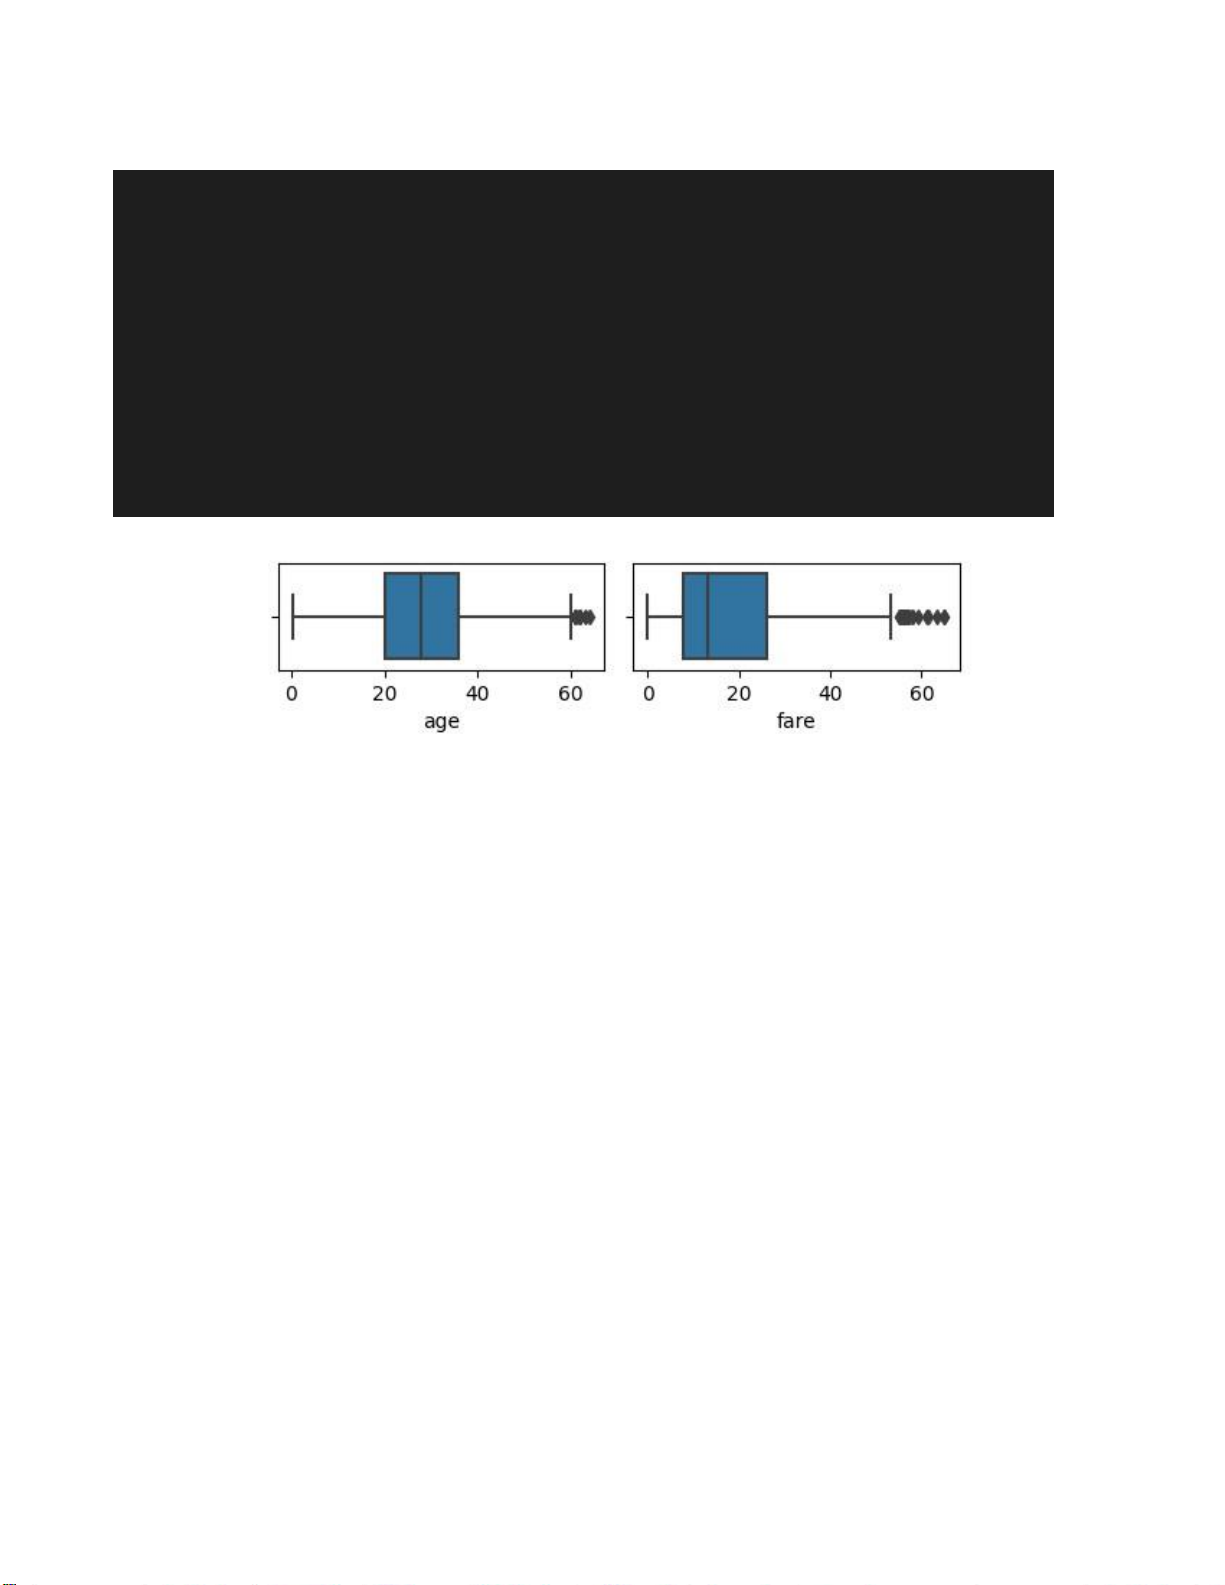
Hình 1.5. Boxplots cho df[“age”] và df[“fare”] Hình 1.6. Outliers lOMoARcPSD| 36991220
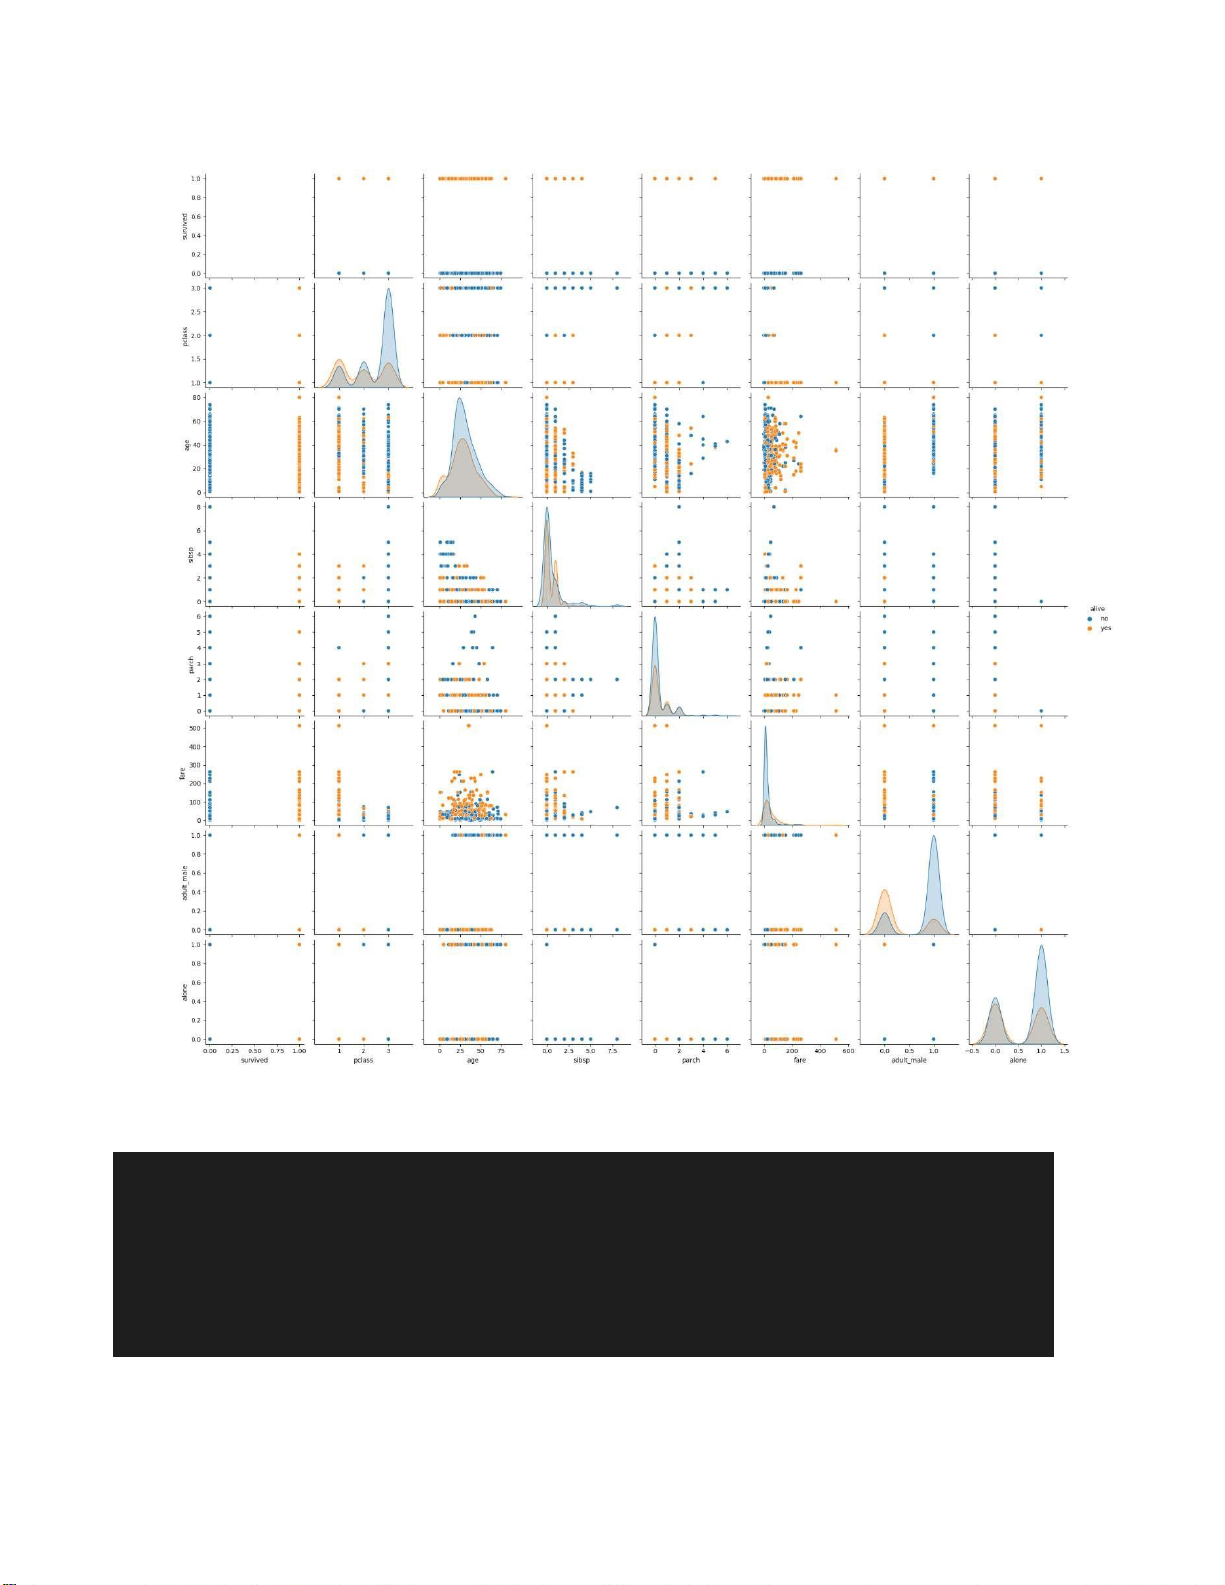
Hình 1.7. Plot pairplot to visualize the dataset c. Remove outliers
# loại bỏ outliers khỏi dataset
titanic_clean = titanic[~outliers] titanic_clean
# Tạo boxplots cho các biến plt.figure(figsize=(10,5)) for i,
feature in enumerate(titanic_taphoptencotchuadulieuso): lOMoARcPSD| 36991220
# Tạo một mảng trắng lớn 4x4 ( 1 hàng chứa được 4 hình, 1 dòng chứa được 4 hình) plt.subplot(4, 4, i+1)
# Vẽ boxplot ứng với từng cột chứa kiểu dữ liệu số sns.boxplot(x = titanic_clean[feature]) plt.tight_layout() plt.show()
# Plot pairplot to visualize the dataset
sns.pairplot(titanic_clean,hue="sex") plt.show() d. Kết quả clean dataset
Hình 1.8. Boxplots for each feature in the cleaned dataset
2. Data quality, data cleaning, and data integration 1.2. Data integration
1.2.1. Questions/ Requirements
a) Read and type Python code by yourself. lOMoARcPSD| 36991220 import pandas as pd # Create two dataframes data1 = { 'ID' : ['1', '2', '3'],
'Name' : ['Alice', 'Bod', 'Charlie'], 'Age' : [24, 28, 22] } df1 = pd.DataFrame(data1) data2 = { 'ID' : ['2', '3', '4'], 'Score' : [85, 95, 90] } df2 = pd.DataFrame(data2)
# Perform some basic data cleaning
df1 = df1.dropna() # drop rows with missing values in df1
df2 = df2.fillna(0) # replace missing values with 0 df2
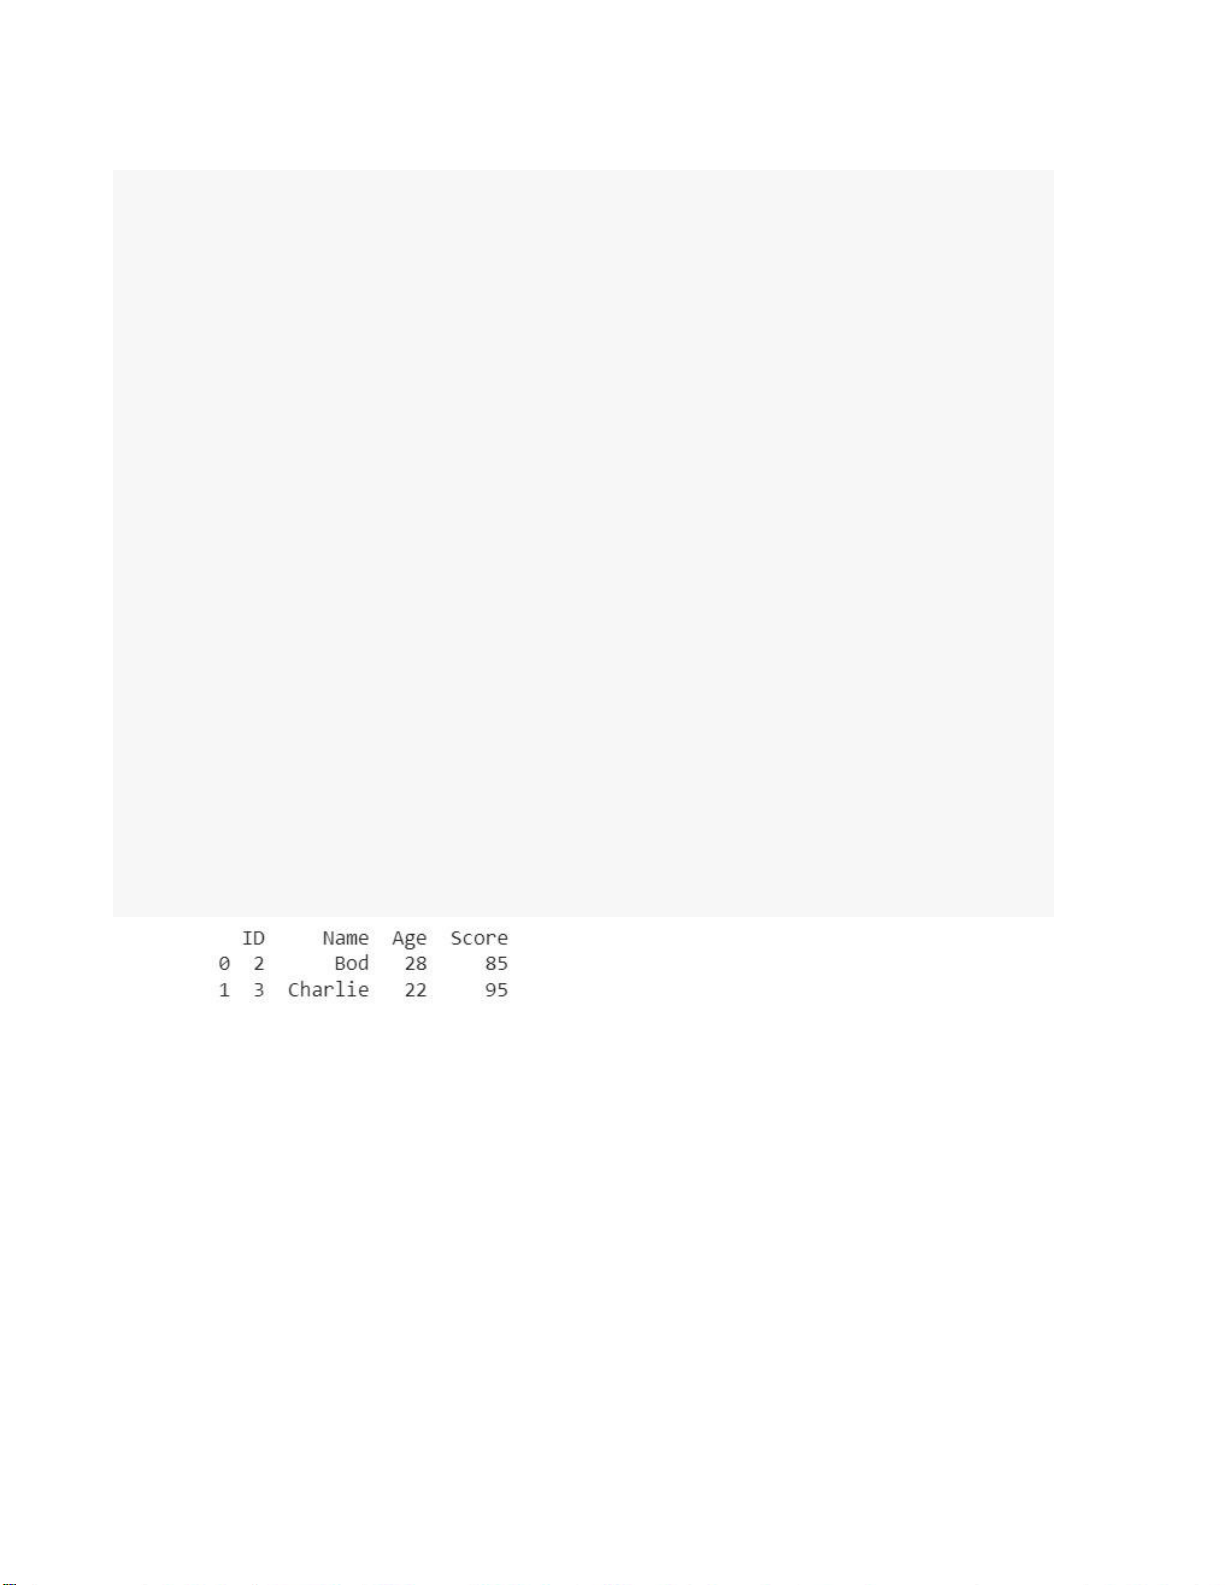
# Merge the dataframes on a common column
merged_df = pd.merge(df1, df2, on='ID') print(merged_df)
b) We will merge the details of students from two
datasets, namely student.csv and marks.csv. The student dataset
contains columns such as Age, Gender, Grade, and Employed.
The marks.csv dataset contains columns such as Mark and City.
The Student_id column is common between the two datasets.
File name: 'C2_student.csv' and 'C2_mark.csv'. lOMoARcPSD| 36991220 # Import thư viện import
pandas as pd import seaborn as sns import matplotlib.pyplot as plt import numpy as np
# load csv files as dataframe từ liên kết drive
df1 = pd.read_csv("/content/gdrive/MyDrive/AI in SC/HW2/C2_student.csv")
df2 = pd.read_csv("/content/gdrive/MyDrive/AI in SC/HW2/C2_mark.csv")
# Merge the dataframe on a common column
merged_df = pd.merge(df1,df2, on ="Student_id")
# Tạo file mới chứa dataframe merge vào đường dẫn trên googledrive
merged_df.to_csv("/content/gdrive/MyDrive/AI in
SC/HW2/merged_file.csv",index=False)
c ) Conduct “Statistics of data” as Part 1 # Display the first 5 rows print(merged_df.head()) # Display summary statistics print(merged_df.describe())
# Hiện thị thông tin của merged_df print(merged_df.info())
# Tính toán Five-number summary
summary = merged_df.describe() print("Five-number summary:\n",summary)
# Tạo tập hợp merged_df_kieuso chứa các tên cột chứa kiểu dữ liệu số lOMoARcPSD| 36991220
# tạo tập rỗng merged_df_kieuso = [] for i, feature
in enumerate(merged_df.columns[:-1]): if
merged_df.iloc[:,i].dtypes in [int,float]:
merged_df_kieuso.append(merged_df.columns[i])
# Tạo một hình nền trắng với kích thước mong
muốn plt.figure(figsize=(10,5)) for i, feature
in enumerate(merged_df_kieuso): plt.subplot(4, 4, i+1) sns.boxplot(x = merged_df[feature]) plt.tight_layout() plt.show()
# Plot pairplot to visualize the dataset
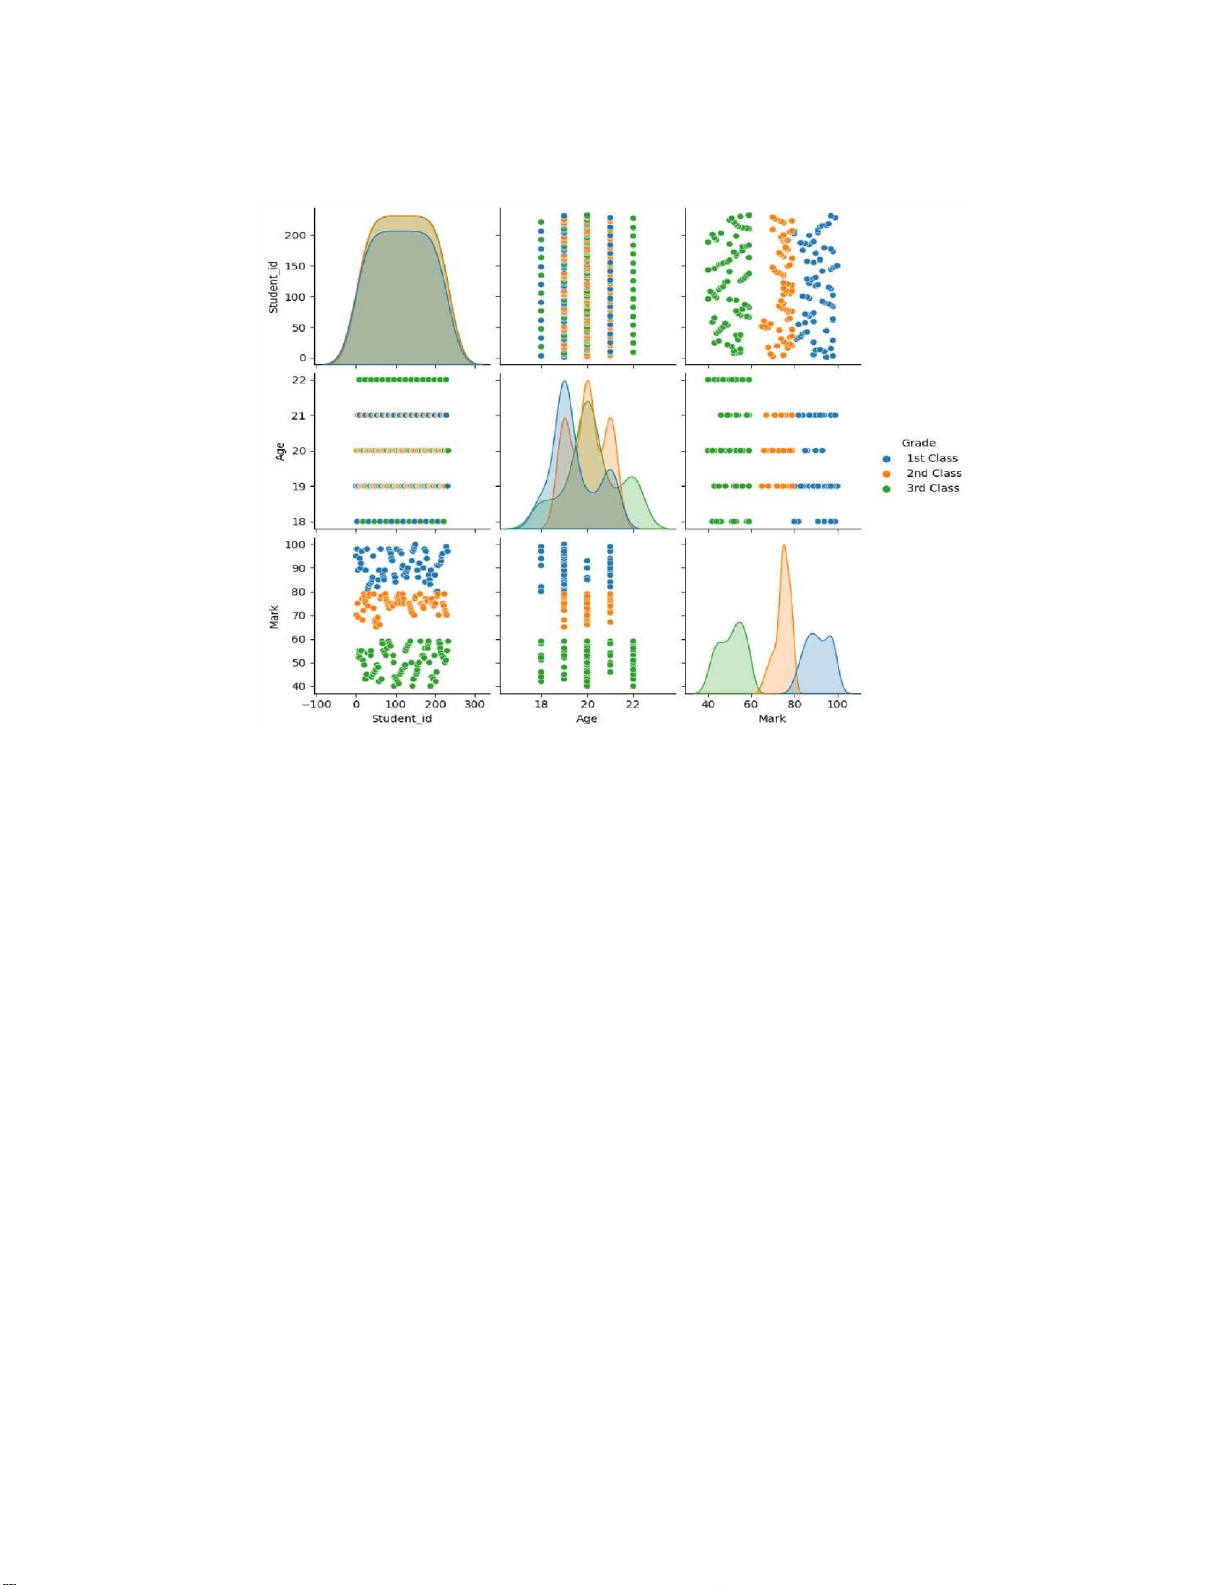
sns.pairplot(merged_df,hue="Grade") plt.show() - Kết quả:
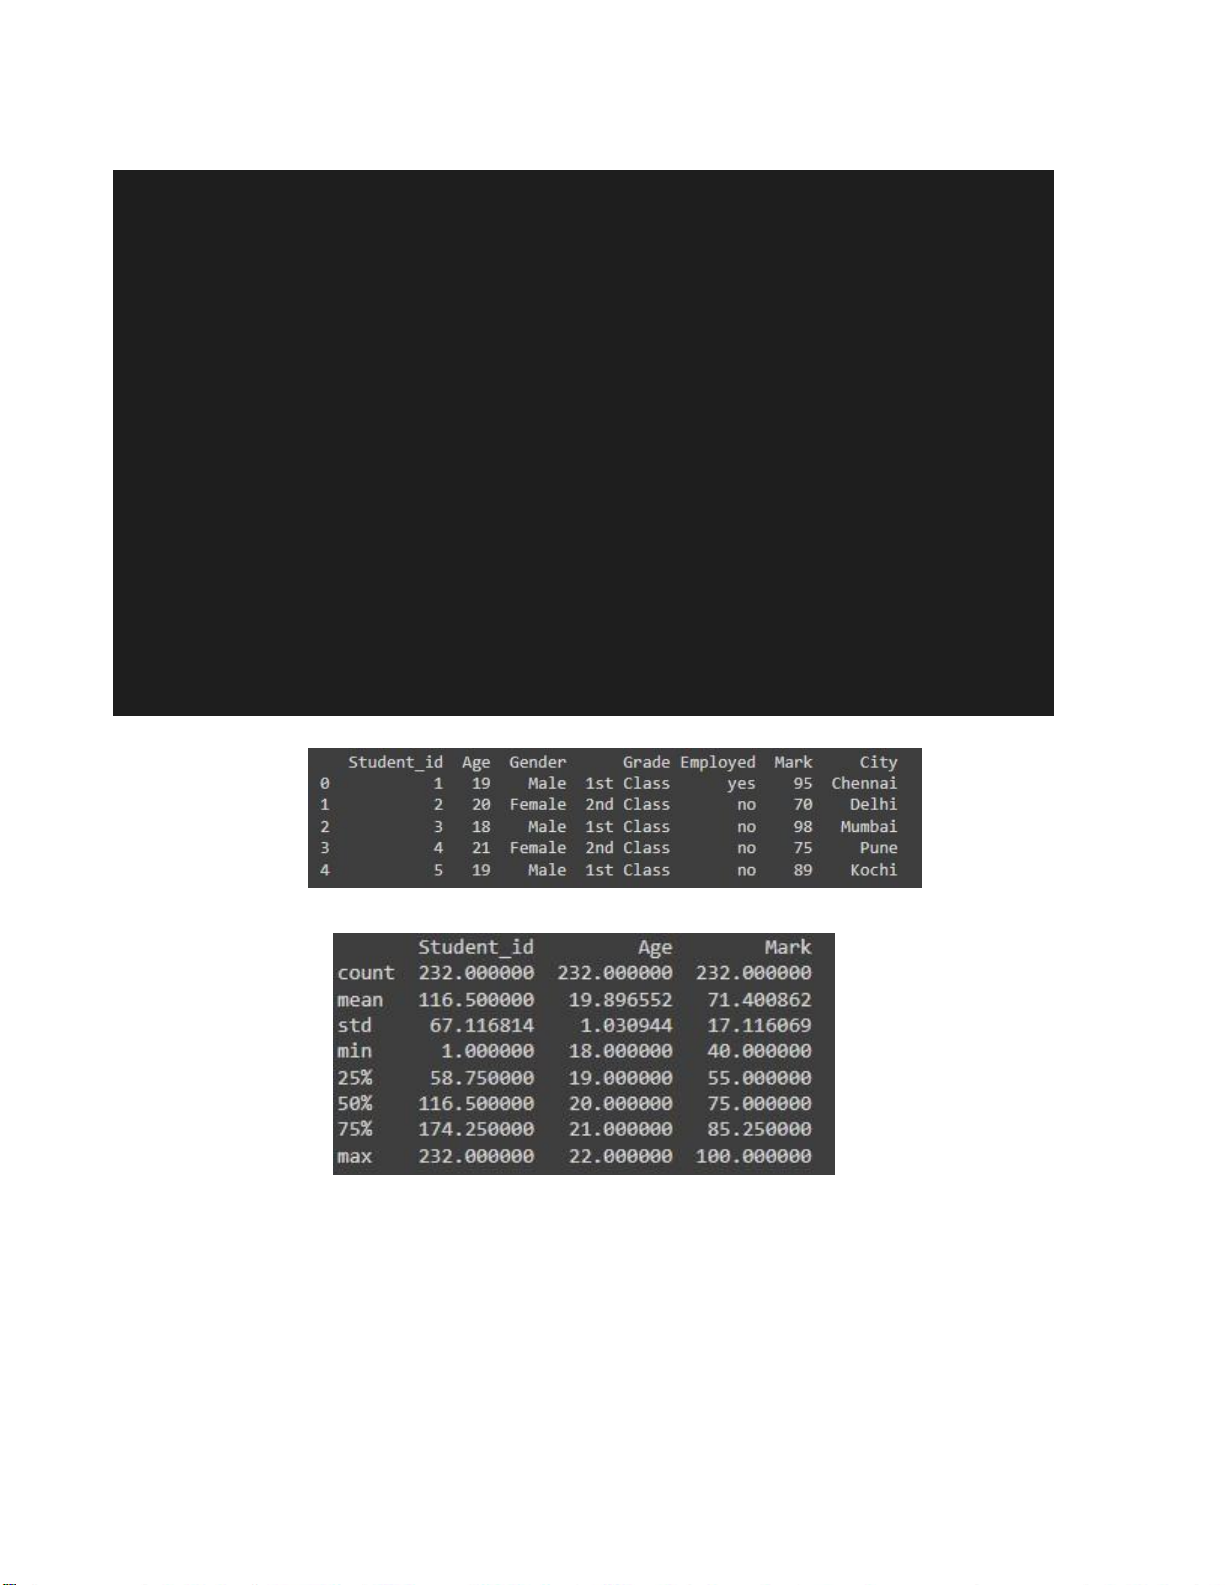
Hình 2.9. Hiển thị 5 dòng đầu của merged_df lOMoARcPSD| 36991220
Hình 2.10. Hiển thị bảng tóm tắt thống kê của merged_df
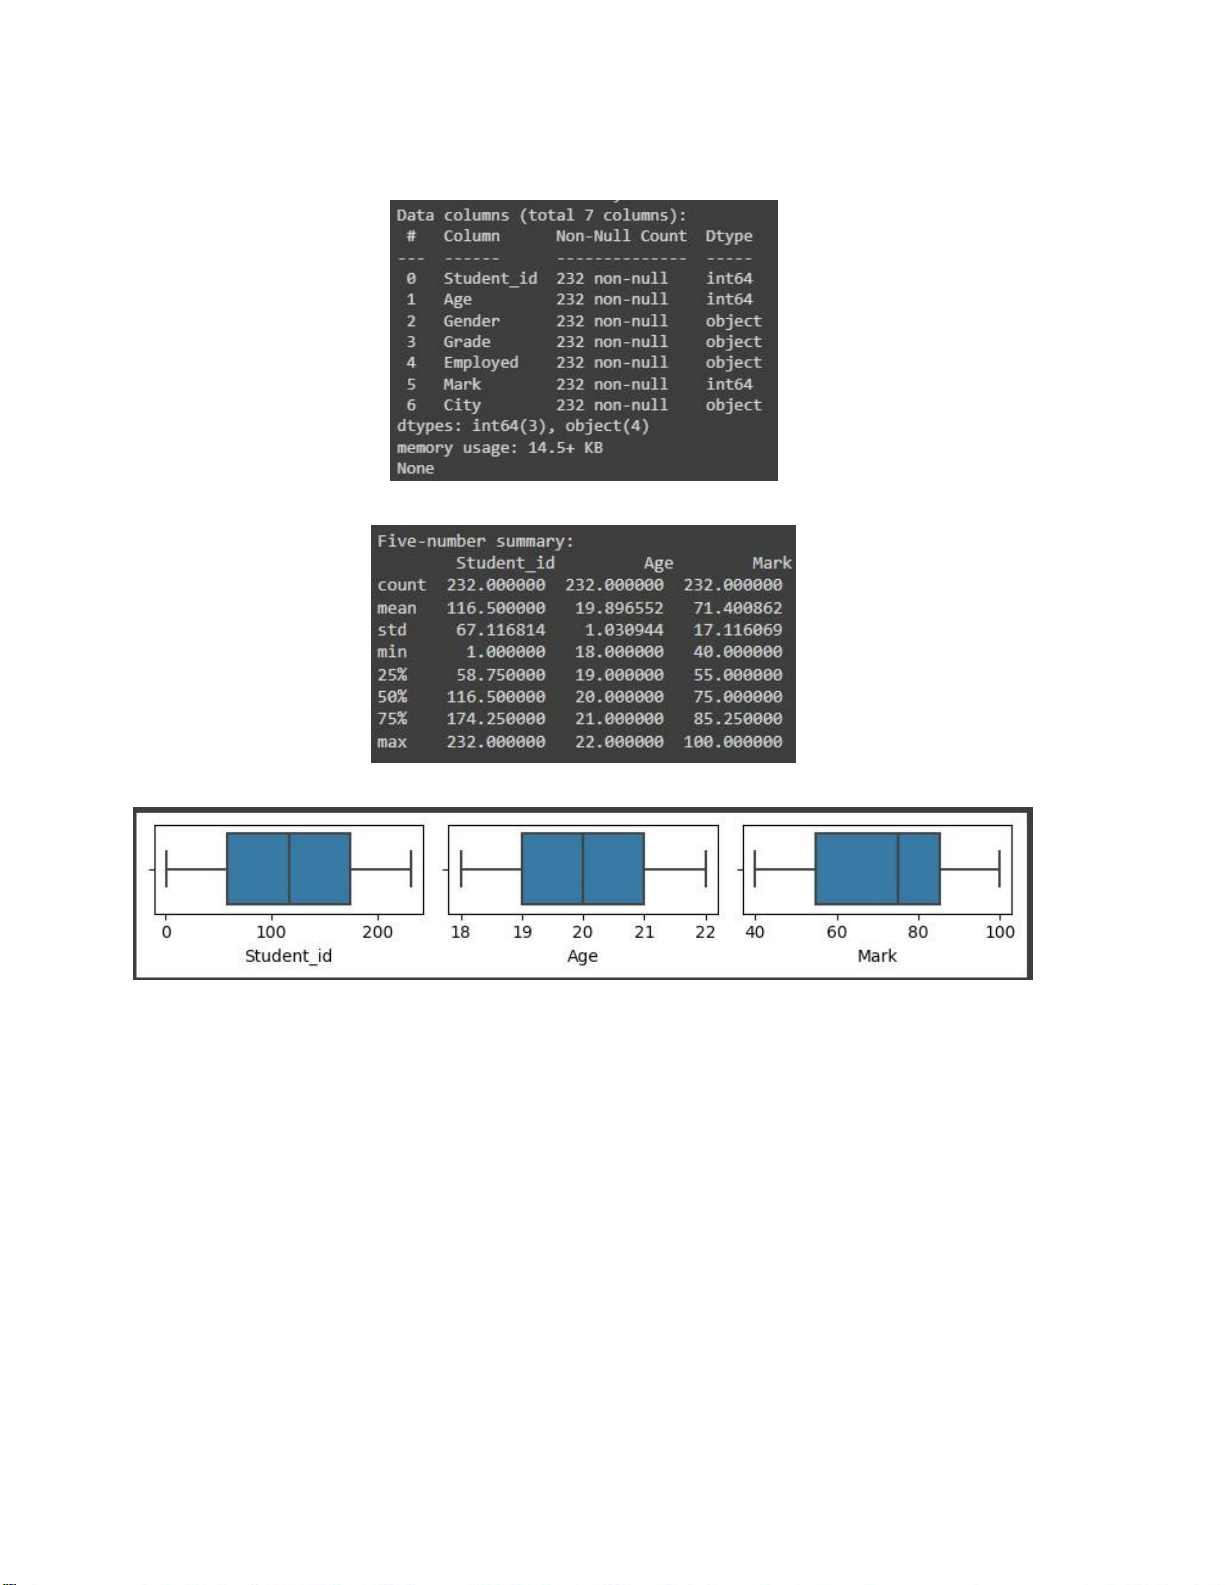
Hình 2.11. Hiển thị thông tin của merged_df
Hình 2.12. Hiển thị five-number summary lOMoARcPSD| 36991220
Hình 2.13. Boxplots cho các cột chứa dữ liệu số của merged_df
Hình 2.14. Plot paiplot to visualize dataset 1.3. Data cleaning
1.3.1. Fill missing data by using mean lOMoARcPSD| 36991220 import pandas as pd import seaborn as sns import matplotlib.pyplot as plt import numpy as np
# Tạo một dataframe với tên các cột là "Feature1" "Feature1" "ClassLabel" df = pd.DataFrame({
"Feature1": [1, 2, np.nan, 4],
"Feature2": [5, np.nan, 7, 8],
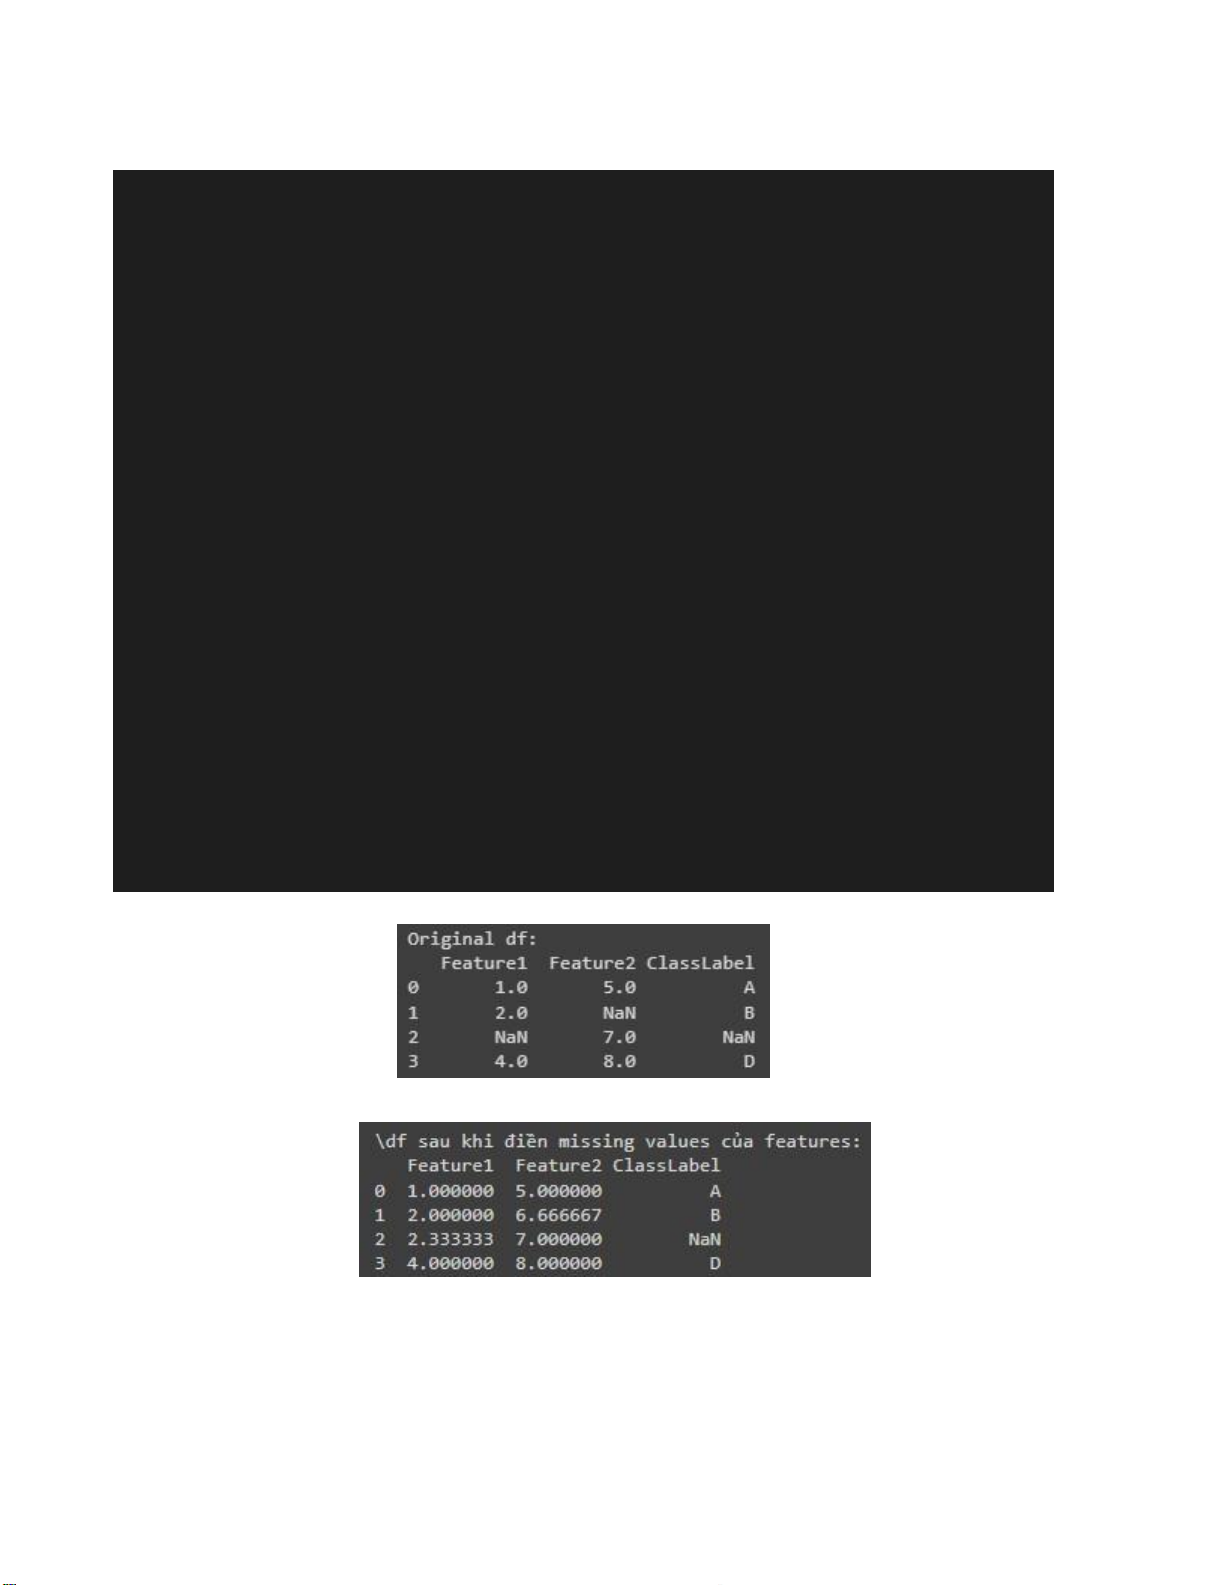
"ClassLabel": ["A","B",np.nan, "D"] }) print("Original df:") print(df) # Use mean to fill NaN values
df.fillna(df.mean(), inplace = True)
print("\df sau khi điền missing values của features:") print(df)
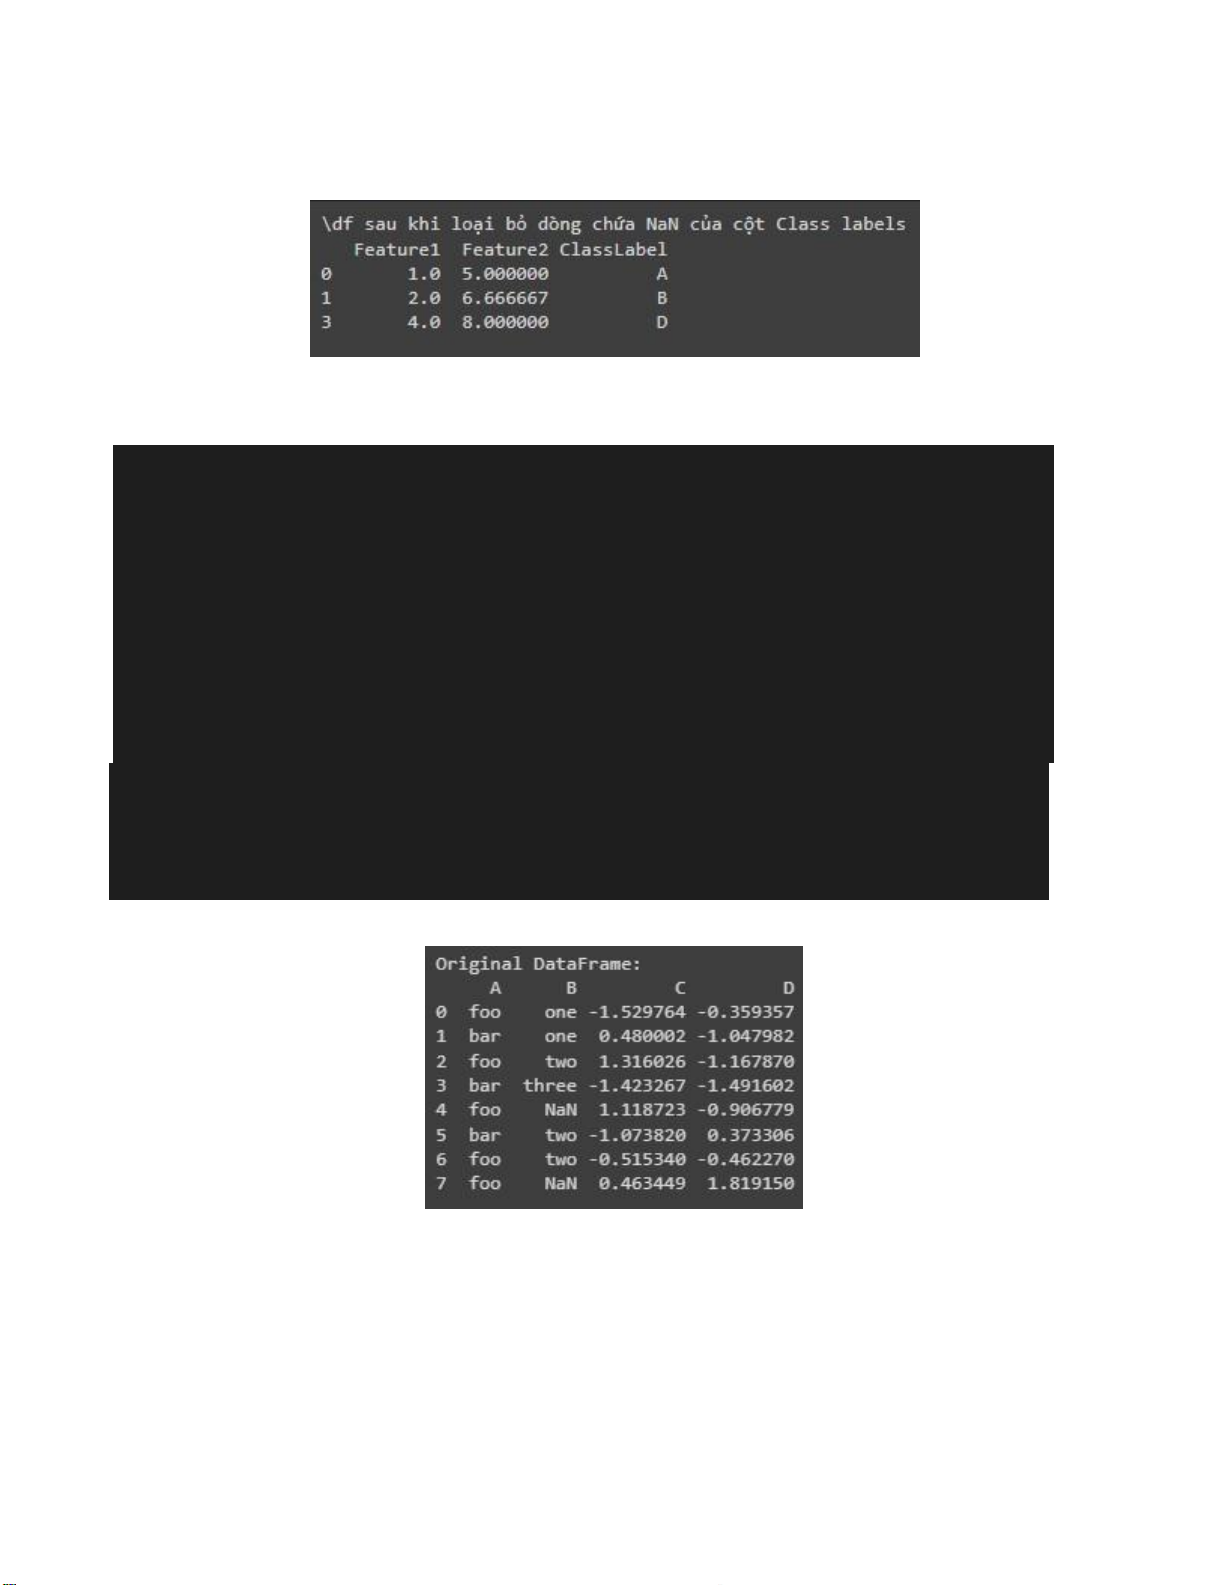
# Drop rows where classlabel is missing
df.dropna( subset=["ClassLabel"], inplace = True)
print("\df sau khi loại bỏ dòng chứa NaN của cột Class labels") print(df) - Kết quả: Hình 2.15. Input data lOMoARcPSD| 36991220
Hình 2.16. Sử dụng mean để điền giá trị NaN của các feature (kiểu số)
Hình 2.17. Xóa dòng nơi ClassLabel bị missing bởi mean
1.3.2. Fill Missing Values with the Most Frequent Value of Each Group import pandas as pd import numpy as np # Create a sample DataFrame df = pd.DataFrame({
'A': ['foo', 'bar', 'foo', 'bar', 'foo', 'bar', 'foo', 'foo'],
'B': ['one', 'one', 'two', 'three', np.nan, 'two', 'two', np.nan], 'C': np.random.randn(8), 'D': np.random.randn(8) }) print("Original DataFrame:") print(df)
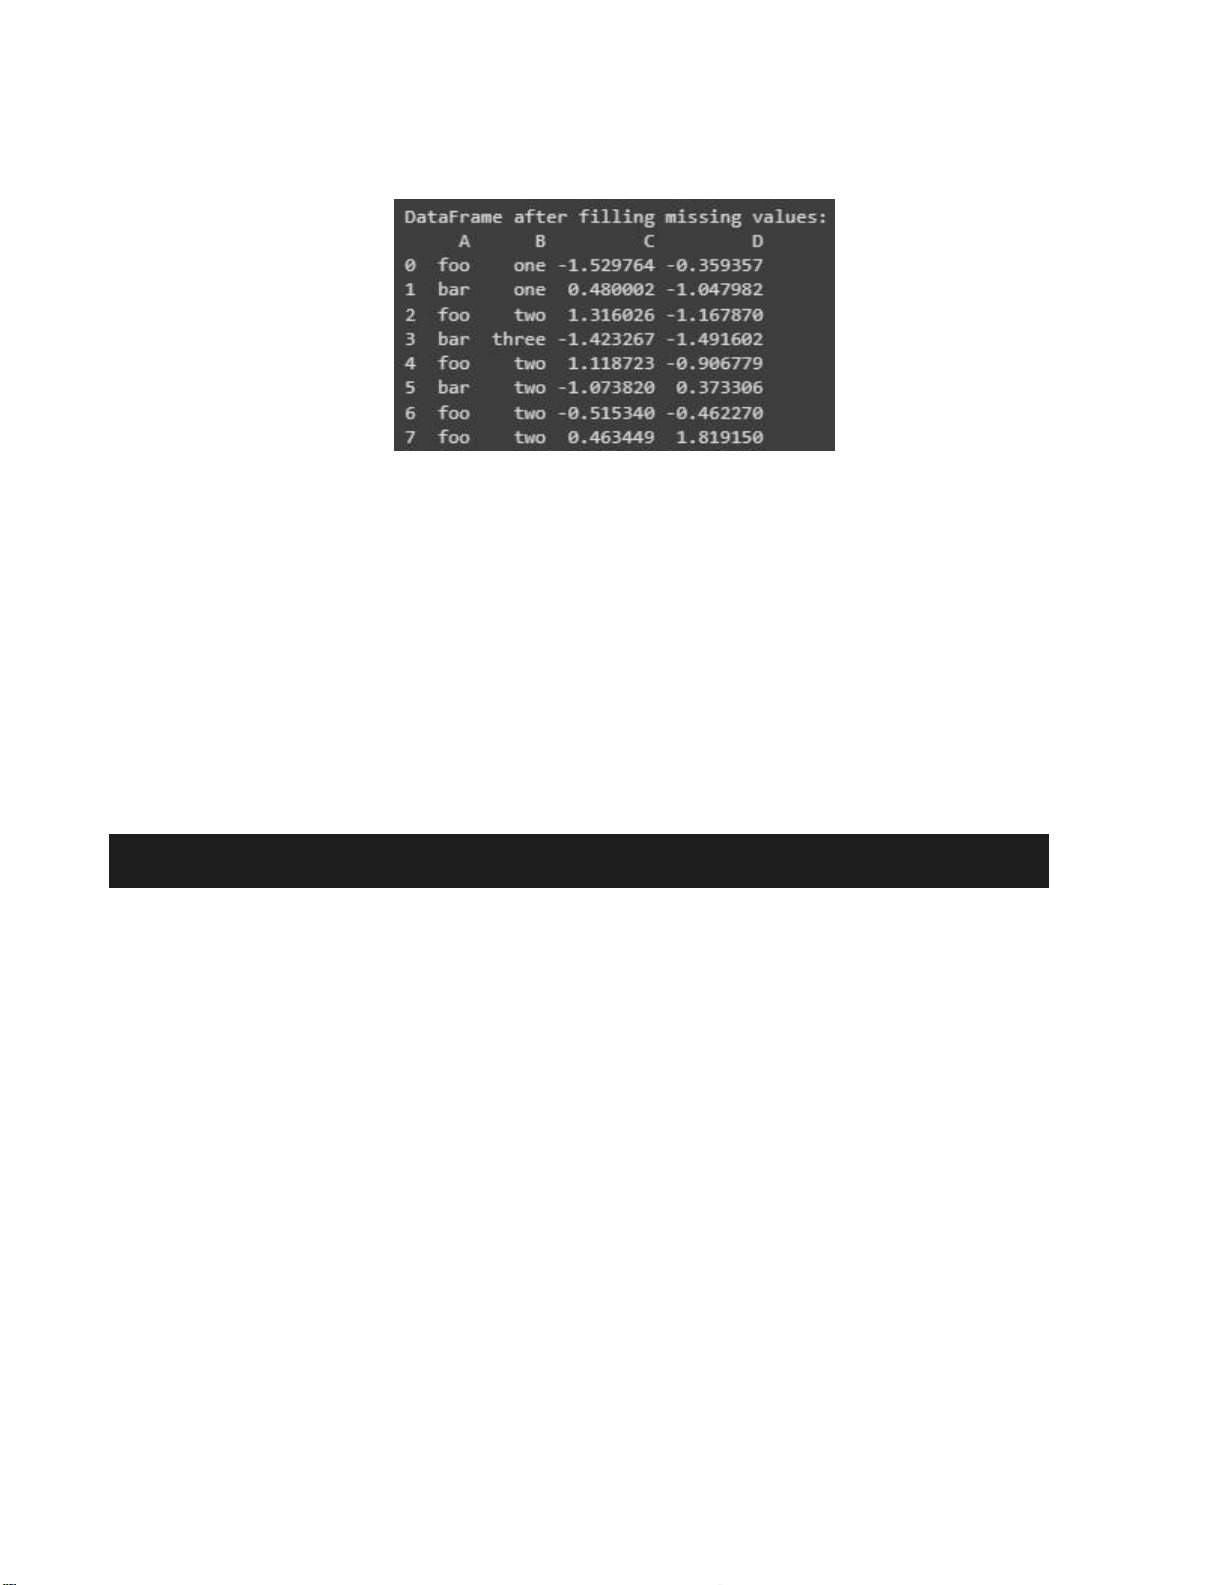
# Fill missing values in column 'B' with the most frequent value in
eachgroup defined by column 'A'
df['B'] = df.groupby('A')['B'].apply(lambda x: x.fillna(x.mode().iloc[0]
if not x.mode().empty else np.nan))
print("\nDataFrame after filling missing values:") print(df) - Kết quả: lOMoARcPSD| 36991220
Hình 2.18. Df ban đầu
Hình 2.19. Df sau khi điền missing values
1.3.3. Questions/ Requirements
a. Read and type Python code by yourself
b. For ex 2.2.1, please fill “median” instead of “mean”
c. Please explain by your own words the following code and how you understand about it
df['B'] = df.groupby('A')['B'].apply(lambda x: x.fillna(x.mode().iloc[0]
if not x.mode().empty else np.nan)) Explain:
- df.groupby('A')['B']: Ở đây, dữ liệu trong df được nhóm lại dựa trên giá trị của cột
'A' và sau đó ta lựa chọn cột 'B' từ các nhóm này.
Ví dụ: trong bài trên thì các giá trị trong cột A chia làm các nhóm (mỗi nhóm là 1
giá trị riêng biệt của A):
A1= “foo” = {one, two, Nan, two, Nan, } (các giá trị trong tập hợp là các
giá trị của bên cột B ứng với giá trị “foo” của cột A)
A2= “bar” = {one, three, two} (tương tự trên)
- .apply(lambda x: ... ): Sau khi đã nhóm các dữ liệu, ta sử dụng phương thức apply
để áp dụng một hàm lambda (hàm ẩn danh) cho mỗi nhóm cụ thể của cột 'B'. lOMoARcPSD| 36991220
Khi hàm apply() được thực hiện, hàm lambda sẽ được áp dụng cho mỗi nhóm này
một cách riêng lẻ. x sẽ lần lượt đại diện cho các series:
Thứ nhất, x đại diện series chứa các giá trị [one, two, Nan, two, Nan] của Nhóm foo của cột A
Thứ hai, x đại diện series chứa các giá trị [one, three, two] của Nhóm bar của cột A
- x.fillna(...): Trong hàm lambda, mục tiêu chính là điền các giá trị thiếu (NaN) trong series x.
- x.mode().iloc[0]`: Lấy mode đầu tiên nếu có nhiều mode (Nếu có nhiều mode thì
kết quả sẽ trả về series và iloc[o] là hàng đầu tiên của series đó). Nếu x không có giá trị nào
(ví dụ: tất cả là NaN), hoặc không có mode (không có giá trị nào xuất hiện nhiều lần nhất),
x.mode() sẽ trả về một Series rỗng.
- if not x.mode().empty else np.nan: Điều kiện này kiểm tra xem mode có rỗng
không (tức là không có giá trị nào xuất hiện nhiều nhất). Nếu mode rỗng, hàm sẽ trả về
np.nan, nghĩa là không thay đổi giá trị NaN ban đầu. Nếu mode không rỗng, giá trị NaN sẽ
được thay thế bằng mode.
- `df['B'] = ...`: Gán kết quả trở lại cho cột 'B' của DataFrame df
1.4. Data transformation
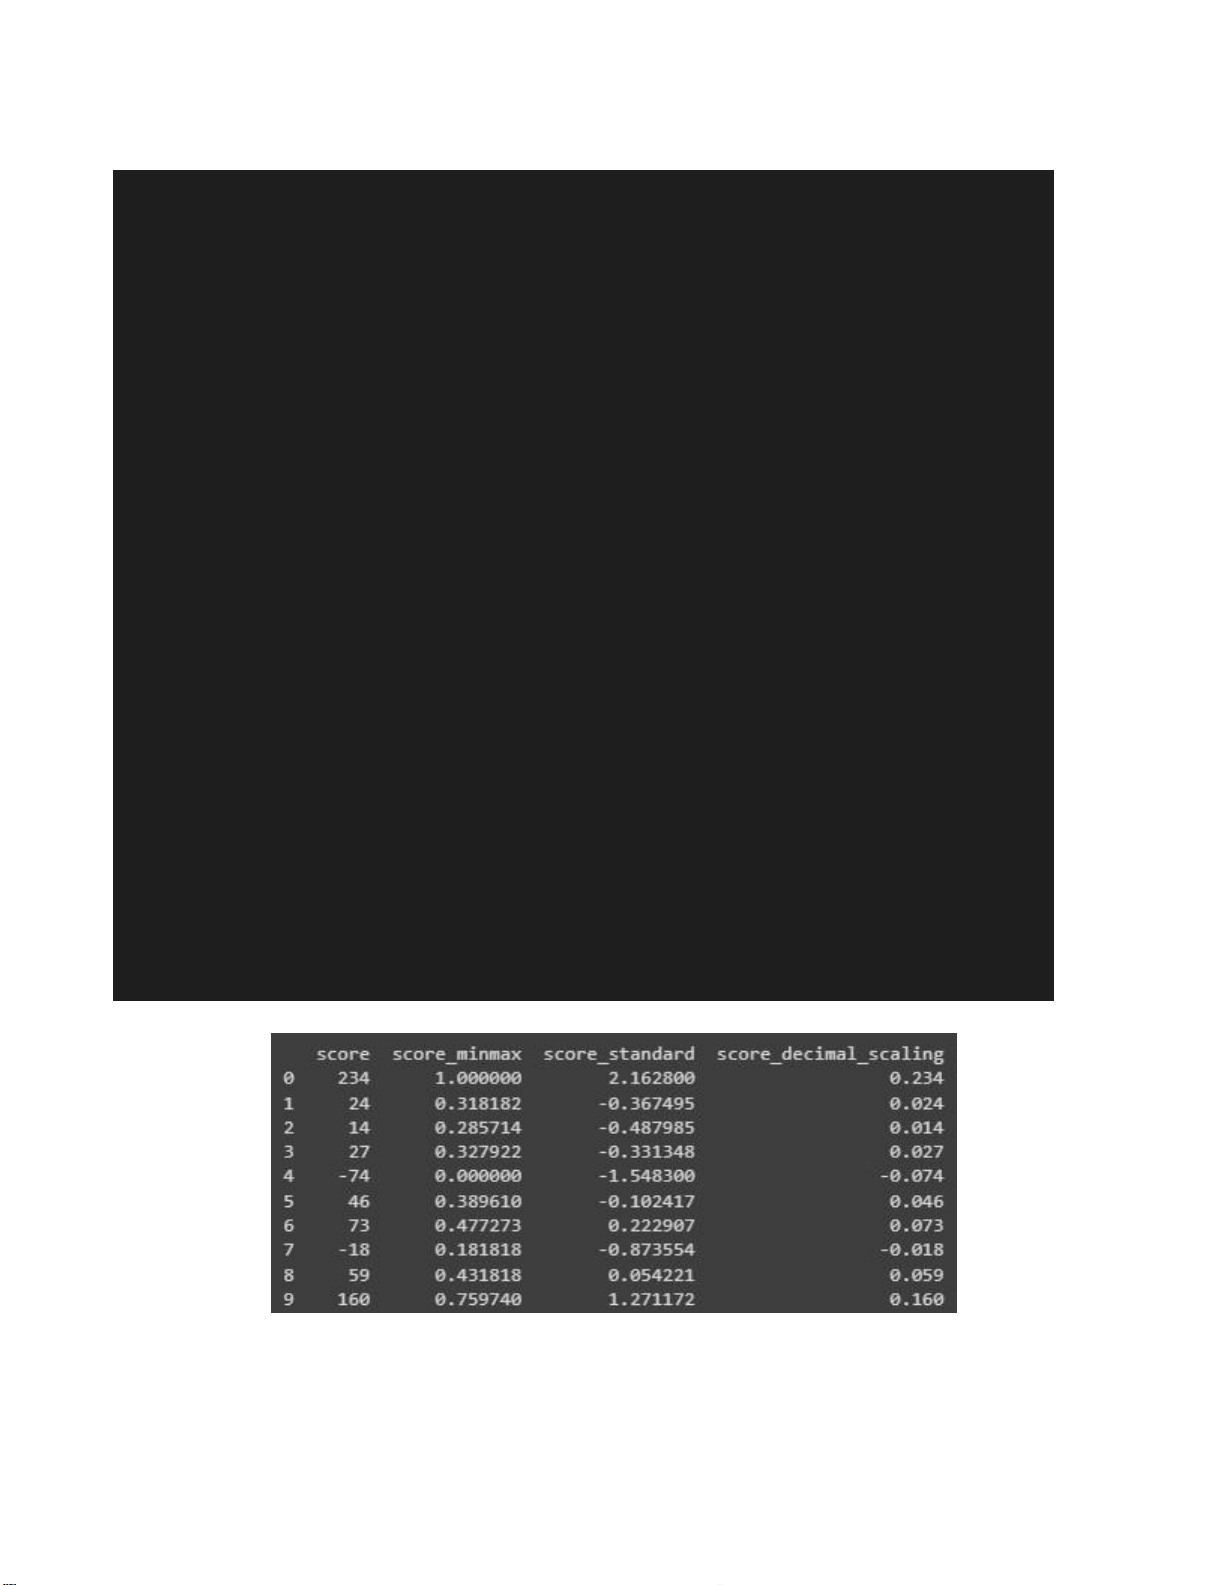
1.4.1. Data Normalization lOMoARcPSD| 36991220 # Import thư viện import pandas as pd
from sklearn import preprocessing import numpy as np # Example tạo DataFrame data = {
'score': [234, 24, 14, 27,-74, 46, 73, -18, 59, 160], } df = pd.DataFrame(data) # Min-max normalization
min_max_scaler = preprocessing.MinMaxScaler() df_minmax =
min_max_scaler.fit_transform(df[['score']]) # Tạo cột
score_minmax mới chứa các giá trị df_minmax
df['score_minmax'] = df_minmax # Z-score normalization
standard_scaler = preprocessing.StandardScaler()
df_standard = standard_scaler.fit_transform(df[['score']])
df['score_standard'] = df_standard # Decimal scaling
max_abs_val = df['score'].abs().max()
num_digits = int(np.floor(np.log10(max_abs_val)) + 1)
df['score_decimal_scaling'] = df['score'] / (10 ** num_digits) print(df) - Kết quả: lOMoARcPSD| 36991220
Hình 2.20. Data Normalization by using minmax, Z-score normalization and Decimal scaling
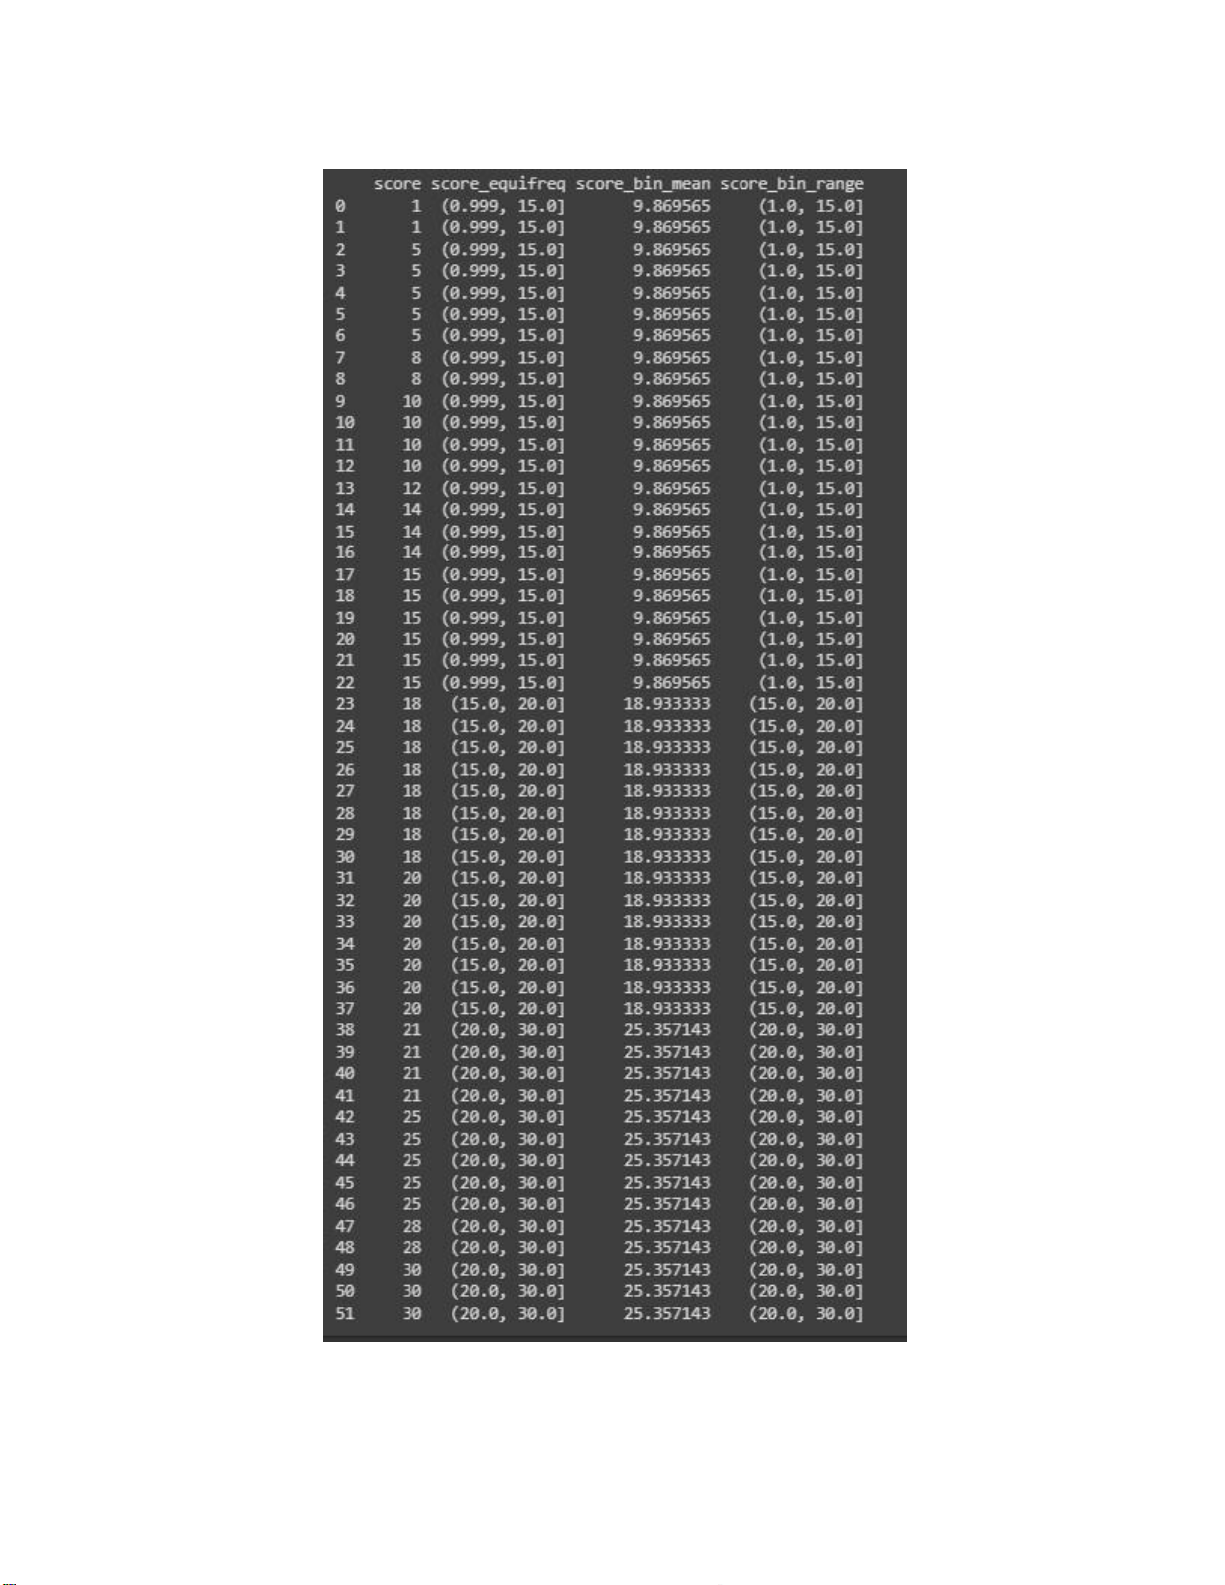
1.4.2. Data Discretization import numpy as np import pandas as pd # Example DataFrame data = {
'score': [1, 1, 5, 5, 5, 5, 5, 8, 8, 10,
10, 10, 10, 12, 14, 14, 14, 15, 15, 15, 15, 15,
15, 18, 18, 18, 18, 18, 18, 18, 18, 20, 20, 20,
20, 20, 20, 20, 21, 21, 21, 21, 25, 25, 25, 25, 25, 28, 28, 30, 30, 30], } df = pd.DataFrame(data)
# Equal-frequency (equi-depth) bins num_bins = 3
df["score_equifreq"] = pd.qcut(df["score"],q = num_bins) df # Bin means
bin_means = df.groupby('score_equifreq')['score'].mean()
df['score_bin_mean'] = df['score_equifreq'].map(bin_means)
# Bin boundaries bin_ranges = df['score_equifreq'].apply(lambda
x: pd.Interval(left=np.round(x.left, 2), right=np.round(x.right, 2)))
df['score_bin_range'] = bin_ranges print(df) - Kết quả: lOMoARcPSD| 36991220 lOMoARcPSD| 36991220
Hình 2.21. Data Discretization
1.4.3. Questions/ Requirements a.
Read and type Python code by yourself in both Data Normalization and DataDiscretization. b.
How you understand following code:
# Equal-frequency (equi-depth) bins num_bins = 3
df["score_equifreq"] = pd.qcut(df["score"],q = num_bins) Explain:
qcut là một hàm của pandas dùng để chia dữ liệu thành các khoảng có số lượng
phần tử tương đối bằng nhau. (với q: là số khoảng muốn chia)
Trong trường hợp này, ta đang chia dữ liệu trong cột score của df thành 3 khoảng có
số lượng phần tử tương đối bằng nhau.
df["score_equifreq"] = ...: tạo một cột mới trong df tên là score_equifreq, trong đó
mỗi giá trị là khoảng mà giá trị tương ứng trong cột score thuộc về. # Bin means
bin_means = df.groupby('score_equifreq')['score'].mean()
df['score_bin_mean'] = df['score_equifreq'].map(bin_means) Explain:
df.groupby('score_equifreq')['score'].mean(): Tính giá trị trung bình “score” ứng
với từng khoảng trong cột “score_equifreq”.
df['score_bin_mean'] = df['score_equifreq'].map(bin_means): Tạo một cột mới
có tên”score_bin_mean” chứa các giá trị trong “bin_means” ứng với từng khoảng trong
“score_equifreq” (ví dụ: nếu khoảng đó là (0.999, 15.0) thì giá trị điền vào cột”
score_bin_mean” là 9.869565 nằm trong “bin_means”). # Bin boundaries bin_ranges =
df['score_equifreq'].apply(lambda x:
pd.Interval(left=np.round(x.left, 2), right=np.round(x.right, 2))) lOMoARcPSD| 36991220
df['score_bin_range'] = bin_ranges Explain:
- pd.Interval(left=np.round(x.left, 2), right=np.round(x.right, 2)): Tạo ra một
khoảng mới có giới hạn hai biên được làm tròn đến 2 chữ số thập phân. - bin_ranges =
df['score_equifreq'].apply(lambda x:
pd.Interval(left=np.round(x.left,2), right=np.round(x.right, 2))): tạo cột tên “bin_ranges”
chứa các khoảng trong 'score_equifreq' đã được làm tròn 2 biên giới hạn.
c. Write result from Data Discretization to file namely: “Data_Discretization”