BÀI VIẾT TASK 1 - It's truely an useful material
BÀI VIẾT TASK 1 - It's truely an useful material.
Môn: Business english (BS) 10 tài liệu
Trường: Trường Đại học Ngoại ngữ, Đại học Đà Nẵng 292 tài liệu
Tác giả:


Preview text:
lOMoAR cPSD| 30964149 lOMoAR cPSD| 30964149
BÀI VIẾT TASK 1 - It's truely an useful material.
Business English (Trường Đại học Ngoại ngữ, Đại học Đà Nẵng) lOMoAR cPSD| 30964149 1. 18/3/2017
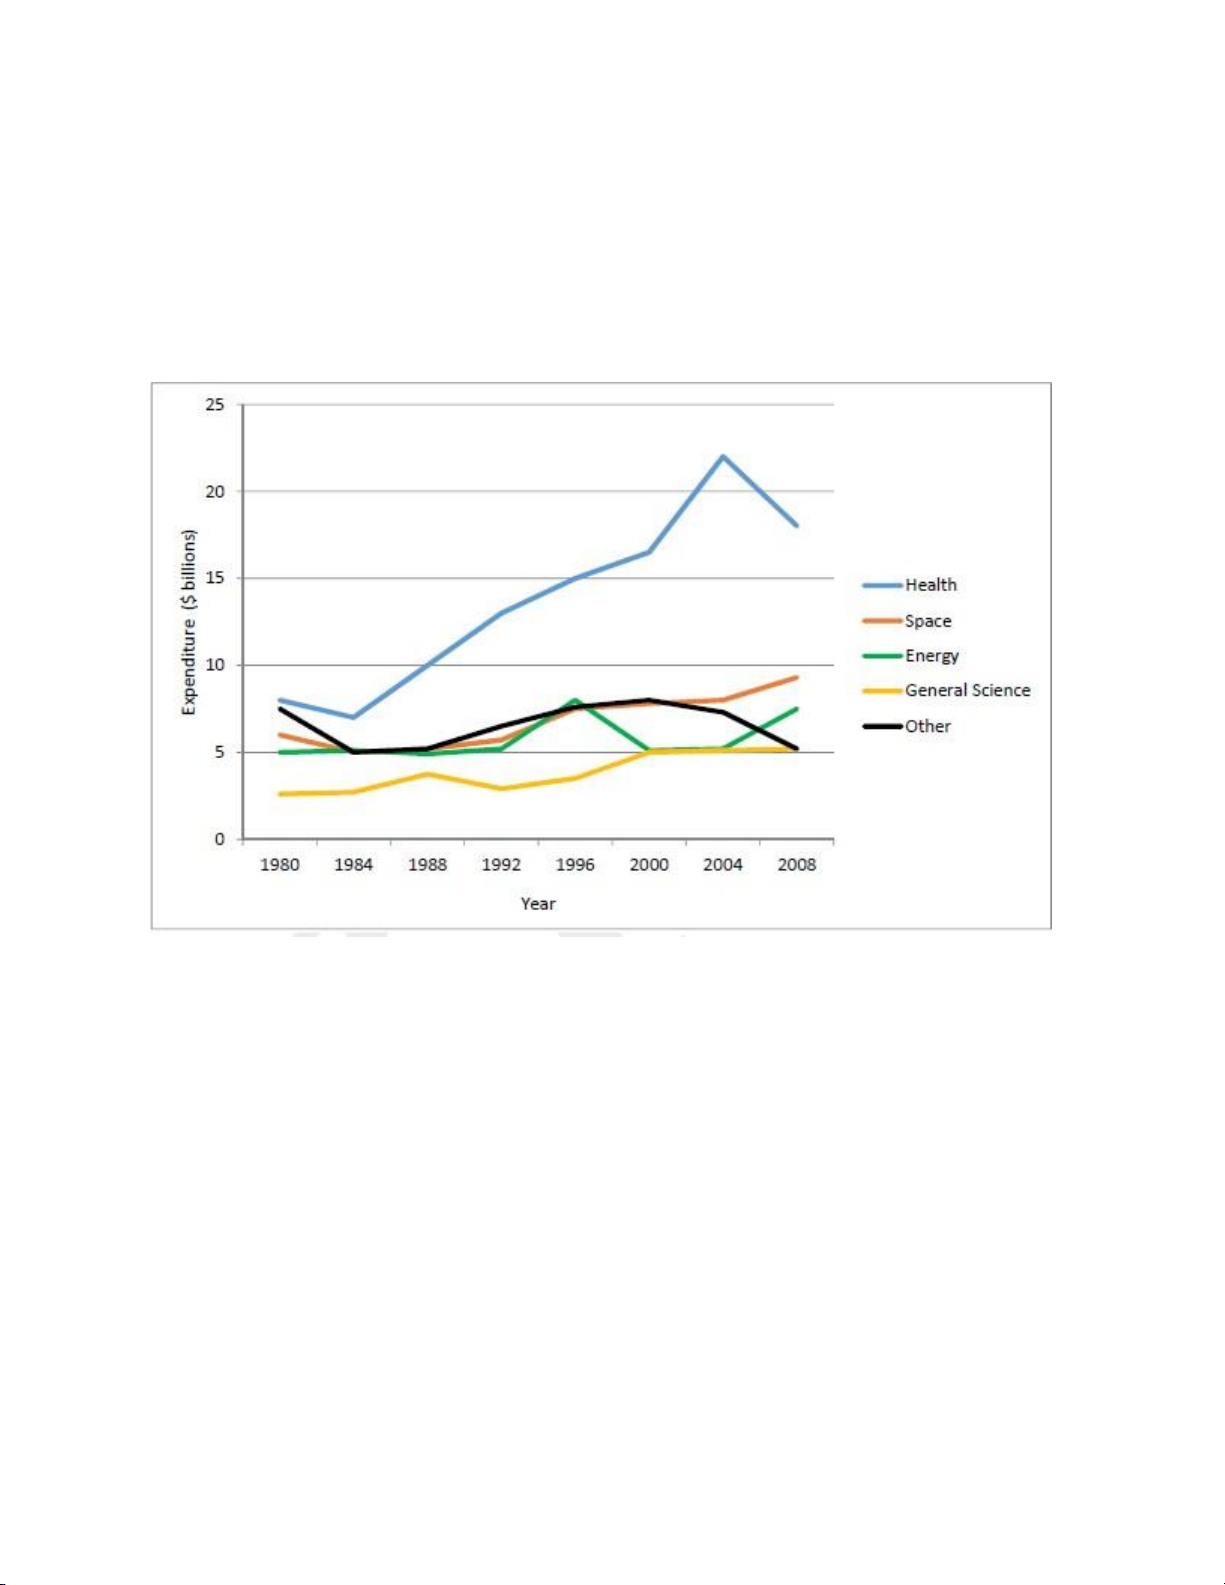
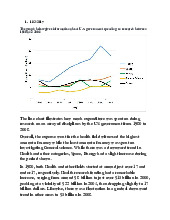
The graph below gives information about U.S. government spending on research between 1980 and 2008
The line chart illustrates how much expenditure was spent on doing
research on an array of disciplines by the US government from 1980 to 2008.
Overall, the expense went for the health field witnessed the highest
amount of money while the least amount of money was spent on
investigating General science. While there was a downward trend in
Health and other categories, Space, Energy had a slight increase during the period shown.
In 1980, both Health and other fields started at around just over 17 and
under 17, respectively. Health research funding had a remarkable
increase, surging from around $ 8 billion to just over $15 billion in 2000,
peaking at a vicinity of $ 22 billion in 2004, then dropping slightly to 17
billion dollars. Likewise, there was a fluctuation in a gradual downward
trend in other areas to $5 billion in 2008. lOMoAR cPSD| 30964149
On the other hand, starting at $5 billion in 1980, energy investigation
funding reached a high of roughly $7 billion in 1996. This figure
remained static at $5 billion from 2000 to 2004, then rose to just under
$7 billion. Similarly, the expenditure used for researching into Space
fluctuated in a growth to just under $10 billion in 2008. The amount of
money spent on researching General Science however was the lowest of
all research categories, beginning at $2.5 billion in 1980 and rising to just over $5 billion by 2008.
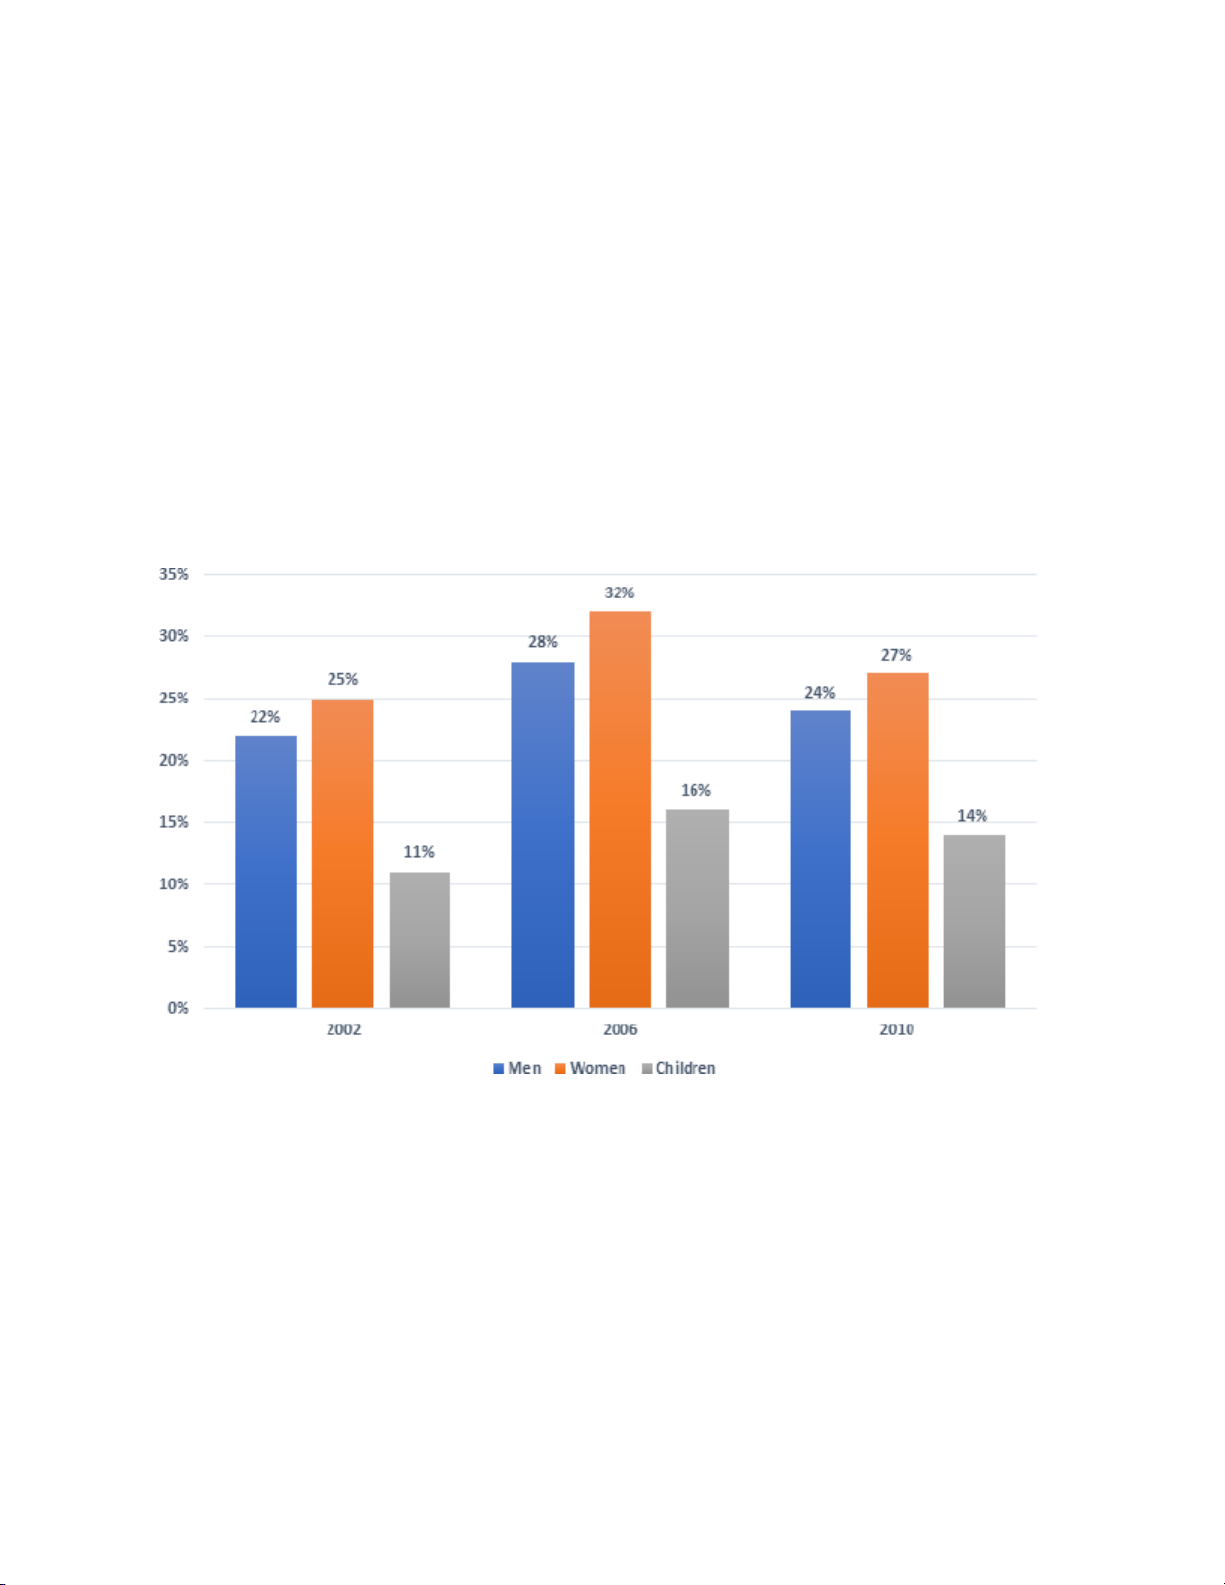
2. The chart below shows the percentage of the population in the UK who consumed
the recommended daily amount of fruit and vegetables in 2002, 2006 and 2010.
The bar chart depicts the proportion of dwellers in the UK who
consumed the recommended amount of fruit and vegetables regularly in
three distinct genders in 2002, 2006, and 2010.
What stands out from the chart is that the majority of females witnessed
the highest proportion of eating organic food. In contrast, the lowest
figure belonged to their offspring. lOMoAR cPSD| 30964149
As can be seen from the chart, in 2002, about 22% of males consumed
enough plant food, while this figure for women was one–quarter in
comparison with the population in the UK. Both genders increased
slightly by around 6% after 4 years, reaching a high of 28% and 32%,
respectively. However, the proportion of men who ate recommended
fruit and vegetables declined to 24%, whereas this figure for women was 27%.
On the other hand, the smallest percentage of people consuming
essential plant food was children constituted11% in 2002, around half as
much as that of gentlemen. Following that, this figure for children
slightly increased to 16% in 2006 and then had a downward trend to 14% in 2010. 1. 8/6/2017
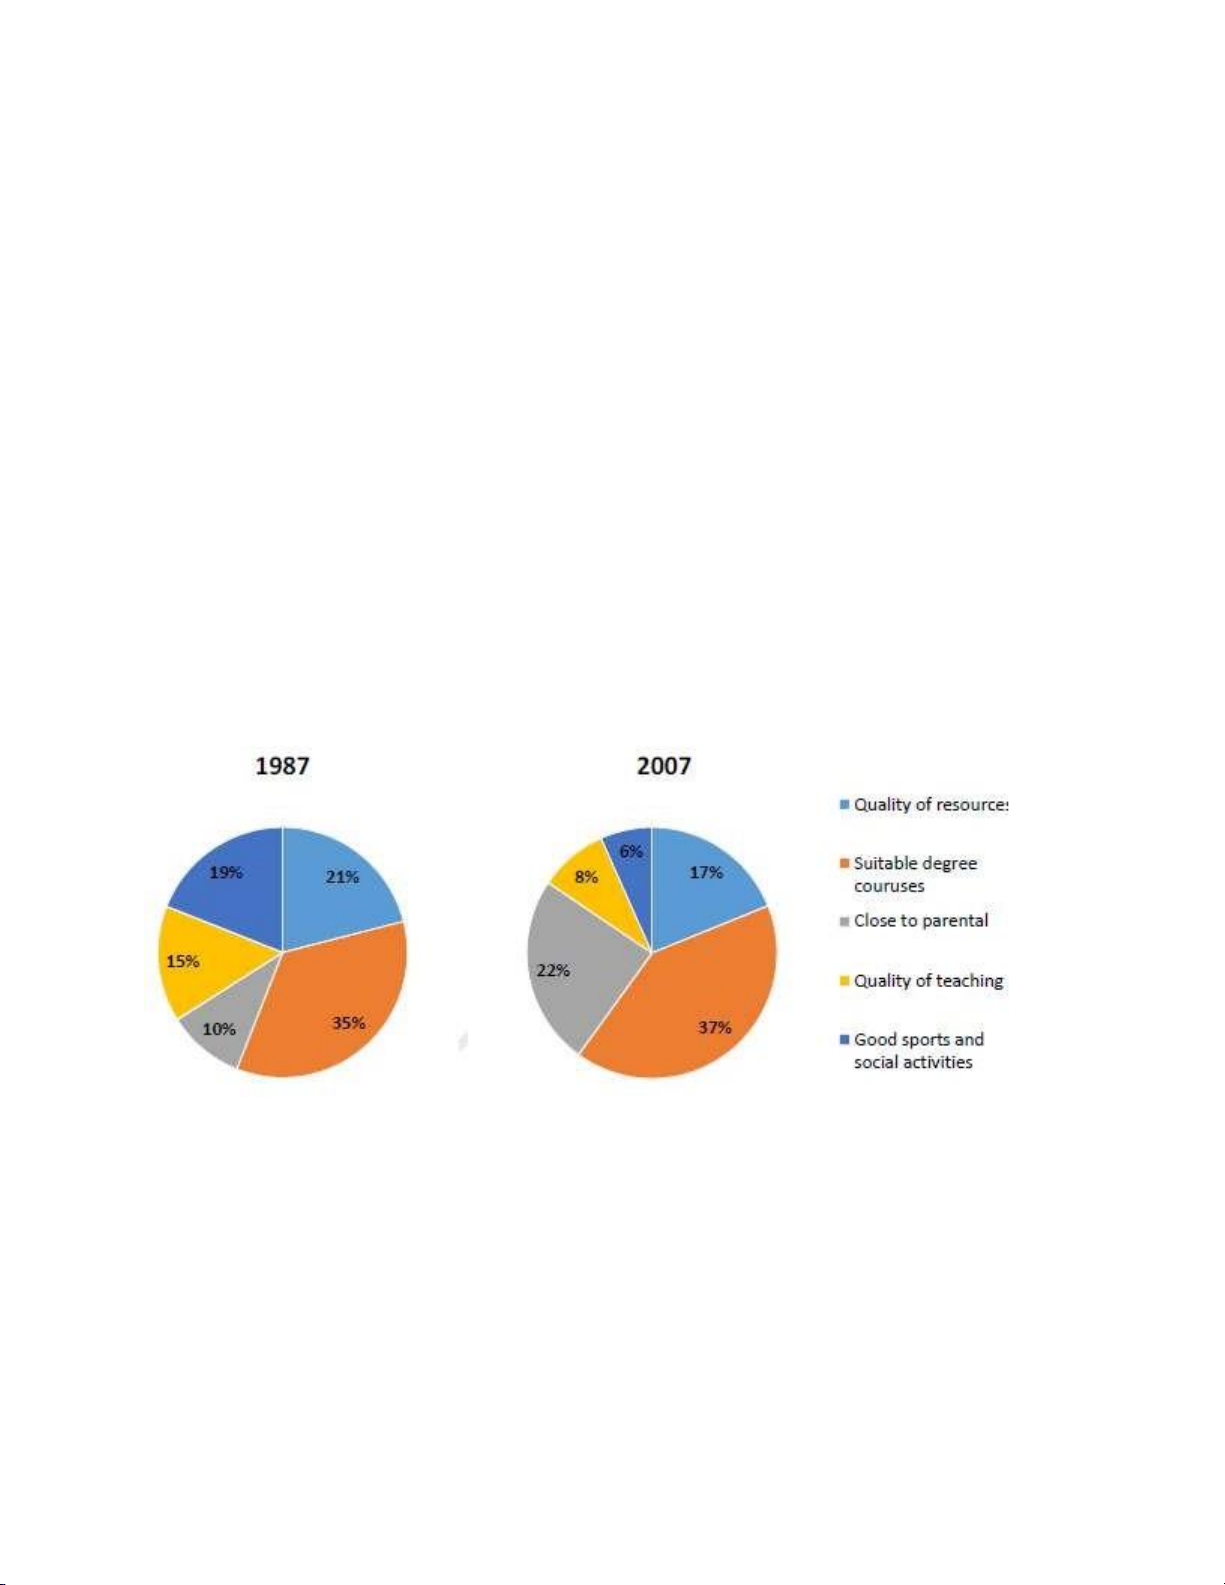
The pie charts below show the main reasons why students chose to study at a particular UK
University in 1987 and 2007.
The pie charts compare the proportion of major reasons why students
opted for studying at a specific UK University in 1987 and 2007.
It is clear that suitable degree couruses were the most significant
concern of students in both years. Also, the proportion of the reason for
closing to parental increased, while the figures for quality of teaching
and good sports, as well as social activities, witnessed an opposing trend. lOMoAR cPSD| 30964149
In 1987, students decided to study at a particular UK university due to
the suitable degree couruses accounted for the highest proportion, at
35% in total, which increased marginally to 37% in 2007. This figure for
close to the parental was substantial lower, at 10% before rising
dramatically to 22% 20 years later.
About the other reasons, in the first year, the proportion of quality of
resources, teaching, good sports, and social activities comprised 55% of
the total reasons decided among students. These figures had a
remarkable decline to less than 50% in comparison to the other given
reasons, to 17%, 8% and 6% respectively. 1. 29/9/2018 lOMoAR cPSD| 30964149
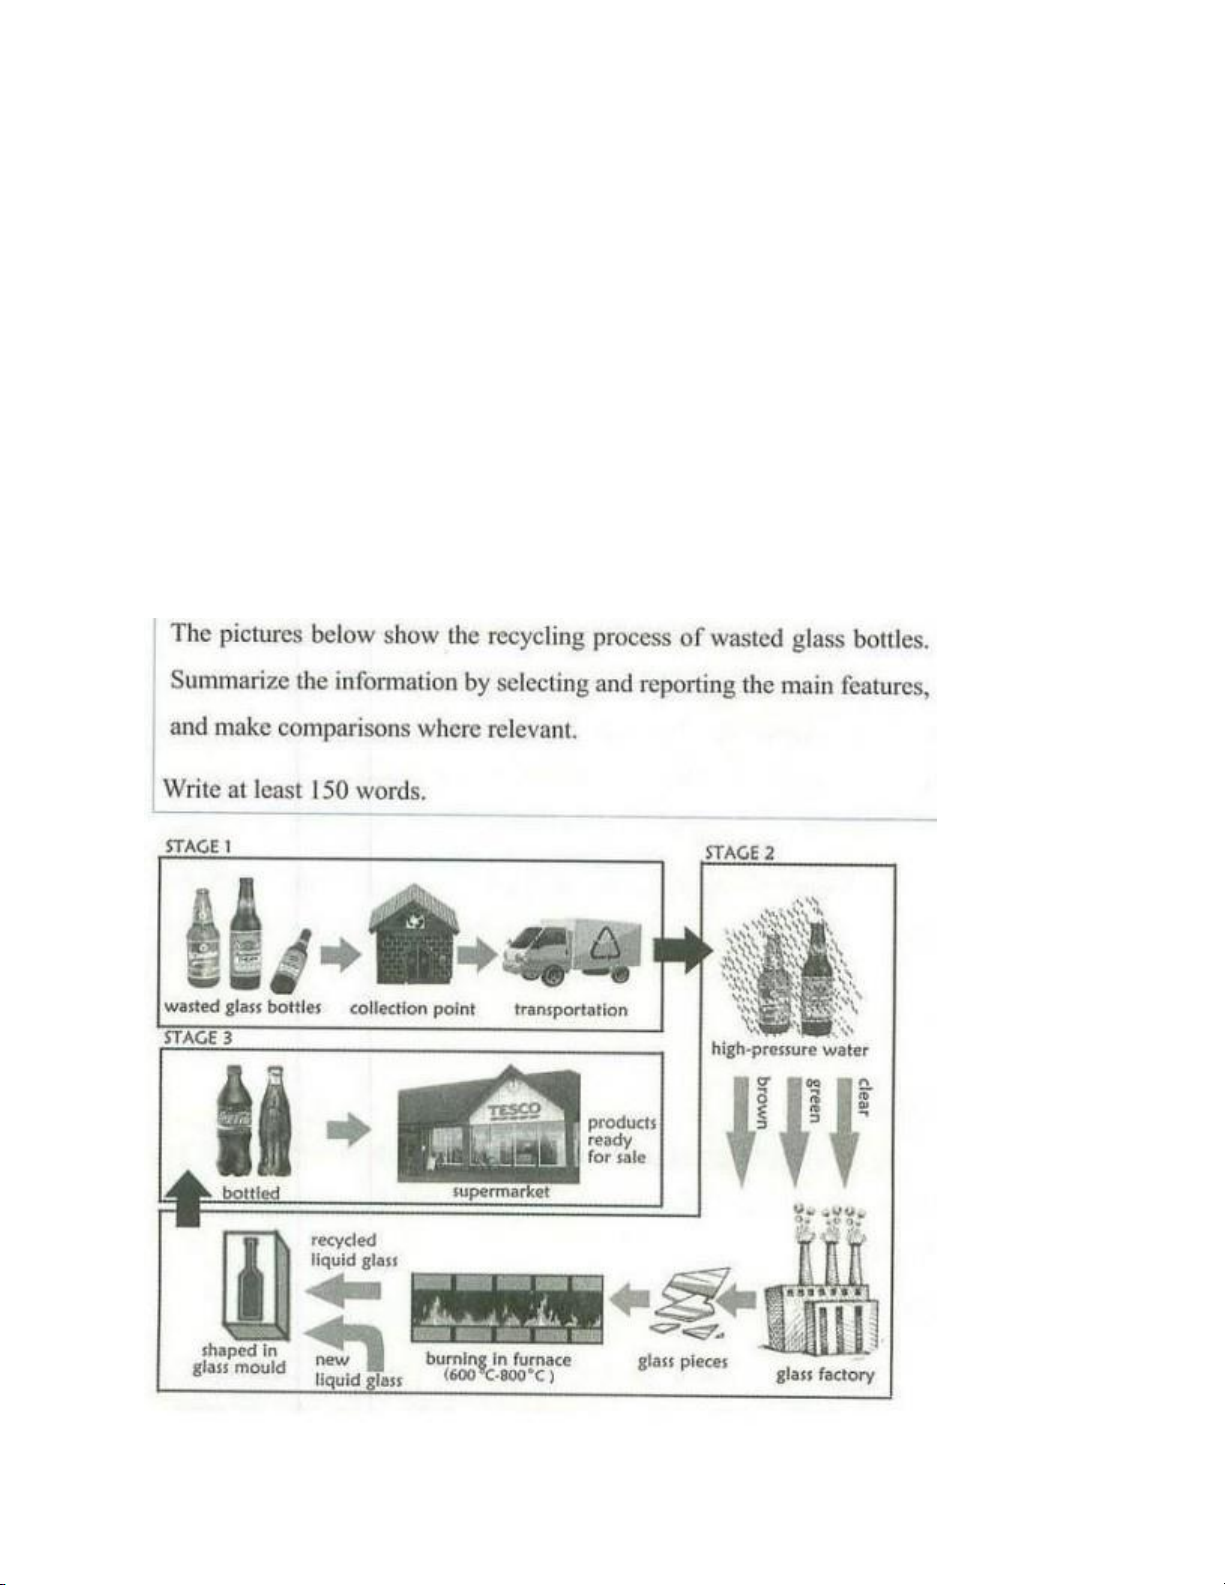
The diagram shows the main stages which take place in the process of
recycling wasted glass bottles.
Overall, it can be seen that there are three main stages of how waste
glass bottles were recycled, from the initial collection of waste bottles to
the eventual production of usable bottles.
At the first stage, waste glass bottles are collected in collection point
where people throwed them away. These bottles are then trucked by a
lorry and afterwards delivered to the factory. At the following stage,
there is the cleaning process of bottles with high-pressure water, and
seperated into a clear, green and brown glass. Next, this is broken into
tiny speices throughly a glass factory and once they are burned in a
furnance at a temperature from 600 degrees to 800 degrees.
Subsequently, having been shaped in glass mould, the recycled glass is
transformed into liquid form and associated with new liquid glass, mixing together.
In the final stage, the new recycled glass bottled are used for different
goods, ready for sales in the supermarket or retailer. 1. 10/2/2018
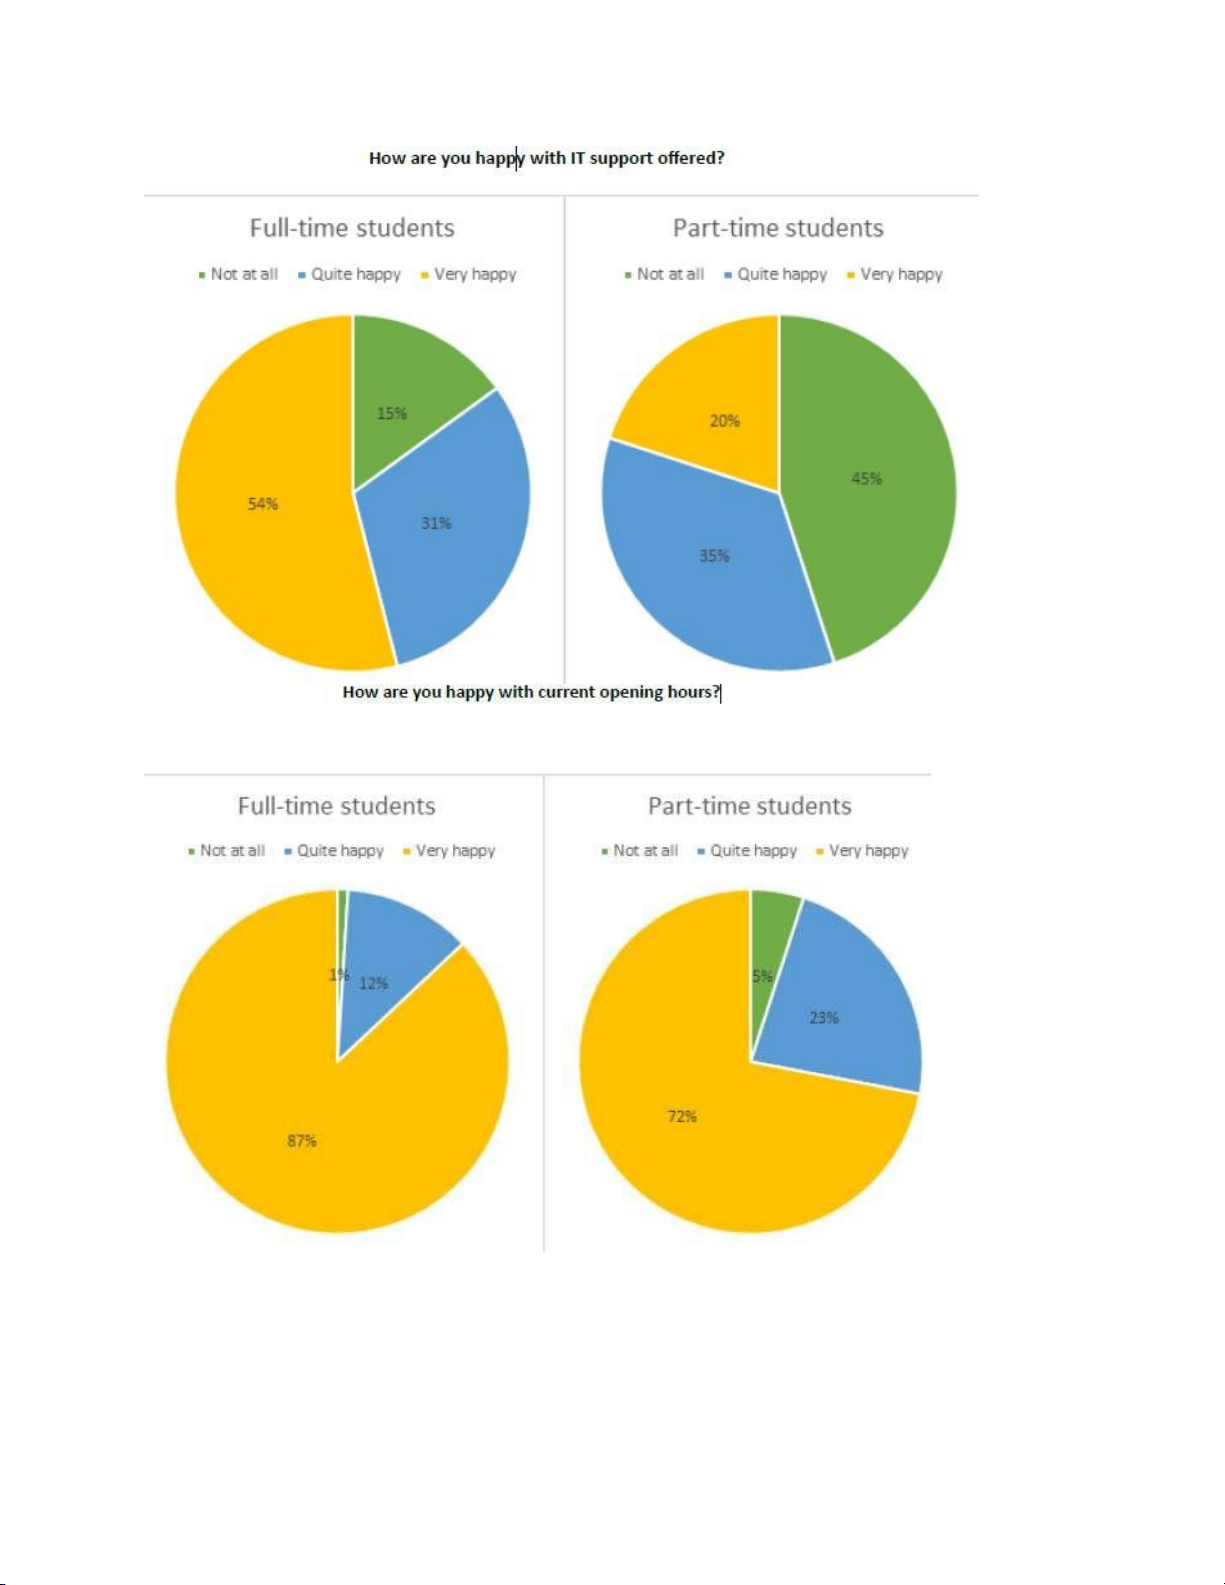
The pie charts show the results of a survey conducted by a university on the opinions of
full-time and part-time students about its services. lOMoAR cPSD| 30964149
The pie charts compare the satisfactions of both full-time and part- time students about services
of their university concerning IT support and opening hours. lOMoAR cPSD| 30964149
Overall, as can be seen from the charts is that there were a greater number of positive feedbacks
of opening hours than IT supports. In addition, 30/9/2017
The best way to reduce youth crimes is to educate their parents with
parental skills. To what extent you agree or disagree?
Many people widely believed that educating caregivers with upbringing
skills would act as an deterrent for declining youth offences. In my
opinion, society is equally resposible for this and hence teaching skills to
parent alone, are not likely to assist in improving this dire situation.
society can influence the youngsters to a great extent
Tài liệu liên quan:
-
Pathways LS 2 Audio Script: Lesson on Healthy Lives and Disease Prevention | Trường Đại học Ngoại ngữ, Đại học Đà Nẵng
116 58 -
Phonetics and Vocabulary Review for Course | Trường Đại học Ngoại ngữ, Đại học Đà Nẵng
90 45 -
Task 1 - Analyzing U.S. Government Research Spending Trends | Trường Đại học Ngoại ngữ, Đại học Đà Nẵng
93 47 -
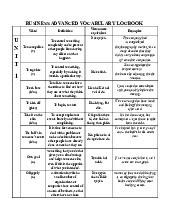
Advanced Business Vocabulary Logbook: Essential Terms and Definitions | Trường Đại học Ngoại ngữ, Đại học Đà Nẵng
98 49 -
English Vietnamese Translation Unit 1: Economics - Comprehensive Guide | Trường Đại học Ngoại ngữ, Đại học Đà Nẵng
107 54