


Preview text:
BRITISH MUSLIMS I N N U M B E R S
C E N S U S R E P O R T S U M M A R Y M A R C H 2 0 2 5
The MCB was an active member of the interfaith alliance that lobbied successfully for
the religion question in the Census, first appearing in 2001.
BRITISH MUSLIMS AND CENSUS FINDINGS
Since 2001, the 10-yearly census conducted in England & Wales, Scotland and Northern
Ireland has included a question on religious affiliation. It was the outcome of an
extensive interfaith campaign in which the MCB played a prominent role. The effort has
come to be fully justified, as demonstrated in this report, in providing the facts about
the nation’s plurality and diversity. There are now 20-years of data to inform public
policymaking and raise awareness within Muslim civil society of some social realities.
The religion question, though voluntary, has been consistently completed by 94% of the
population. There are 6 categories (Christian, Buddhist, Hindu, Jewish, Muslim, Sikh) and
also ‘No religion’ and ‘Any other religion’. The ethnicity question is based on 5 high level
groupings, each then further subdivided.
This is a summary of a more detailed report available on MCB’s website (www.mcb.org.
uk). Unless otherwise stated, it draws on the 2021 census data provided by the Office
of National Statistics for England & Wales and Northern Ireland Statistics & Research
Agency. In Scotland the census was conducted in 2022 with data published by the National Records for Scotland.
THE DATA FINDINGS AND KEY OBSERVATIONS Demographics
• Christians form the largest faith group
of childbearing age, immigration to
of the UK population (46.5%), followed
join family members already in the UK,
by ‘No religion’ (37.8%). Of the UK
international students, labour movement
population of 67 million, 4 million are
within EU prior to January 2021, work
Muslim (6%). The Church of England
permit based settlement from outside
is the official established faith of the
Europe and arrival of persons displaced
nation, with its rituals dominant in state
by conflict and climate change. The last
occasions, as seen in the Coronation of
of these will become a major factor in
King Charles III. There are also 6 million
Muslim lands in the decades to come.
Roman Catholics in the UK, who have a
• For the first time in census recording, the
history of struggle for rights and equal
majority of Muslims are UK born (50%),
treatment. Similarly, Muslims are in the
but this is higher in some cities, e.g.
process of reaching an accommodation
Bradford 65%, Walsall 61% and Oldham
and forming part of the mainstream. 59%.
• All the minority faiths are growing in
There is a shift in the makeup from first
population, but the fastest rate is for
generation immigrants to the born-and-
Muslims. There are more Muslims than bred Muslim Britons.
all the other minority faiths put together.
• Within the Muslim population, the Asian/
The Muslim population increased by
Asian British population form the largest
1.2 million between 2011 and 2021. This
ethnic group (2.6 million, 66%), but there
accounts for 32% of the overall growth
is representation in all the other ethnic
of the UK population in these ten years. categories as well.
Factors for the increase of the Muslim
Muslims are a kaleidoscope of
population between 2011 and 2021
communities, with an internal diversity
include the greater proportion of women
that is microcosm of British society as a 2
Muslim Council of Britain whole.
society is a ‘demographic dividend’:
• Excluding 234,000 Muslims in the White
meeting gaps in the labour market,
census ethnic category, 1 in 3 of the BME
contributing financially to the state population is Muslim.
welfare system, injecting a creative and
There is common cause combating all entrepreneurial spirit.
types of racism including Islamophobia.
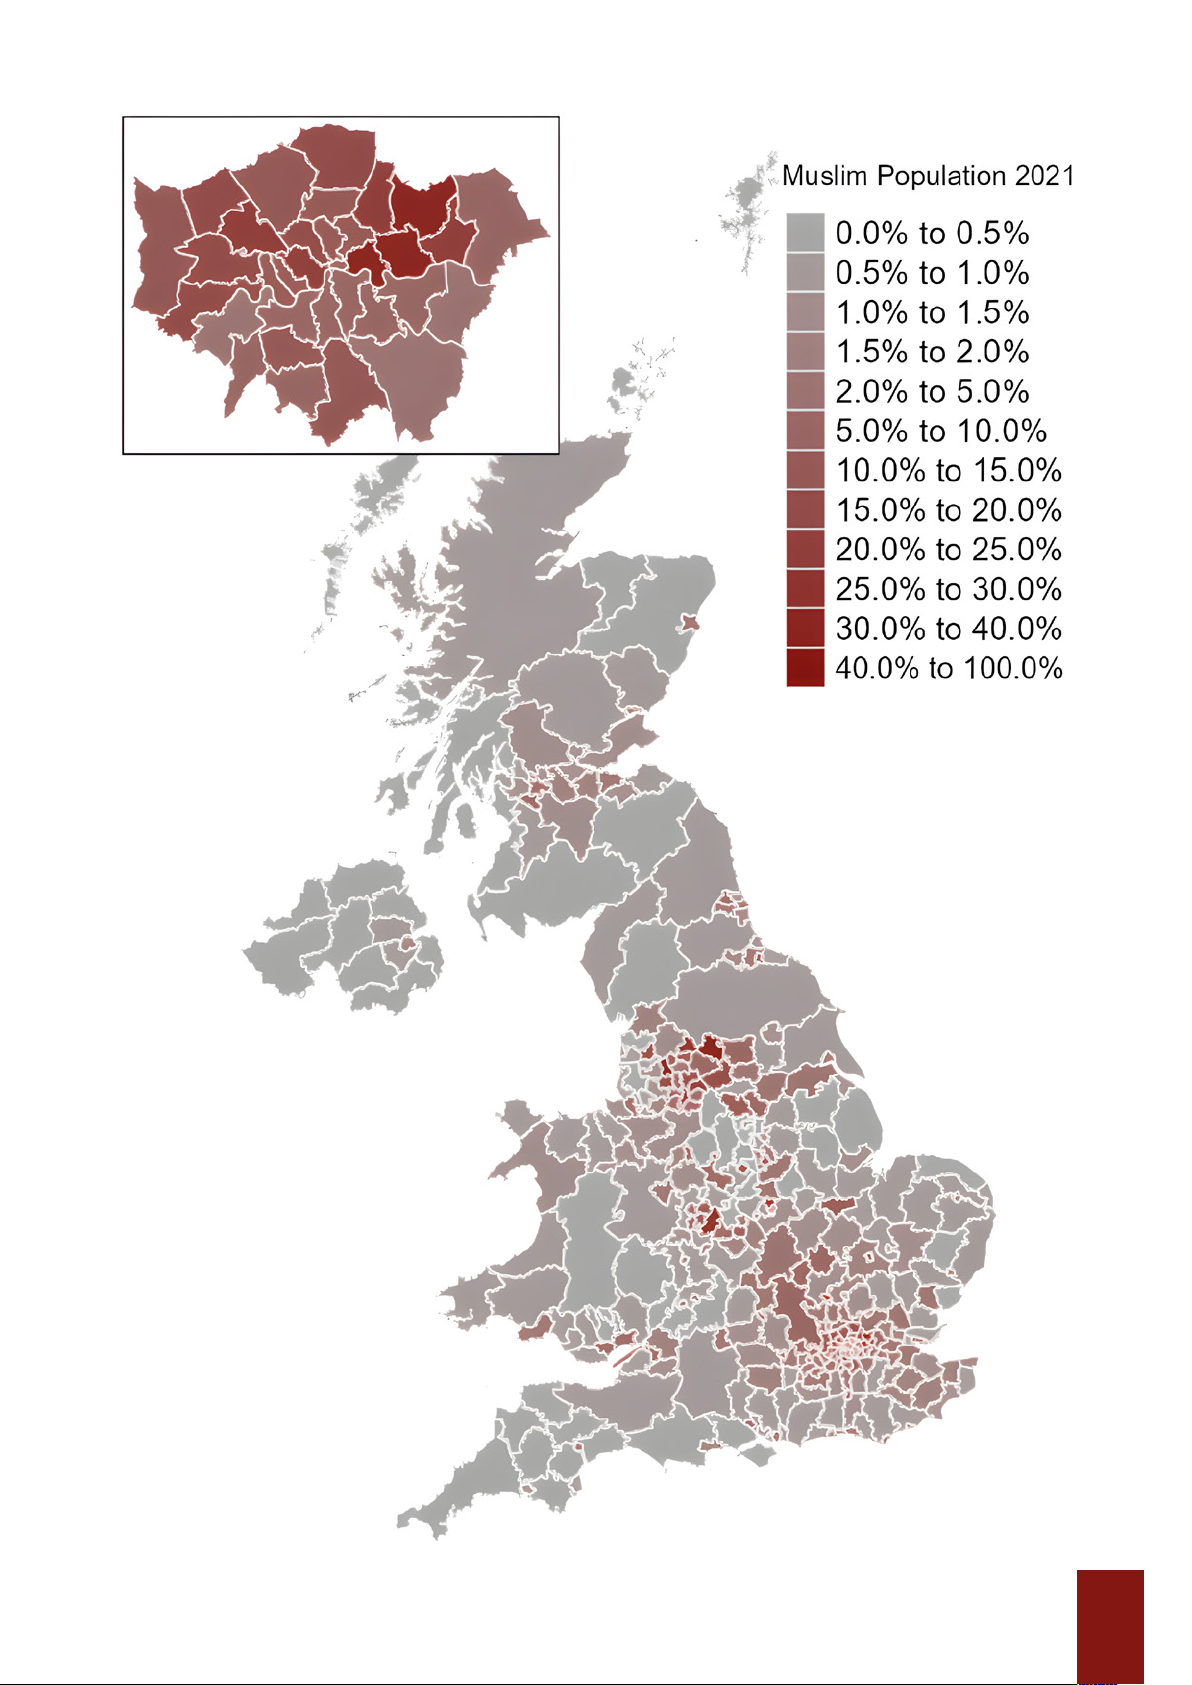
• Muslims are more geographically
• The Muslim population has a different
dispersed at the region and local
age profile compared to society overall –
authority level than many other faith
the median age of Muslims in the UK is 29 communities.
years, which is 15 years less than the rest.
The stereotype of self-segregating
Moreover, in 2021, 5% of Muslims were
communities needs to be challenged.
over 65 years of age, compared to 19%
The inner-city concentration is due to overall.
historical patterns related to low-cost
• 46% of the Muslim population is under the
housing and labour force needs of post-
age of 24 years compare to 29% overall. World War II Britain.
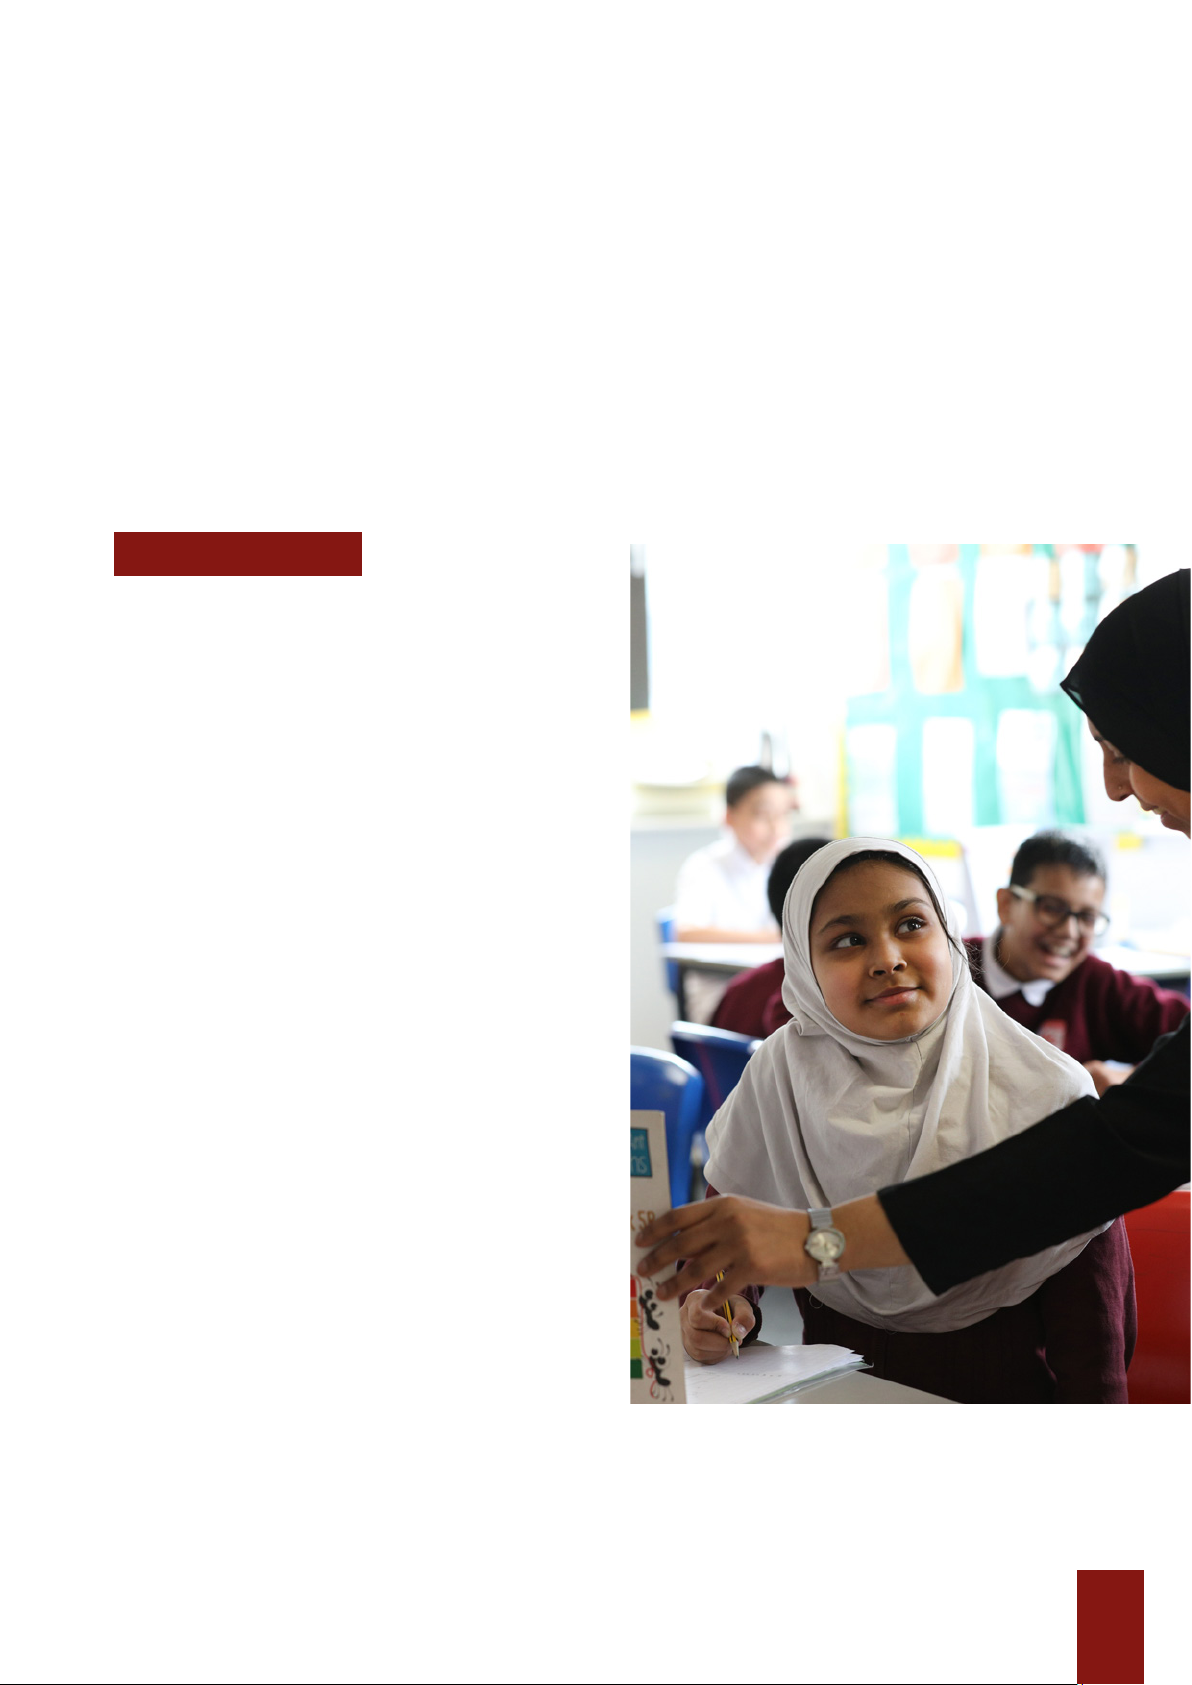
The younger population in an ageing Focus on Youth
• The proportion of Muslims under the age
of 15 years or younger is almost double
that of the overall population. While
Muslims form 6% of the population overall,
10% all school-age children (5 to 15 age band) are Muslim.
As a result of settlement patterns,
even though there is evidence of less
residential segregation at the local
authority district level, the percentage of
Muslim children of school age is very high
in some inner-city wards: in Birmingham,
there are 6 (out of 69) wards with over
85% Muslim schoolchildren in the 5-15 year old age band.
• In the MCB’s estimation by 2031 there
will be approximately 552,000 Muslim
teenagers – largely those currently in the
7 to 13 year age bands.
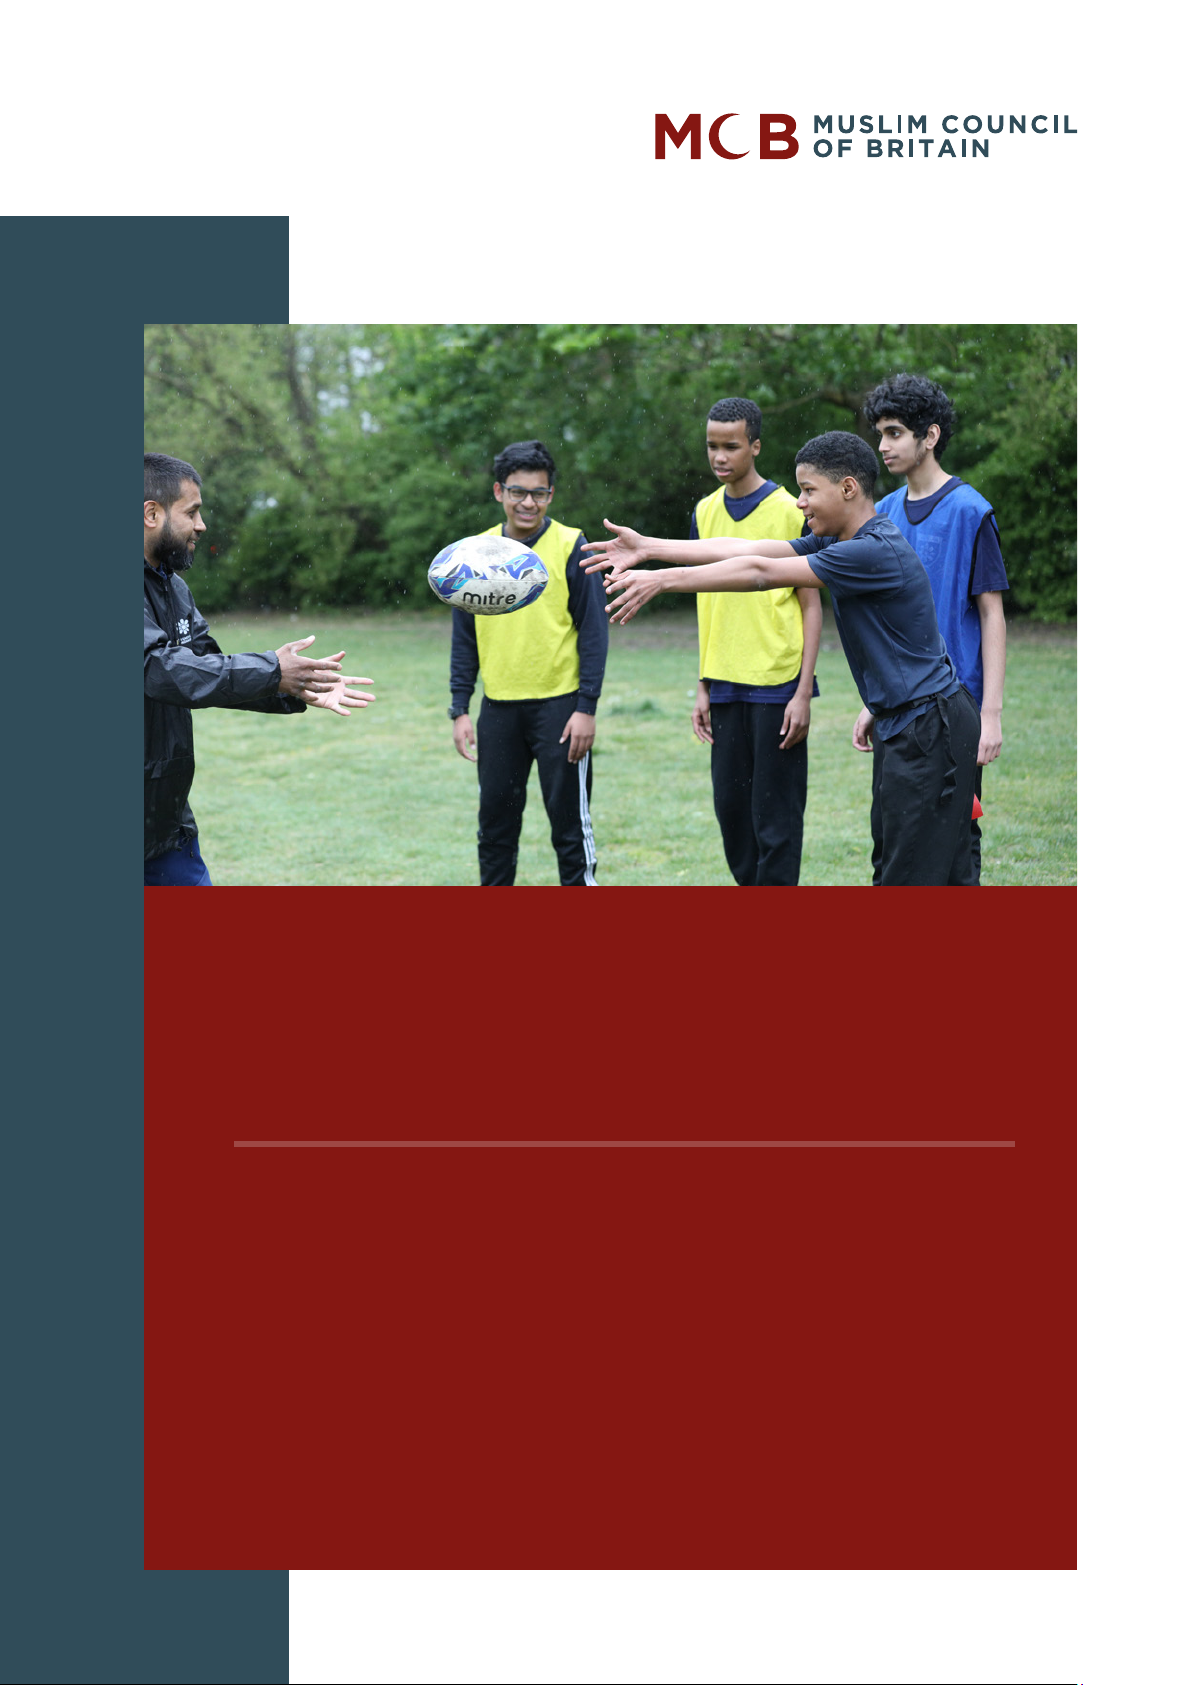
This is a wakeup call to both public
bodies and Muslim civil society. A Muslim
youth worker asked by the MCB on these
statistics responded, “The demographic
data means that young people will play
an important part in our cityscapes [. . .]
But it also means that we need to have
Muslim and non-Muslim organisations
developing services that signal inclusion
and belonging. It means that we need to
understand how Muslim youth work is like
all other youth work, like some other youth
work and like no other youth work.” 3
Census 2021 – Summary Report
Engagement in civic life
• British born Muslims in England and
norm for Muslims in Britain. Muslims have
Wales have a strong sense of British
significantly lower rates of cohabitation
identity (94%). Among non-UK born
compared to the general population. As
Muslims, for 55% their only national
noted elsewhere in this report, about a
identity is a UK one, which is a higher
quarter of Muslim women aged 16 years
proportion than in all other faiths.
and over, look after home and family.
• For 99% of British born Muslims in England
Marriage remains the foundation of
and Wales, English is their main language
family life and is a basis for social
or spoken well or very well.
stability and civic participation.
• In the UK, 2% of the Muslim population
cannot speak English. The lack of Voting
English Language proficiency is mainly
• There are 32 constituencies with
in the over 65 year old Muslim female
significant (20% or more) Muslim population.
population aged 18 years and above.
There is a generational shift taking place
There was an unprecedented level
from the first-generation immigrants to
of political engagement in the July
second, third (and more) generations
2024 General Election, with the Muslim
that are British born and bred.
Council of Britain leading a campaign
The lower English language proficiency in
for voter registration and increased
the older Muslim women population calls
voter awareness of the policy pledges
for targeted interventions, particularly
sought from prospective parliamentary
to ensure access to public services, now candidates.
increasingly on digital platforms.
• The traditional family structure, of
married couples with children, is the
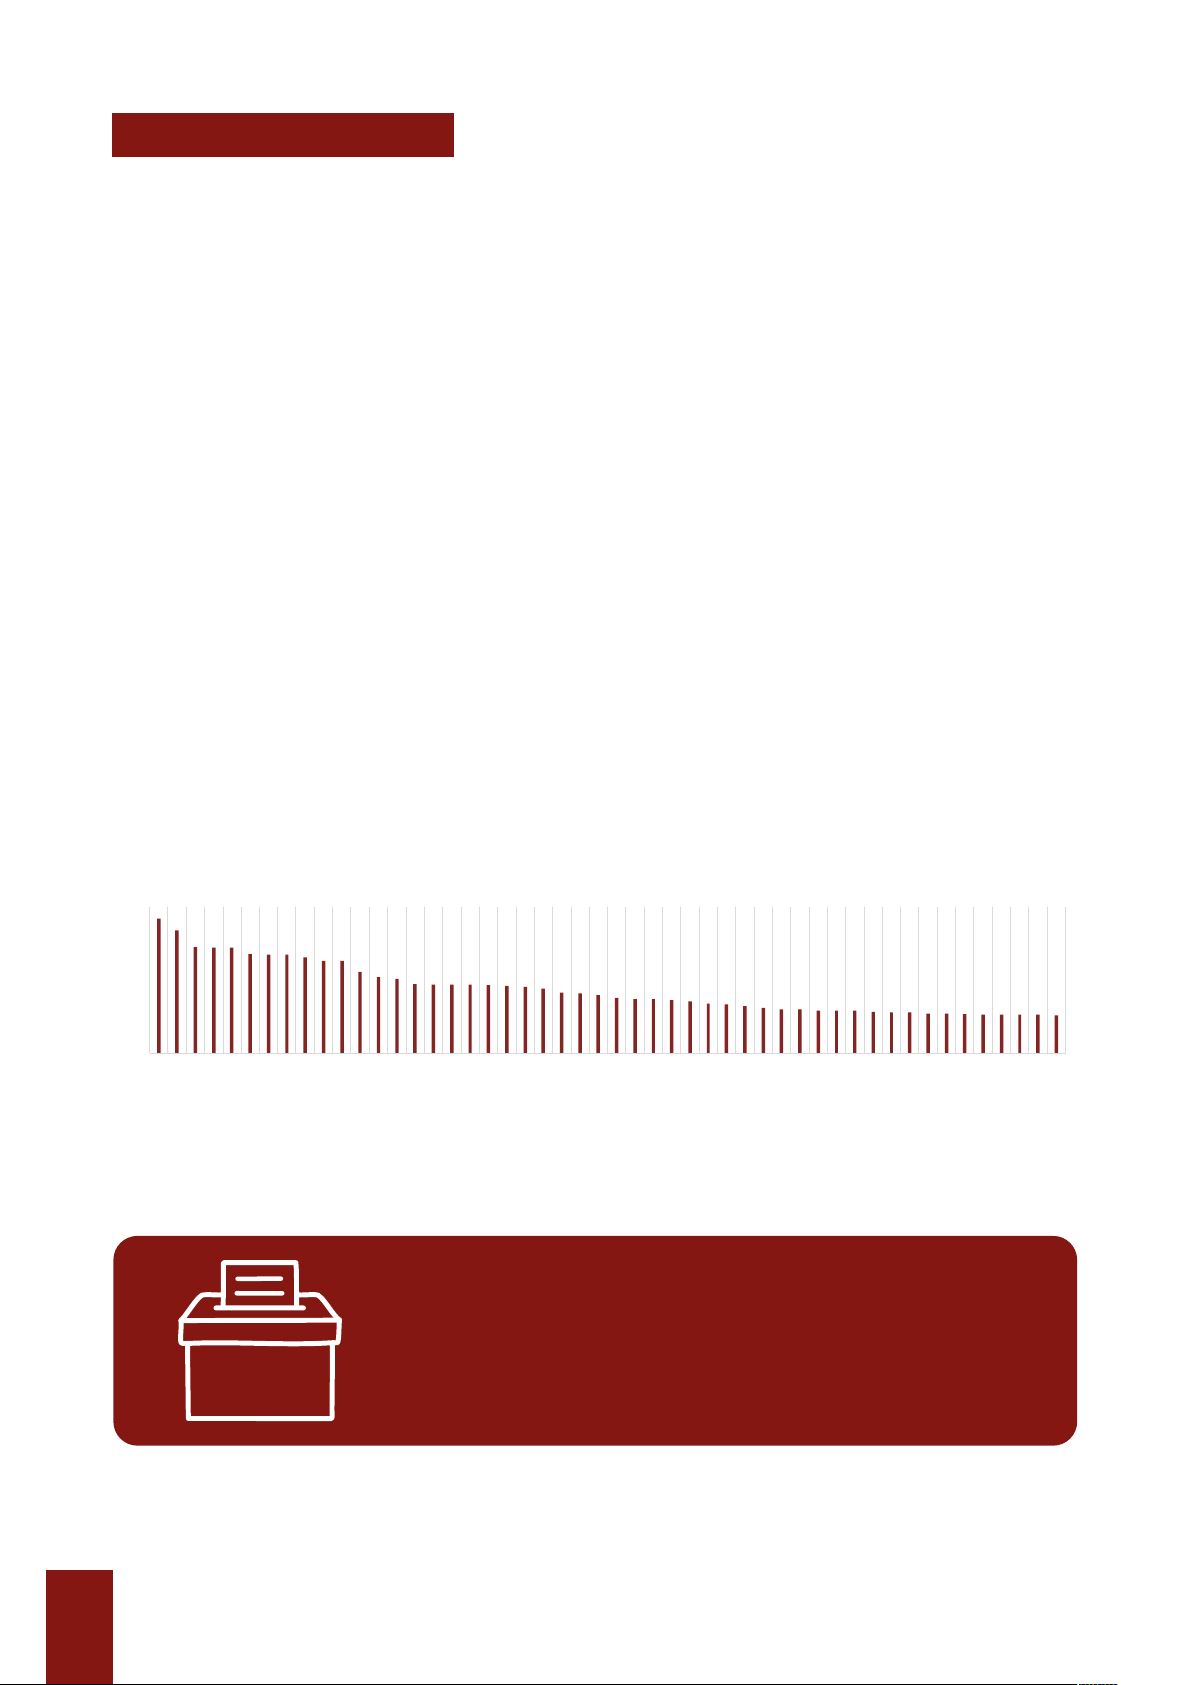
TOP 50 PARLIAMENTARY CONSTITUENCIES BY % OF MUSLIM AGED 18
YEARS AND ABOVE ON 4TH JULY 2024 55.0 50.3 43.4 43.2 43.1 40.6 40.3 40.3 39.2 37.8 37.8 33.3 31.3 30.6 28.3 28.3 28.1 28.0 28.0 27.6 27.1 26.4 24.8 24.5 23.8 22.8 22.3 22.2 21.9 21.3 20.4 20.1 19.4 18.7 18.0 17.9 17.5 17.5 17.4 17.1 16.9 16.7 16.3 16.3 16.1 15.9 15.9 15.9 15.9 15.6 … … … … … … … … … … … D D D ORTH ORTH AN ORTH ORTH D BOW STEAD SLOUGH EAST HAM D BATLEY BARKING TON G N PRESTONBURNLEYWYCOMBE BLACKBURN ROCHDALE BRENT EAST D BECKTON D BLOXWICH G SOUTHALL SMETHWICK FIELD N BRENT WEST ILFORD SOUTH D WAN DERBY SOUTH OLDHAM WEST, LUTON N ILFORD N HUDDERSFIELD EALIN EN HARROW WEST BRADFORD WEST BRADFORD EAST LEICESTER EAST WALTHAMSTOW EDMON BIRMINGHAM HALL LEICESTER SOUTH HOLBORN AND ST LUTON SOUTH AN QUEEN'S PARK AND OLDHAM EAST ANBRADFORD SOUTH EALIN BETHNAL GREEN AND BOLTON SOUTH AND STRATFORD AN GORTON AND DENTON FELTHAM AND HESTON DEWSBURY AN BIRMINGHAM YARDLEY SHEFFIELD BRIGHTSIDE BIRMINGHAM LADYWOOD POPLAR AND LIMEHOUSE LEYTON AN
BIRMINGHAM PERRY BARRBIRMINGHAM HODGE HILL MANCHESTER RUSHOLME WEST HAM AN WALSALL AN HAYES AND HARLINGTON
Estimated Muslim voters in the UK, 2,825,880 (July 2024) 4
Muslim Council of Britain London Source: Office for National Statistics licensed under the Open Government Licence v.3.0 Contains OS data © Crown copyright and database right 2024 Analysis © Muslim Council of Britain 2025 5
Census 2021 – Summary Report MUSLIMS IN THE UK 94% 99% 4 Million of British Born of British Born Muslims in 6% Muslims in England 2021 England & Wales OF OVERALL & Wales have Indicate English as their 2.8 Million UK National POPULATION main language or spoken well or very 2011 Identity well 1.6 Million 67m 2001 total UK population Education Approx 449,200 50% 33% Muslims in full-time of Muslims of Muslims have degree and above education full-time qualifications 2.2% 6.7% 2.2% 0.6% students are Scotland England Wales Northern (Age 16 and above) Ireland female
Asian/Asian British (2,630,257) Approx Health 29.9%
Black/African/Caribbean/Black British (429,142) 1,791,000 85.4% of Muslim women aged White (234,008) Muslims Residing in of Muslims in UK
65+ years are in ‘Bad’ Arab (296,632) Married Households express good health
or ‘Very Bad’ health Ethnically diverse with Dependent (compared to 81.7% Children (compared to 13%
Any Other Ethnic Group (261,628) overall) overall)
(45% of Muslims compared to 24% overall)
Mixed/Multiple Ethnic Group (147,205) Housing Social Realities 27% Occupy Social in England in England 18% of the Prison Housing Population is Muslim*
(including those adopting faith in prison
(Compared to 17% of overall
and both British & non-British nationals) population) *Ministry of Justice Data Over 379,500 Muslims
residing in lone parent 28% Privately Rent
families with dependent children
(Compared to 20% of overall
(10% of Muslim population compared population) to 8% overall) Over 180,000 46% Own Their one person Property households
(5% of Muslim population compared to
(Compared to 63% of overall 13% overall) population)
British Muslims in Numbers:
A Demographic, Socio-economic and Health Profile of Muslim in
United Kingdom drawing on the Census MUSLIMS IN THE UK 94% 99% 4 Million of British Born of British Born Muslims in 6% Muslims in England 2021 England & Wales OF OVERALL & Wales have Indicate English as their 2.8 Million UK National POPULATION main language or spoken well or very 2011 Identity well 1.6 Million 67m 2001 total UK population Education Approx 449,200 50% 33% Muslims in full-time of Muslims of Muslims have degree and above education full-time qualifications 2.2% 6.7% 2.2% 0.6% students are Scotland England Wales Northern (Age 16 and above) Ireland female
Asian/Asian British (2,630,257) Approx Health 29.9%
Black/African/Caribbean/Black British (429,142) 1,791,000 85.4% of Muslim women aged White (234,008) Muslims Residing in of Muslims in UK
65+ years are in ‘Bad’ Arab (296,632) Married Households express good health
or ‘Very Bad’ health Ethnically diverse with Dependent (compared to 81.7% Children (compared to 13%
Any Other Ethnic Group (261,628) overall) overall)
(45% of Muslims compared to 24% overall)
Mixed/Multiple Ethnic Group (147,205) Housing Social Realities 27% Occupy Social in England in England 18% of the Prison Housing Population is Muslim*
(including those adopting faith in prison
(Compared to 17% of overall
and both British & non-British nationals) population) *Ministry of Justice Data Over 379,500 Muslims
residing in lone parent 28% Privately Rent
families with dependent children
(Compared to 20% of overall
(10% of Muslim population compared population) to 8% overall) Over 180,000 46% Own Their one person Property households
(5% of Muslim population compared to
(Compared to 63% of overall 13% overall) population)
British Muslims in Numbers:
A Demographic, Socio-economic and Health Profile of Muslim in
United Kingdom drawing on the Census
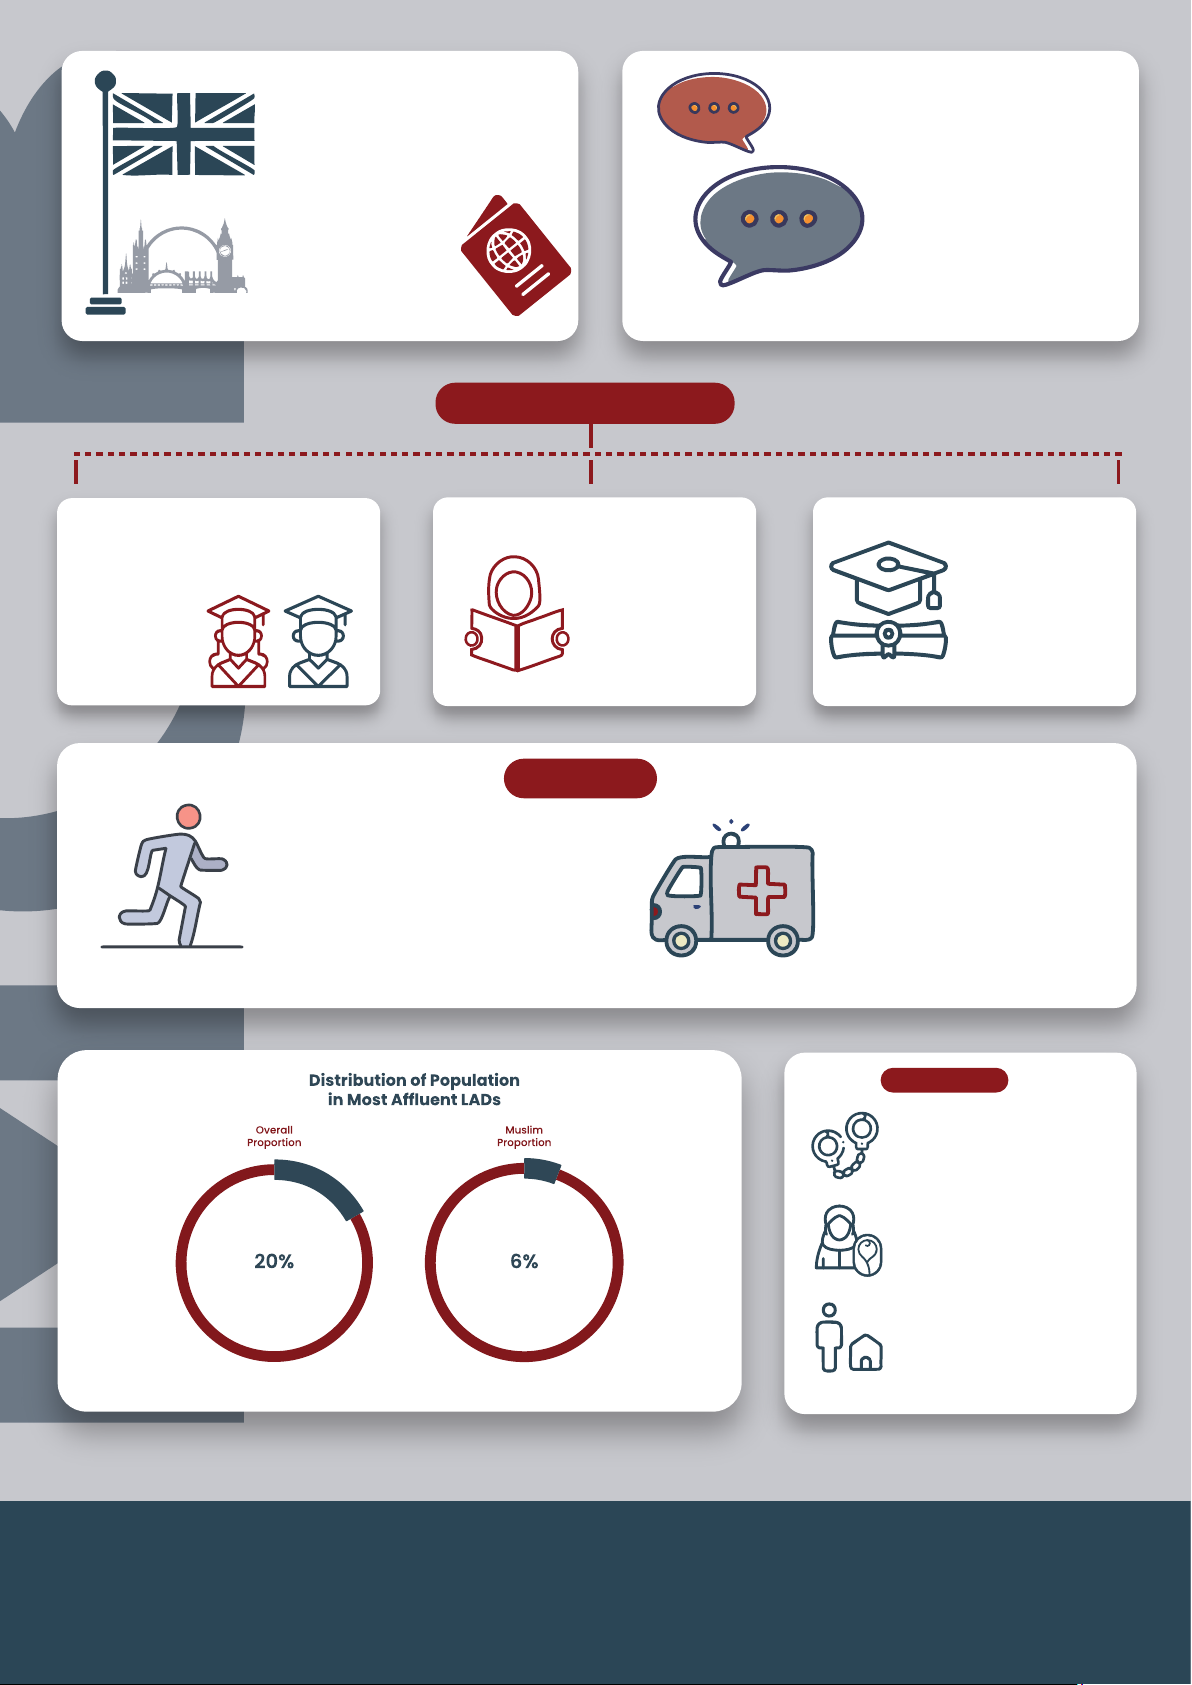
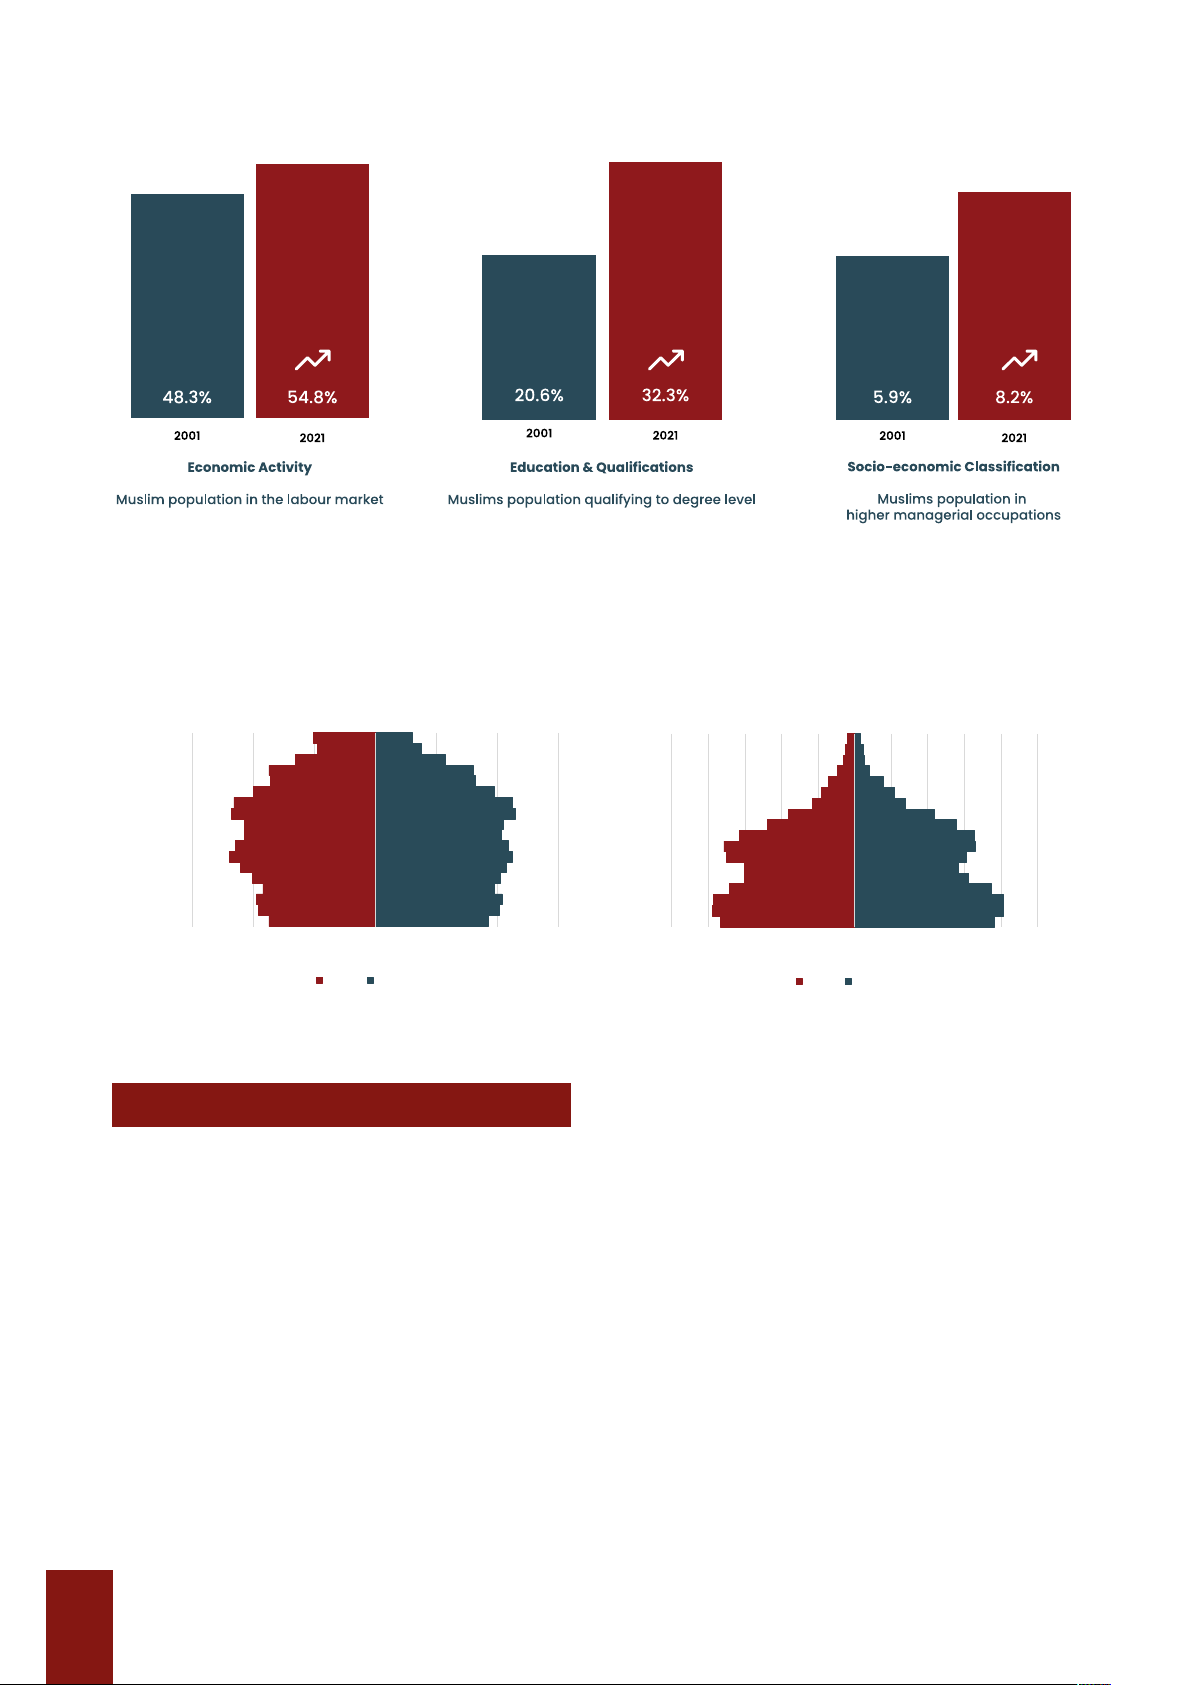
Trends in Social Mobility For England and Wales
(aged 16 years and above)
Overall Age Profile Compared with Muslim Population Age Profile UK Overall UK Muslim Population Pyramid Population Pyramid census 2021* census 2021* 85+ 85+ 80 - 84 80 - 84 75 - 79 75 - 79 70 - 74 70 - 74 65 - 69 65 - 69 60 - 64 60 - 64 55 - 59 55 - 59 50 - 54 50 - 54 45 - 49 45 - 49 Age 40 - 44 Age 40 - 44 35 - 39 35 - 39 30 - 34 30 - 34 25 - 29 25 - 29 20 - 24 20 - 24 15 - 19 15 - 19 10 - 14 10 - 14 5 - 9 5 - 9 0 - 4 0 - 4 -3000000 -2000000 -1000000 0 1000000 2000000 3000000
-250000-200000-150000-100000 -50000 0
50000 100000 150000 200000 250000 Count Count Female Male Female Male Median Age: 44 Years Median Age: 29 Years
*2022 census for Scotland
*2022 census for Scotland
The green shoots of social mobility Economic Activity
respectively) is higher than the rest of the
• Between 2011 and 2021 there has been a
population (10.9% and 2.3 % respectively).
rise in the proportion of Muslim women
This is more than some other minority
entering the labour market from 39.0% to
faiths, for example the Sikh and Hindu
42.3% in England and Wales. However, it population.
remains lower than the national average
The entry of Muslim women in the
(42.3% compared to 56.2%) in 2021.
labour force can be facilitated through
• 27% of Muslim women in UK aged 16
supportive workplace policies and
years and over are categorised as
practices. Childcare support in recent
‘economically inactive‘ in census
years has been curtailed, affecting
statistics, because “looking after home
families in poorer neighbourhoods to a and family”. greater extent.
• The proportion of Muslim men who are
A quirk in official statistics is to consider
self-employed, either as sole traders
women looking after home or family as
or with employees (13.0% and 3.9%
economically inactive. They may not be 8
Muslim Council of Britain
seeking entry into the labour market, but
Mobility Commission warns, “[...] better
they are anything but “inactive”.
educational outcomes don’t always yield
The entrepreneurial spirit contributes
better occupational outcomes”. There is a
to the nation’s economic growth and
responsibility here for Muslim civil society
though, ‘gig jobs’ offers flexibility, there
to provide mentoring over university
are fewer employment protection rights.
and career choices, and also increase
awareness of the apprenticeship route.
Education & Qualifications
The increased level of education is
• In the 16- 24 year old age band, a positive
related to Muslim women’s career
sign in the 20-year trend is the increase
expectations and aspirations. The
in those attaining Level 4/degree level
impact extends beyond entry into the
from 11.3% to 20.8% accompanied
labour market, from family dynamics to
with a reduction in Muslims with ‘No leadership roles.
Qualifications’ from 21.8% to 11.7%.
• The proportion of Muslim women who are
Socio-economic classification
full-time students has increased from
• The trends in England and Wales indicate 43% to 50% in 2021.
a modest increase in the proportion
• The take up of the apprenticeship
in the ‘upper echelon’ jobs, notably in
route for gaining on-the-job skills, that
the ‘Higher professional occupation’
can be combined with a degree level
category from 5.5% to 6.5% between 2011
qualification is low in younger age group
to 2021. However, the statistic of 6.5%
(aged 16 to 24) Muslims compared to
stands out compared to 17.8% and 16.7%
the national average. This is marked in
for the Hindu and Jewish faith groups
the population of Bangladesh ethnicity, respectively.
where the proportion is 3.4%, compared
This upward occupational mobility is
to say 6.5% in the Chinese population.
welcome but the lower proportion in
A degree level qualification is a
comparison to some other faith groups
pathway to higher income jobs and
points to a glass ceiling limiting upward
social mobility, though the 2023 ‘State promotion.
of the Nation’ report from the Social Persisting Inequalities
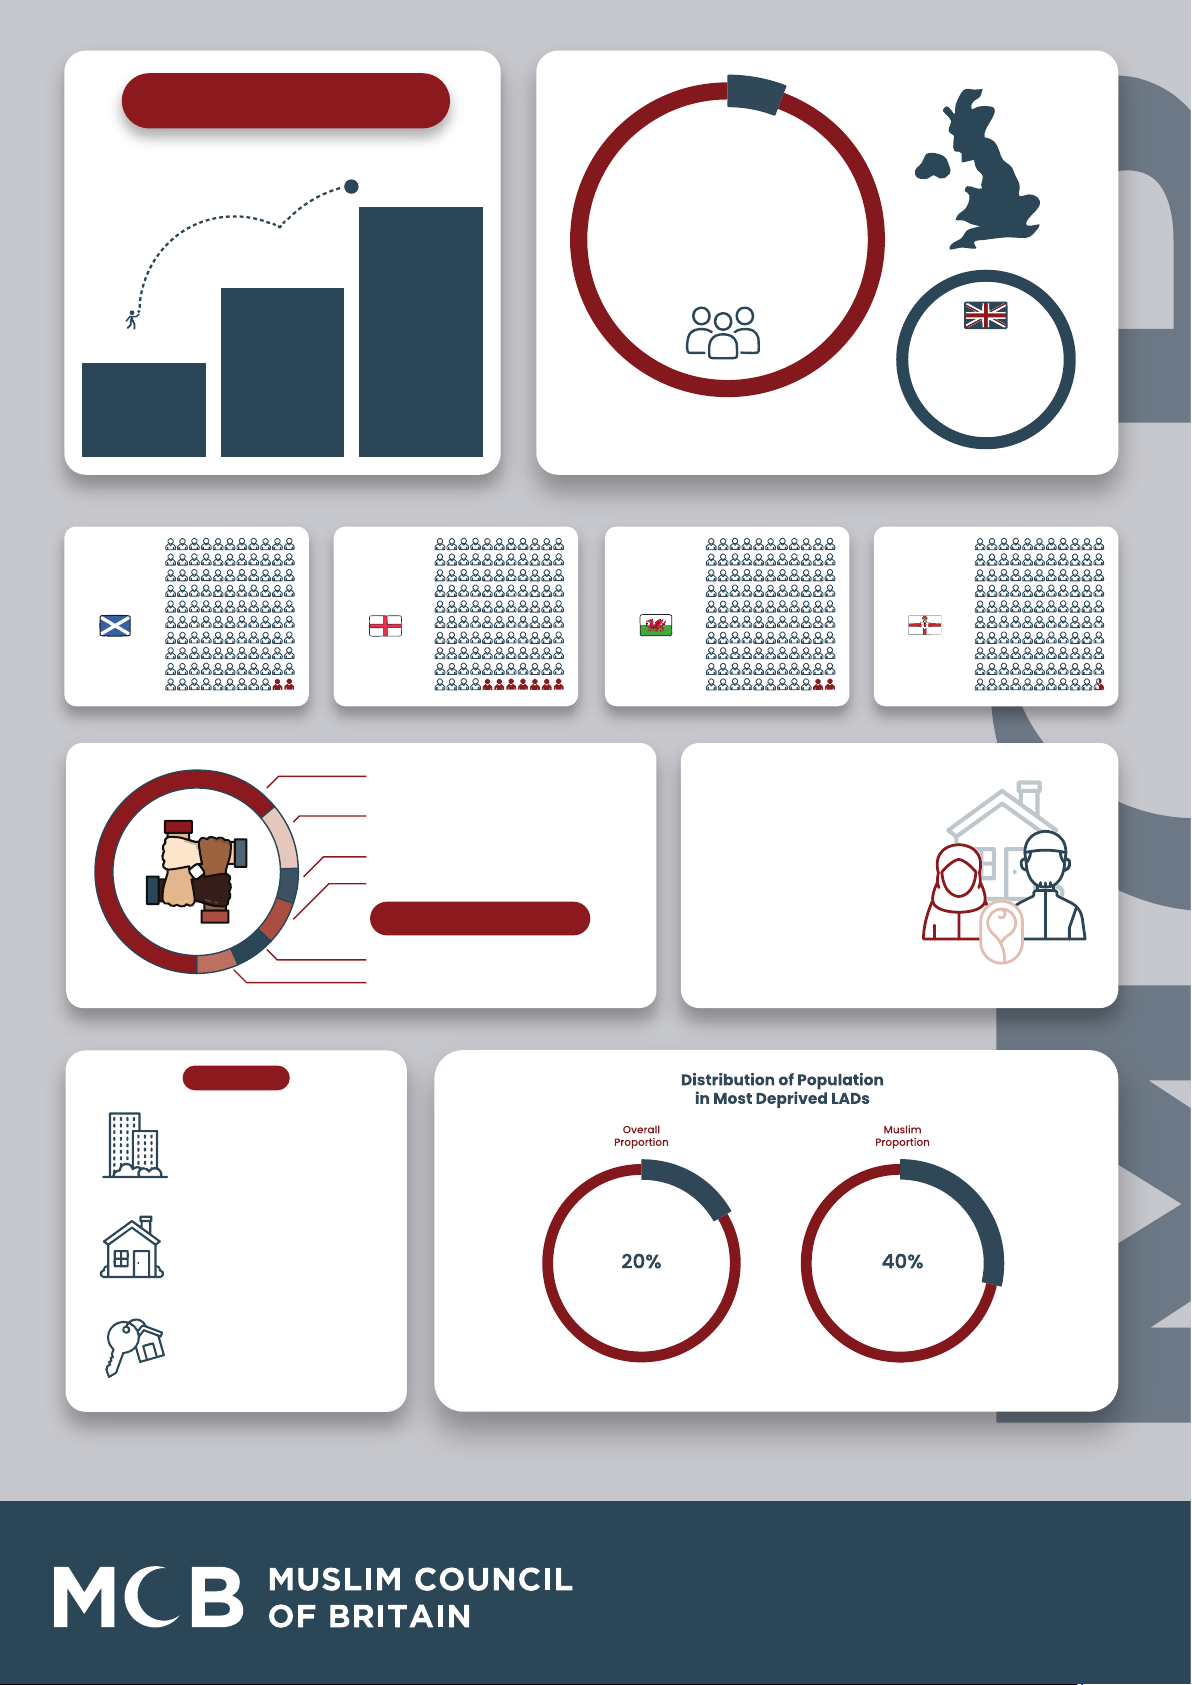
Deprivation & Poverty
raised in poor neighbourhoods. There are
• 40% of the Muslim population in
about 450,000 in these 14 local authority
England lived in the most deprived districts.
neighbourhoods in the country in 2001,
Poor neighbourhoods include people
2011 & 2021- no change over time in
of all faiths and ethnicities and recent
relative terms. It is a pattern that applies
academic studies shows that even in a
to the BME population particularly of
deprived neighbourhood, poor and well-
Pakistani ethnicity. 6% of the Muslim
off households are cheek-by-jowl. So
population lived in the most affluent
‘levelling up’ policies need to be targeted
neighbourhoods in the country in 2001,
to address the needs of low income 2011 & 2021. families.
• In absolute numbers there are now
The 2024 ‘State of the Nation’ report from
approximately 1 million more Muslims
the Social Mobility Commission is clear
living in the most deprived parts of
on the impact of poor neighbourhoods:
the country than in 2001. This trend is
“The percentage of children with a
even more dramatic if we look at most
good level of development is lowest for
deprived and most affluent 10% of
those who live in the 10% most deprived neighbourhoods.
neighbourhoods of England and rises
• The MCB has analysed the child
incrementally to being the highest for
population in local authorities that
those who live in the 10% least deprived
have a high Muslim population (20% neighbourhoods.”
or more) and are also among the
• The two-child benefit cap affects some
most deprived to assess the number
faith communities more than others:
of children (aged 15 years and under)
within the Muslim population in England 9
Census 2021 – Summary Report
and Wales, 37% reside in one family Health
households that have three or more
• The percentage of Muslim in UK dependent children.
expressing good health is greater
than the rest of the population – 85.4% Housing
compared to 81.7% because of the
• 1 in 4 Muslims households in England and
communities’ younger age profile.
Wales live in overcrowded residences
However, the pattern changes for older
compared to 1 in 15 of the overall
Muslims. Over 20 years, for England and
population. This is four times higher
Wales, women in the population as a
than the national average. Overcrowding
whole in the 65+ years age band, the
is most marked in social housing (e.g.
proportion in bad or very bad health
council rentals), which is the housing
has dropped from 24.8% in 2001 to 13.1%
tenure type for a significant proportion
in 2021; there has been a reduction for
of Muslim households (31% compared
Muslim women as well – from 42.8% to
to 20% for all households). Muslim
29.9%. However, this is still almost 1 in 3 of
households also reside in privately rented the Muslim population.
premises to a greater extent than the
• There are regional variations in the
national average (28% compared to 17%).
proportion of Muslim women over 65
• The housing crisis with a shortage of
years in bad or very bad health. For
affordable homes is well-acknowledged,
example, the lowest is in Croydon (23.0%
but this disproportionately affects
compared to the average of 29.9%) but
the Muslim population because of the
the highest is in Tower Hamlets (40.5%).
reduction in council housing stock and
The persistent health inequity faced by
new build schemes unsuitable for multi-
older Muslim women is an indictment of
generational or large households. This
local health policies. Further studies are
again calls for targeted interventions to
needed to better understand regional
ensure supply of new builds matches
variations and perhaps identify ‘good
demand. With regards to private rentals,
practice’ that can be replicated. This is
a housing expert consulted by the MCB
urgent because over the next decade
noted, “The impact of smaller landlords
there will be a gradual increase in the
removing their properties from the
older Muslim population. Contributory
private rented sector will impact non-
factors may include the social
White residents given higher levels of
determinants of health such as poverty
direct and hidden homelessness. But
and poor housing, but also racialisation
the bigger danger and impact would
as Muslim women, due to some being
be on children and families who are
visibly Muslim. Such racialisation leads to
displaced from relatively insecure and
poor health experiences due to conscious
costly private rented accommodation to
and unconscious biases. Access to
an insecure future and resigned to long
health services can also be dependent
periods of temporary accommodation.
on English language proficiency, which
This is a bleak indictment of a failing
is low for older Muslim women, as noted
housing market that has taken decades above.
in the making because as a nation
we continue not to invest enough
into affordable housing and have not
done enough to protect rents, ensure
maintenance and safety with robust
regulation to protect residents”. 10
Muslim Council of Britain
Issues for Muslim civil society
Single parent households Muslims in prison
• Within the England and Wales Muslim
• The census provides high-level
population, 9.7% reside in lone parent
population data on ‘communal
households with dependent children.
establishments’, which includes prisons.
However, it is lower in Scotland, 7.8% of
This MCB report has referred to Ministry
its Muslim population. This is a greater
of Justice prison returns for further
proportion than other faith communities
detail. These indicate that on 31 March
– for example it is 2.1% and 3.9% in Hindu
2021, the prison population in England
and Sikh households respectively. From
and Wales was 84,372, including about
the more detailed household composition
15,000 Muslims– 18%. This is higher than
question in Scotland’s census, the head
other minority faiths with the exception of
of these households is nine times more Buddhists.
likely to be a female rather than a male:
Muslim civil society needs to be alert to
8,200 and 900 respectively.
these three social realities. Where single
person households with dependent Loneliness
children are headed by a woman, the
• A recent report notes “The
onus will be on mosques to provide
unprecedented rise in loneliness in
female-staffed counselling and support
the UK is an epidemic” (from equi.org.
services. The issue of loneliness also
uk ‘Tackling Loneliness: Learning From
requires creative responses, such as
British Muslim Experiences’). The British
in the provision of culturally sensitive
Muslim population is not immune – there
elderly care homes sited near places of
are 4.6% single person households within
worship. The disproportionate number
Muslim communities in the UK, with many
of Muslims in prison urgently demands
aged 66 years and over.
a task force, pooling the community
workers’ experiences in preventative
measures and probationary support to reduce recidivism. NEXT STEPS
The work ahead is clear. There is a section of British society experiencing disadvantage,
but steps to improve its socio-economic and health profile will benefit society as a whole,
because the policy changes required are to do with geography – “a rising tide benefits all
boats”. Concrete actions are needed, as outlined above, to address crises in child poverty,
housing, health inequalities. Policy initiatives at the local authority level, and even lower levels
of geography, will have a positive impact on all residents, irrespective of faith. Muslims are not
seeking special favours but a recognition of disadvantage.
This report has highlighted the internal transformations taking place within Muslim communities
that will shape the future. An increasing proportion will be British born. There is a greater level of
entrepreneurship amongst Muslim men, and an increasing proportion of well-educated Muslim
women taking their place in the labour market, but the changes can come to naught if not
accompanied by steps to address ‘glass ceilings’ and Islamophobia at the institutional level
Muslim civil society is an important partner in moving towards a fairer Britain. Muslim
communities themselves have to address needs so much affected by decades-long ‘austerity’
policies, particularly in youth support, counselling and mentoring work. There is soul searching
required to address the causes of the high Muslim prison population and find solutions in faith-
based traditions such as good parenting. There will be a changing role of mosque chaplaincy
to address the needs of single parent families with dependent children headed by women.
The Muslim communities are young today, but soon its age profile will be the same as the
nation’s. There is need for innovative solutions to address the needs of the soon-to-come elderly
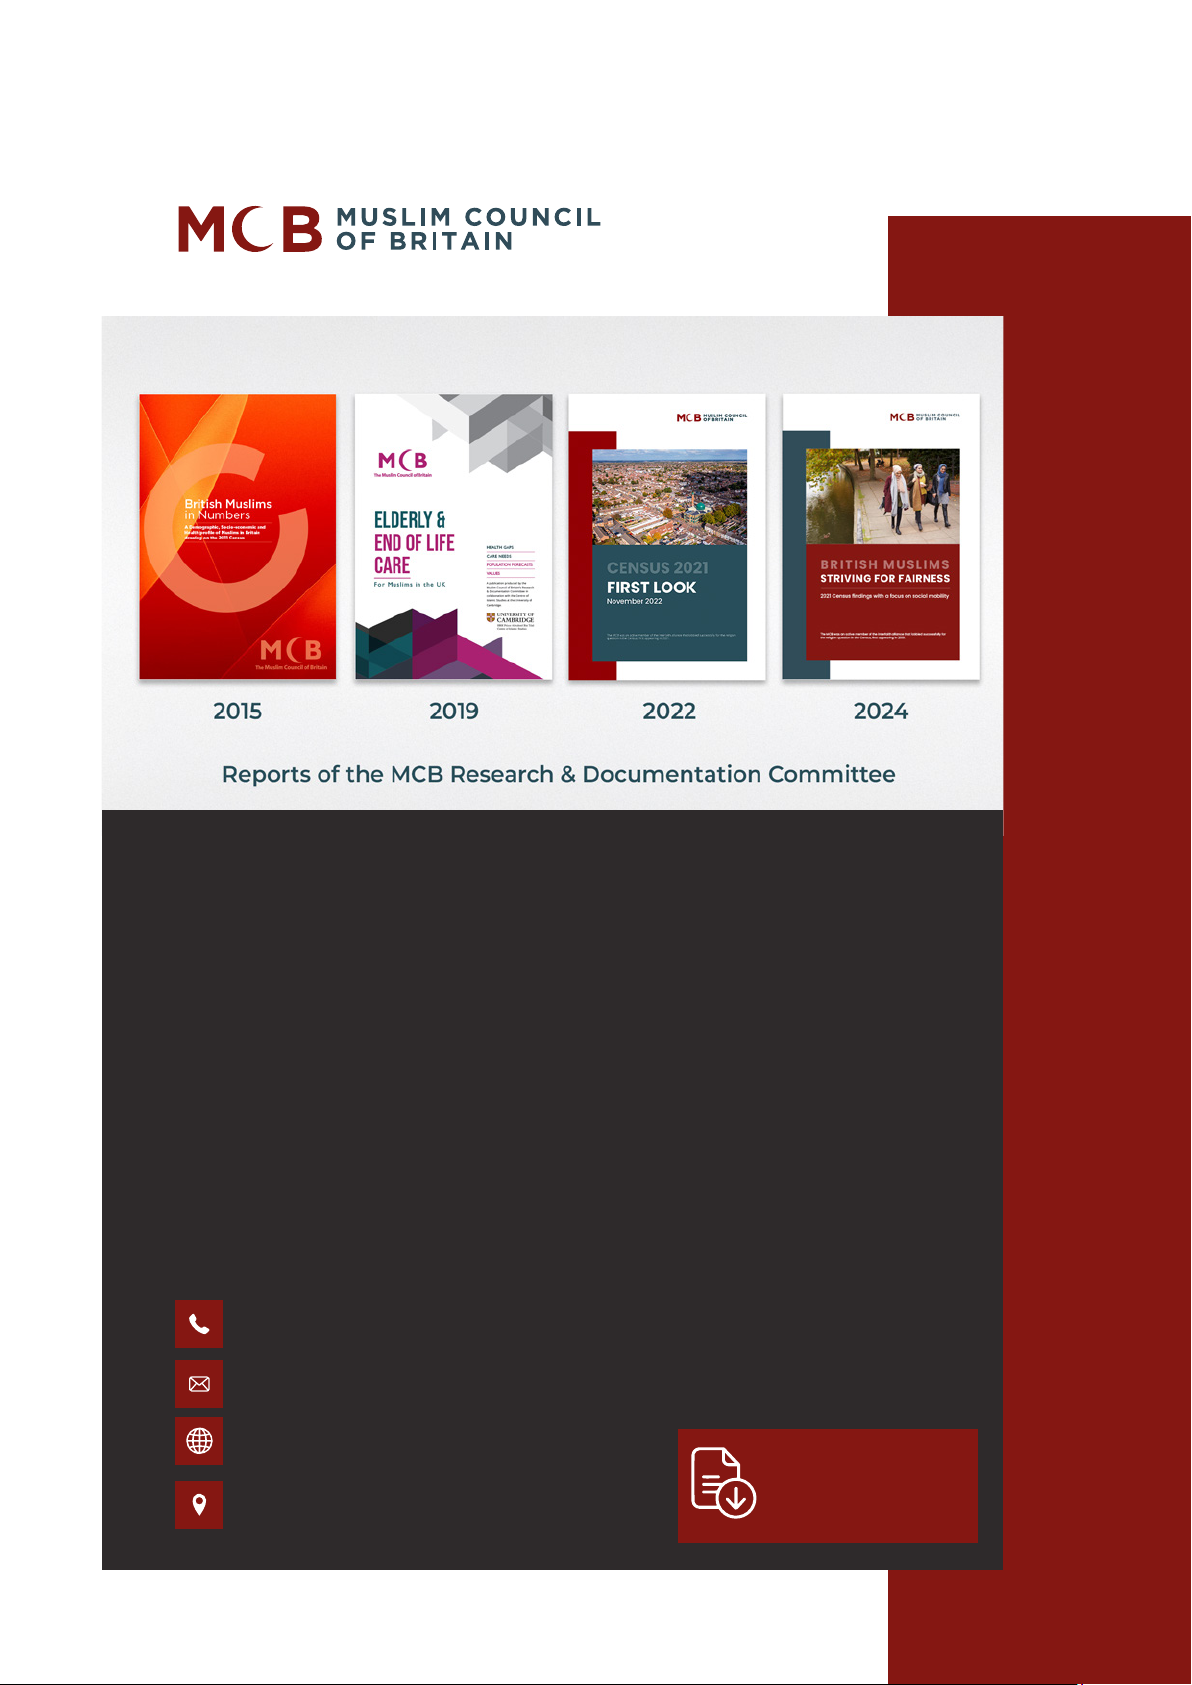
population, which have been identified in the MCB report Elderly & End of Life Care (2019).
This report shows that there is enough data for evidence-based policies; what is needed now
are champions to effect change. 11
Census 2021 – Summary Report
Publication Date: March 2025
Briefing prepared by the MCB’s Research & Documentation Census 2021 Project
Mebhoob Asaria, Guldastasho Alibakhshov, Dr Shahzad Amin,
Dr Miqdad Asaria, Mariam Hassam, Dr Shuja Shafi, Dr Jamil Sherif, Fatema Sunderji, Zainab Uddin, Hanna Wahab.
For permission to reproduce contact: admin@mcb.org.uk. Art Director: Salman Farsi
Graphic Design: Ikram Hussain, Hamza Ahmad. Photo Credits: Rehan Jamil Acknowledgements:
For financial support to the project: All Ways Network For data sources:
Office for National Statistics, Northern Ireland Statistics & Research Agency, National Records for Scotland. 0845 262 6786 admin@mcb.org.uk www.mcb.org.uk For the full report PO Box 57330, London, visit the MCB website E1 2WJ, UK
® Copyright 2025 – All rights reserved.