Final Exam: Digital Color Output and ISO Standards Compliance | Môn Công nghệ cảm biến - Đại học Sư phạm Kỹ thuật Thành phố Hồ Chí Minh
In a quest to empower students to better understand quality improvement techniques, this applied research examined the industry standard printing process and quality management practices, similar to those a student would encounter upon entering into the industry. Tài liệu được sưu tầm gồm 24 trang, giúp bạn ôn tập tốt hơn. Mời các bạn đón xem.
Môn: Công nghệ cảm biến 11 tài liệu
Trường: Trường Đại học Sư phạm Kỹ thuật Thành phố Hồ Chí Minh 4.4 K tài liệu
Tác giả:


Preview text:
lOMoAR cPSD| 58583460 ATMAE – lOMoAR cPSD| 58583460 OCT-DEC 2023
The Journal of Technology, Management, and Applied Engineering
Digital Color Output Conformity to
ISO12647-7 Standards (GRACoL 2013
[CGATS21-2-CRPC6]) With the Use
of Statistical Process Control (SPC) ABSTRACT
The purpose of this applied research was to apply the statistical process control (SPC) to determine the
digital color output conformity to ISO12647-7 standards in a color managed digital printing workflow
(CMDPW) over a period of 100 days (N = 100). The quality of digital color printing is determined by these
influential factors: screening method applied, type of printing process, calibration method, device profile,
ink (dry toner or liquid toner), printer resolution, and the substrate (paper). For this research, only the color
printing attribute overall average color deviation (ACD; ΔE(2000)) was analyzed to examine the CMDPW
process consistency in a day-to-day digital printing operation. Printed colors from the random sample size
(n = 80) were measured against the General Requirement for the Applications in the Commercial Offset
Lithography (GRACoL 2013) standards to derive the colorimetric/ densitometric values. Reference
colorimetric values used in the analysis were the threshold deviations (acceptable color deviations) as
outlined in the ISO12647-7 standards (GRACoL 2013). A control chart analysis was applied for further
determining the process (CMDPW) ACD variation. The data collected were run through multiple software
applications (Microsoft Excel/SPSS/Minitab) to apply various statistical methods. Analyzed data from the
experiment revealed that the printed colorimetric values were in match (aligned) with the GRACoL 2013
(reference/target) standards. Since the color values were in control throughout the process, this enabled the
CMDPW to produce consistent acceptable color deviation (average printed ΔE(2000) = 2.978). (The
acceptable threshold color deviation is ΔE(2000) ≤ 3.00.) Introduction
In a quest to empower students to better understand quality improvement techniques, this applied research
examined the industry standard printing process and quality management practices, similar to those a
student would encounter upon entering into the industry. Hence, for a student to consistently deliver a
quality print, managing and controlling color from the input device to a multicolor output device is a major
concern for the graphics and imaging educator.
Modern printing has evolved from a craft-oriented field toward a color management science. This is
demanding a greater color control among the display, input/color capturing, and output devices (printing
and non-printing) and the substrates used in the printing and imaging industry. The quality of color image
reproduction of any type of printing (digital or traditional) is largely influenced by the properties of
substrate/paper (Wales, 2009). A modern and up-to-date commercial printing workflow requires a color
management system (CMS) to produce a quality color printing. A CMS enables the color producer (printer
operator or the designer) to deliver accurate output colors regardless of device color capacities with the use
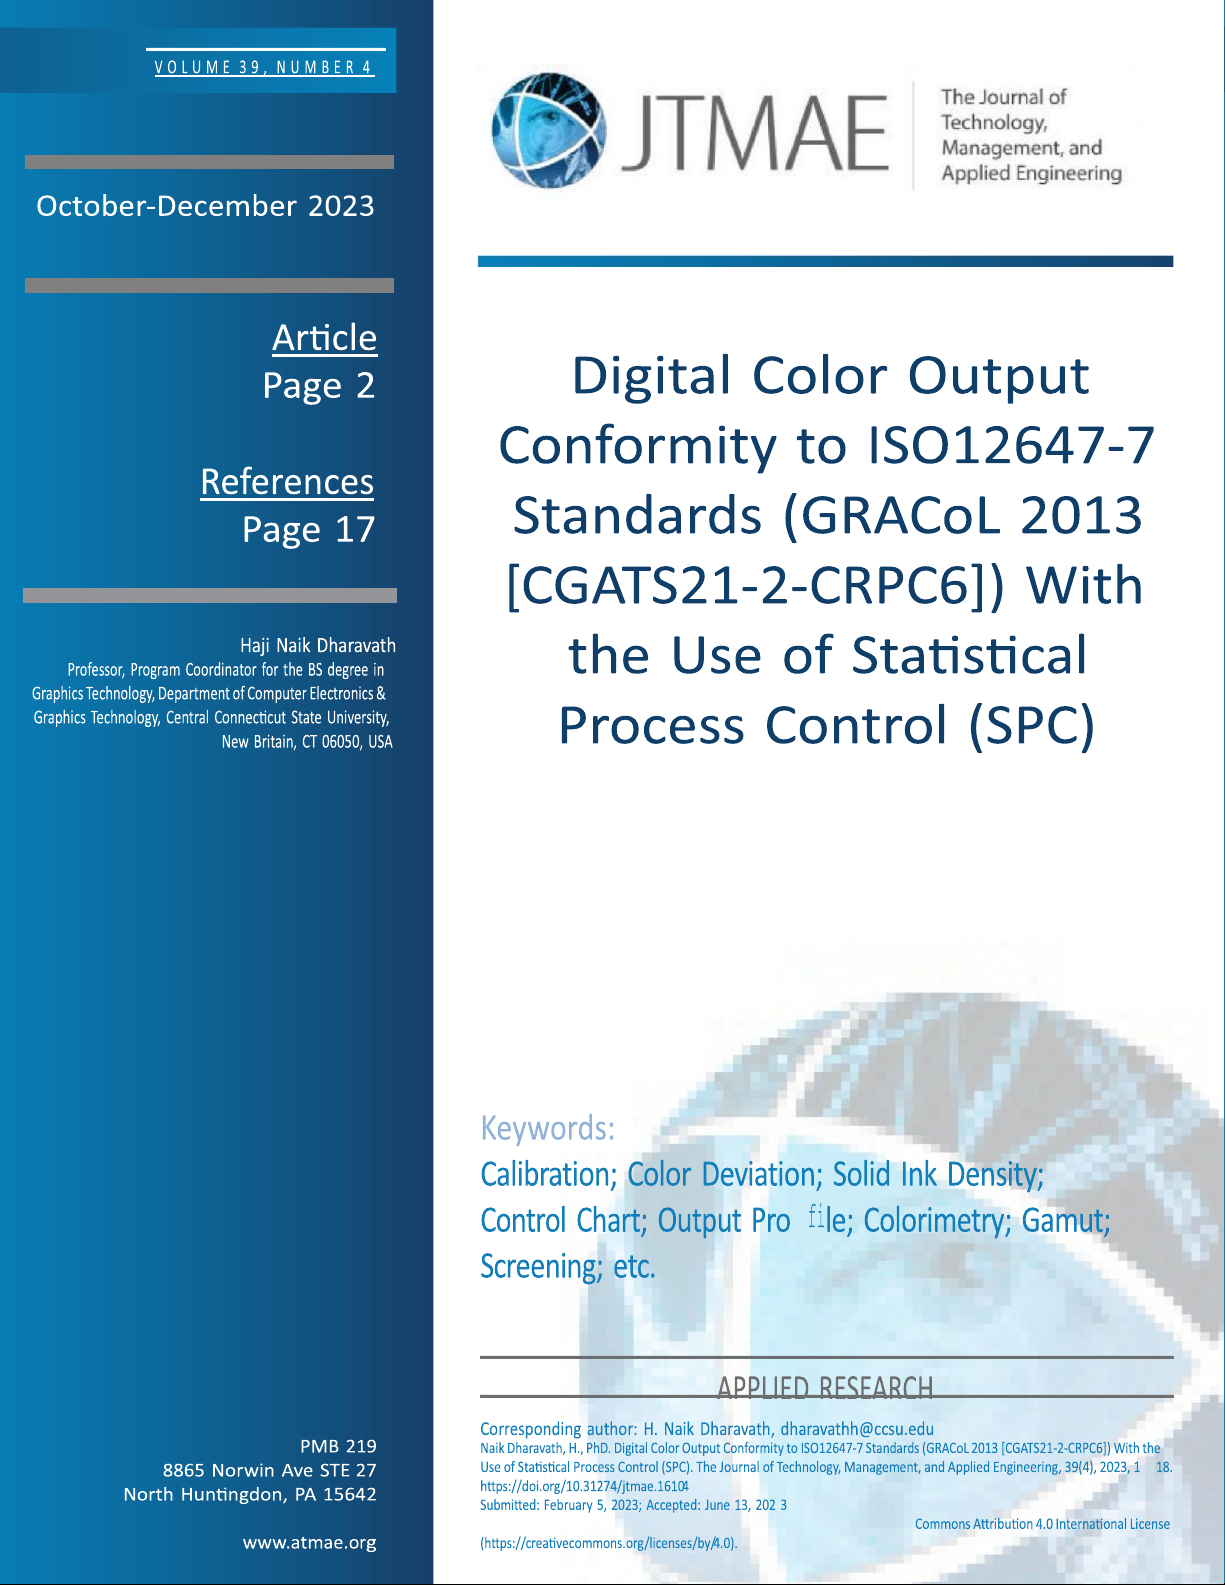
of proper color management techniques (see Figure 1).
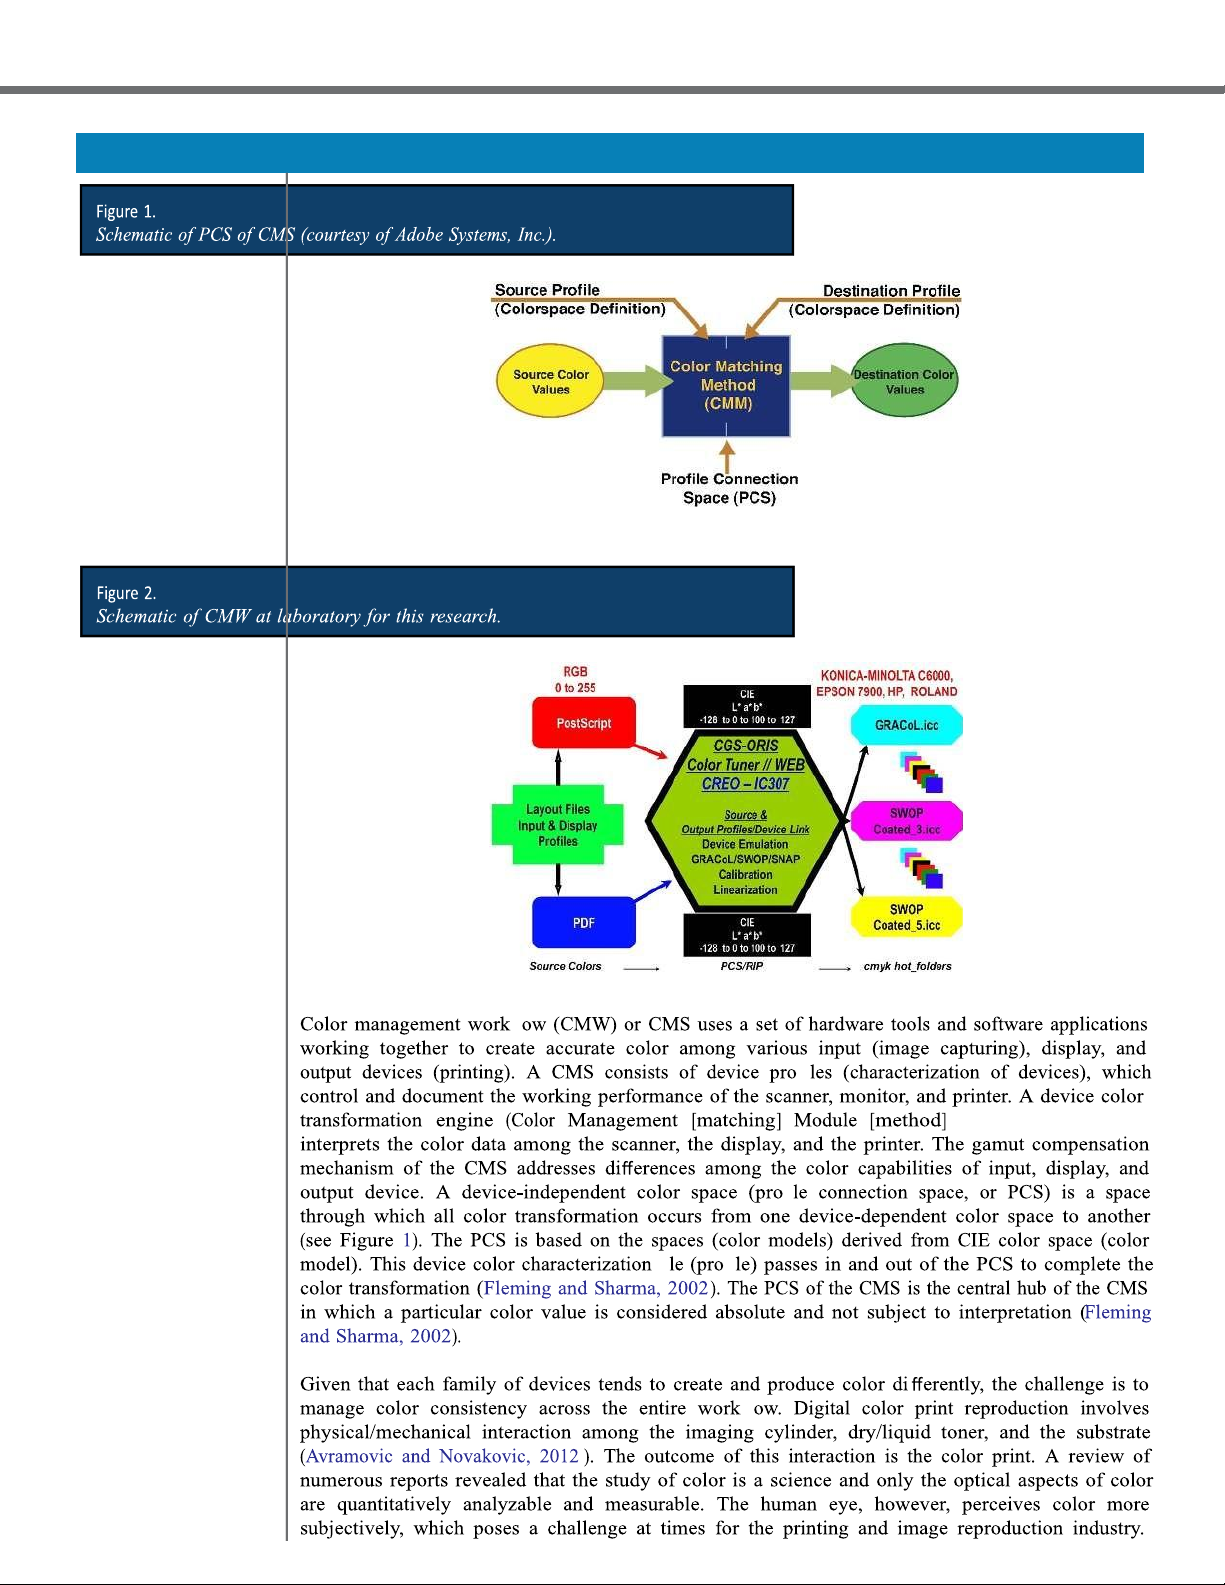
Analyzing the color image by examining its quantitative attributes eliminates the subjective judgment of
color quality evaluation of printed colors or colors in nature. Color managed digital printing workflow lOMoAR cPSD| 58583460 OCT-DEC 2023
The Journal of Technology, Management, and Applied Engineering
(CMDPW) is represented through schematic illustrations of activities that reflect the systematic
organization of analog and digital devices used during the print and image production process (see Figure
2). A print ready e-file (.PDF or.JPEG or.PSD or PostScript, etc.) is likely to be manipulated and later printed
by an array of output digital devices (computer-to-plate [CTP], digital printers and printing presses). lOMoAR cPSD| 58583460 OCT-DEC 2023
The Journal of Technology, Management, and Applied Engineering fl fi fi fi fi fl lOMoAR cPSD| 58583460 OCT-DEC 2023
The Journal of Technology, Management, and Applied Engineering or CMM) is one
that Input (scanners or digital cameras) and output (monitors or printers) devices produce colors
differently because they depend on their own color capabilities. The CMS simplifies and improves the reproduction of color images
accurately from device to device.
Statistical Process Control Tools
Statistical process control (SPC)—the creation of internal standards—and equipment performance tracking
are becoming increasingly important in the CMDPW (Kipman, 2001). In a given CMDPW scenario in
which visual methods are currently being used to evaluate image quality in production printing,
measurement methods can either replace or augment results adding objective judgment, traceability, and
validity. Therefore, this increased efficiency becomes an added benefit to the CMDPW. Quality
improvement practices represent a leading approach to the essential, and often challenging, task of
managing organizational change (Burnes, 2000). SPC is, in turn, a key approach to quality improvement
(Wheeler and Chambers, 1992). SPC was developed in the 1920s by the physicist Walter Shewhart to
improve industrial manufacturing (Thor et al., 2007).
In a CMDPW, use of SPC is a scientific technique to control, manage, analyze, and improve the performance
of a process by eliminating special causes of variation in the digital printing process (Thor et al., 2007). It
is a powerful collection of problem-solving tools useful in achieving process stability and improving
capability through education on variability (Abtew et al., 2018). There are seven original SPC tools: flow-
charts, check-sheets, histograms, Pareto diagrams, cause-and-effect diagrams, scatter diagrams, and control
charts (Mears, 1995). SPC enables us to control quality characteristics of the methods, machines, workforce,
and products. There are two kinds of variations that can occur in all manufacturing processes, including the
digital printing, which causes subsequent variations in the final product (Abtew et al., 2018). The first is
known as the common cause of variation and consists of the variation inherent in the process as it is designed
(Abtew et al., 2018). It may include variations in temperature, properties of raw materials, ink/toner, etc.
The second kind of variation is known as a special cause of variation and happens less frequently than the
first (Abtew et al., 2018). For an example, failed calibration and characterization methods could be carried
into the production processes.
A control chart is the best tool for determining whether a process (CMDPW) is in-control or not incontrol.
An in-control process is one that lacks “assignable causes” or “special causes” of variation. This means that
the processes output will be consistent over time. This is not to say that the process will be capable of
meeting your needs or your customer’s expectations, just that the results will be relatively consistent
(Blevins, 2001). Good color reproduction requires consistency in the CMDPW. Accurate color reproduction
is dependent upon several factors. One of the factors is the cyan, magenta, yellow, and black (CMYK) ink
densities and quality of device profiles. To achieve acceptable printing results, it is important to establish
aim points (target values or control limits [CLs] of the process) and monitor the aim point consistency
during the production process. With the use of specific process control techniques (SPC tool), one can
determine whether the consistency is in-control or not in-control. If the average density or color deviation
values (delta E) and range of the process fall between the established aim points, the process is said to be
within the specific process control. Contrarily, if the color deviation and density values are not within the
aim points, they would be not in-control (out of control). Purpose of the Research
The experiment was conducted in a CMDPW. The purpose of this applied study was to determine the
colorimetric variation among the printed colors’ overall average color (CMYK RGB) deviation (ΔE) in the
electrophotographic color printing process over a period of time (100 days). To determine the statistically
significant process variation among these color deviations over a period of time (OAPOT), a control chart
analysis technique (SPC tool) was employed. Reference colorimetric values are the threshold deviations
(acceptable color deviations) as outlined in the ISO12647-7 standards. To accomplish this, the following
guiding objectives were established: determine the deviation in color printing average/overall lOMoAR cPSD| 58583460 OCT-DEC 2023
The Journal of Technology, Management, and Applied Engineering
(CMYK+RGB) ΔE over a period of time (100 days) by comparing the printed colorimetry against the reference colorimetry. lOMoAR cPSD| 58583460 OCT-DEC 2023
The Journal of Technology, Management, and Applied Engineering fi fi fi fi
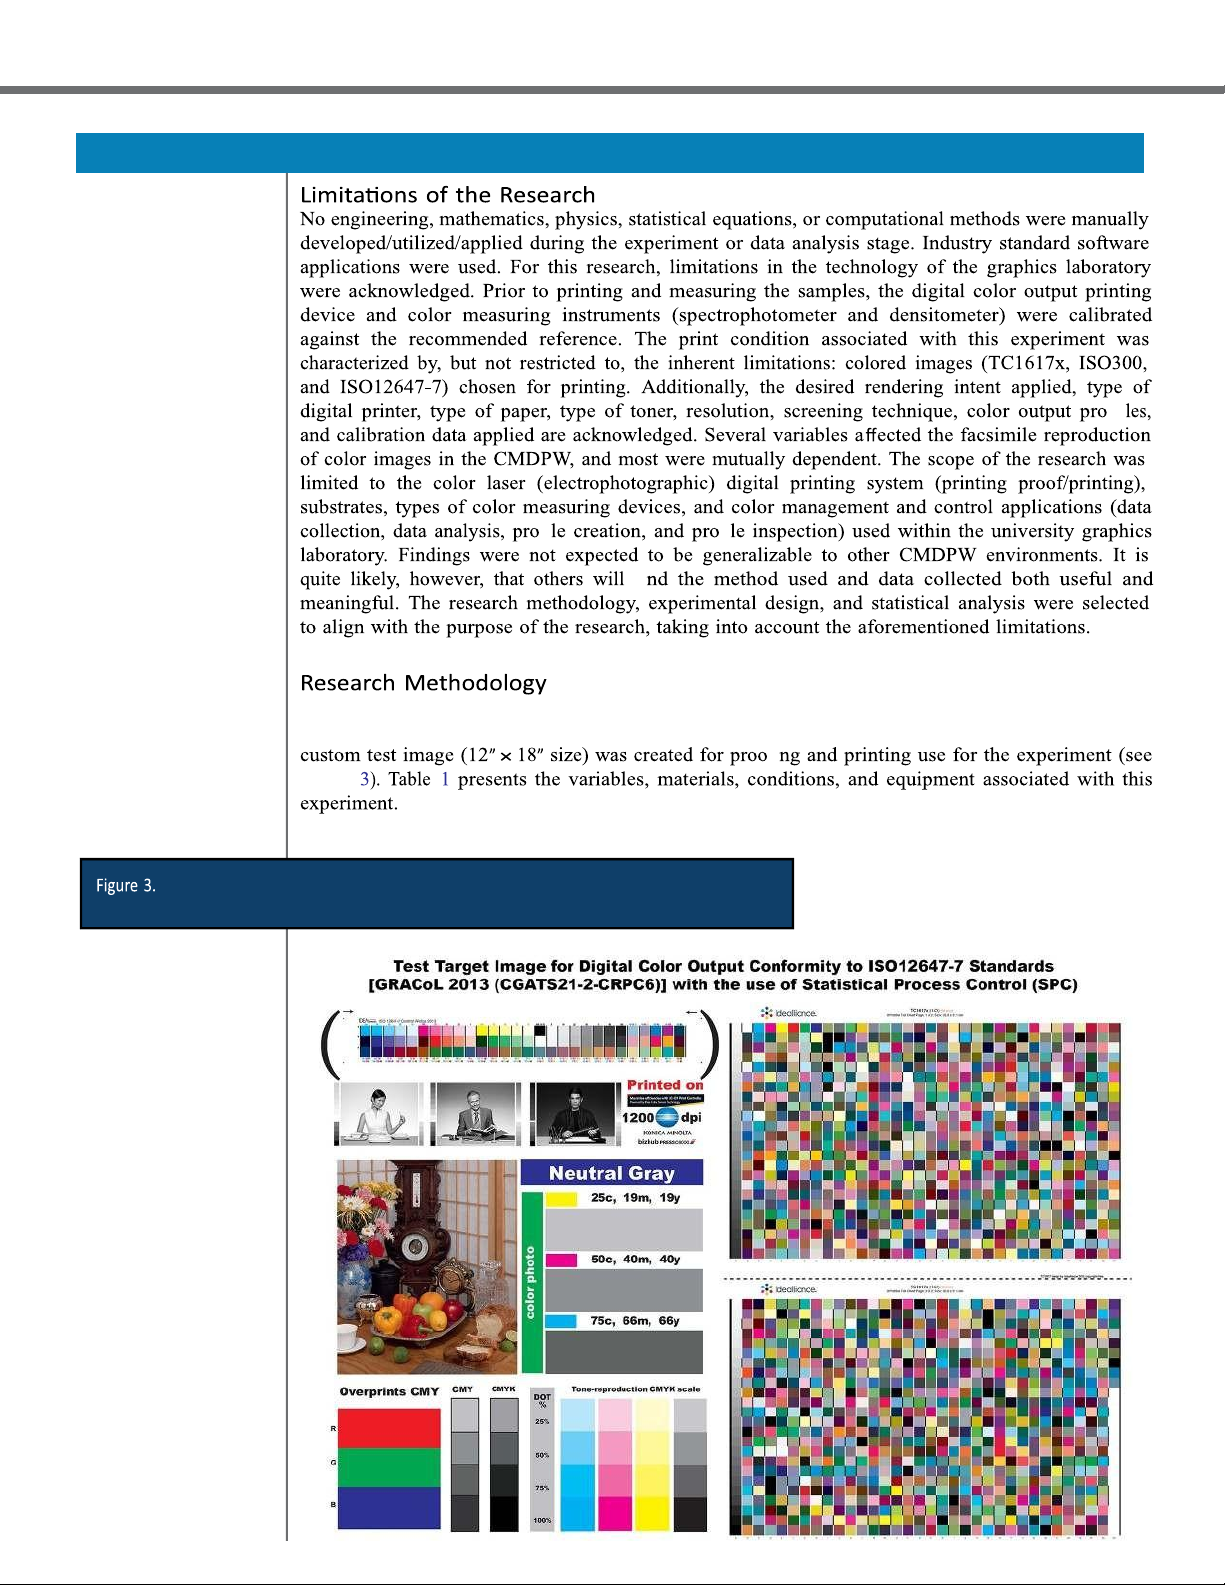
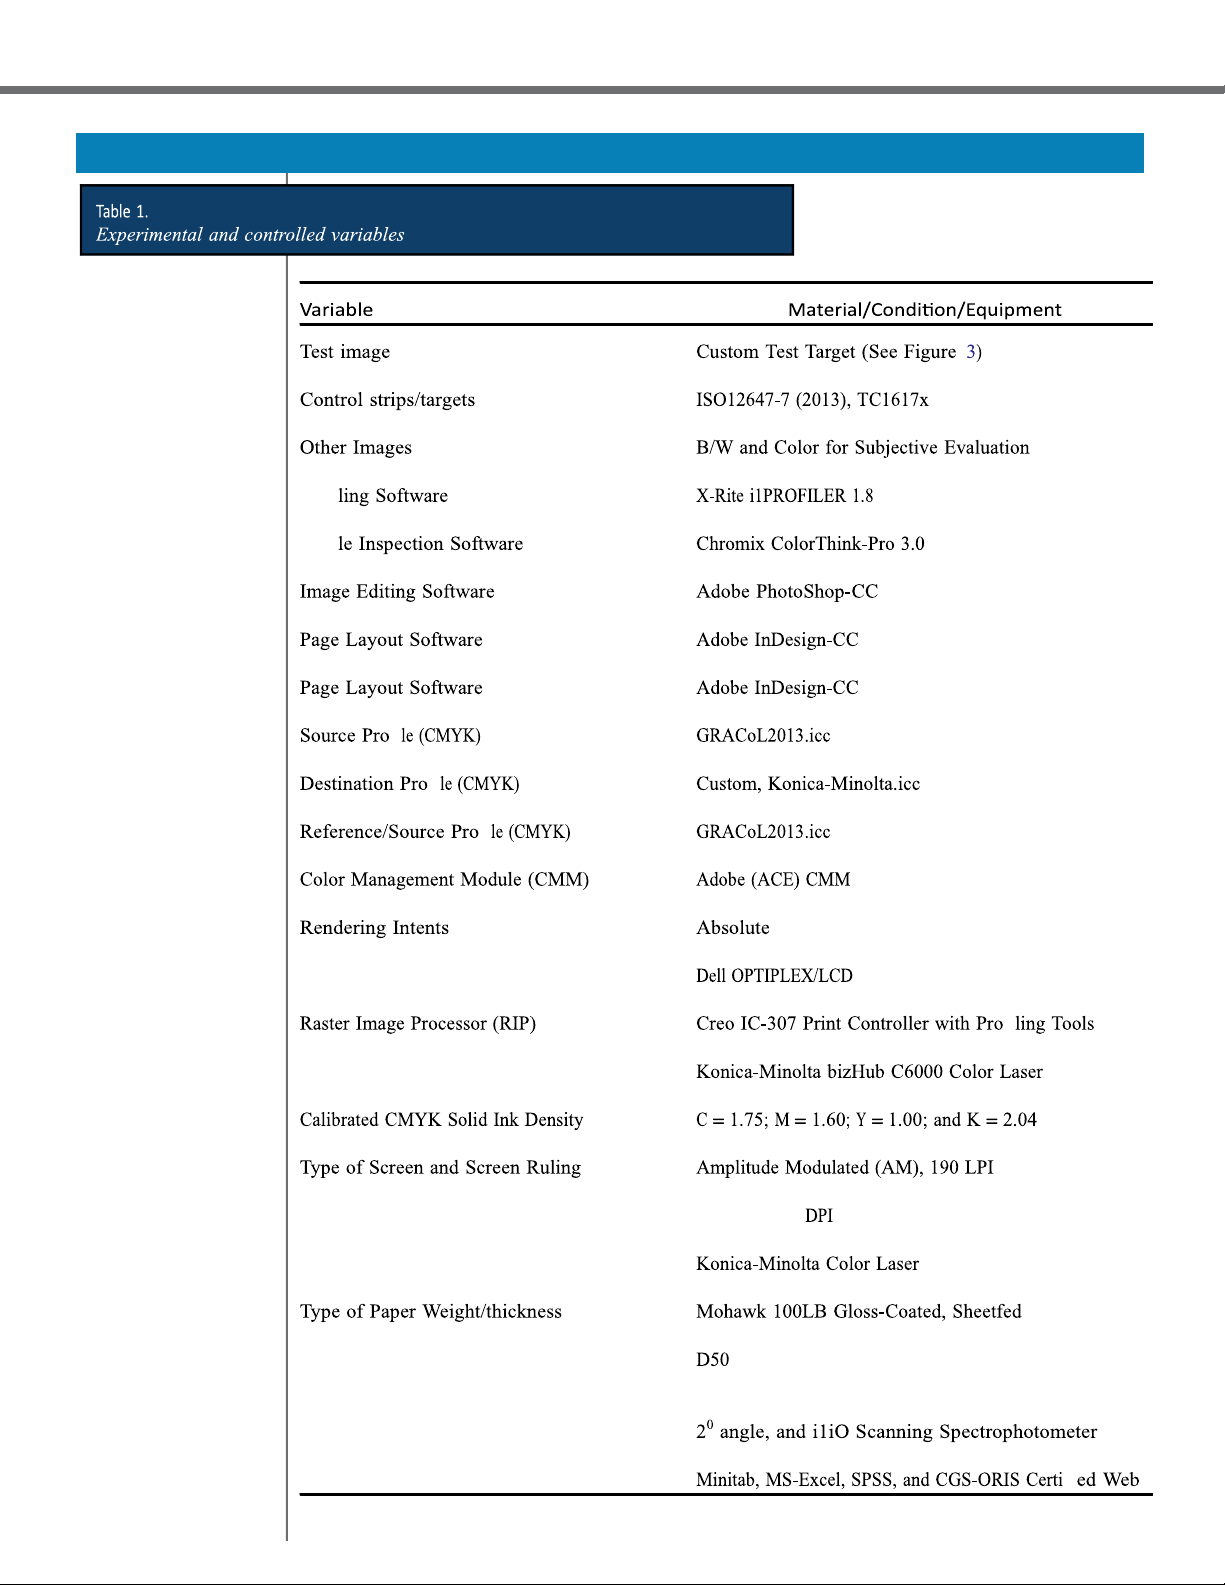
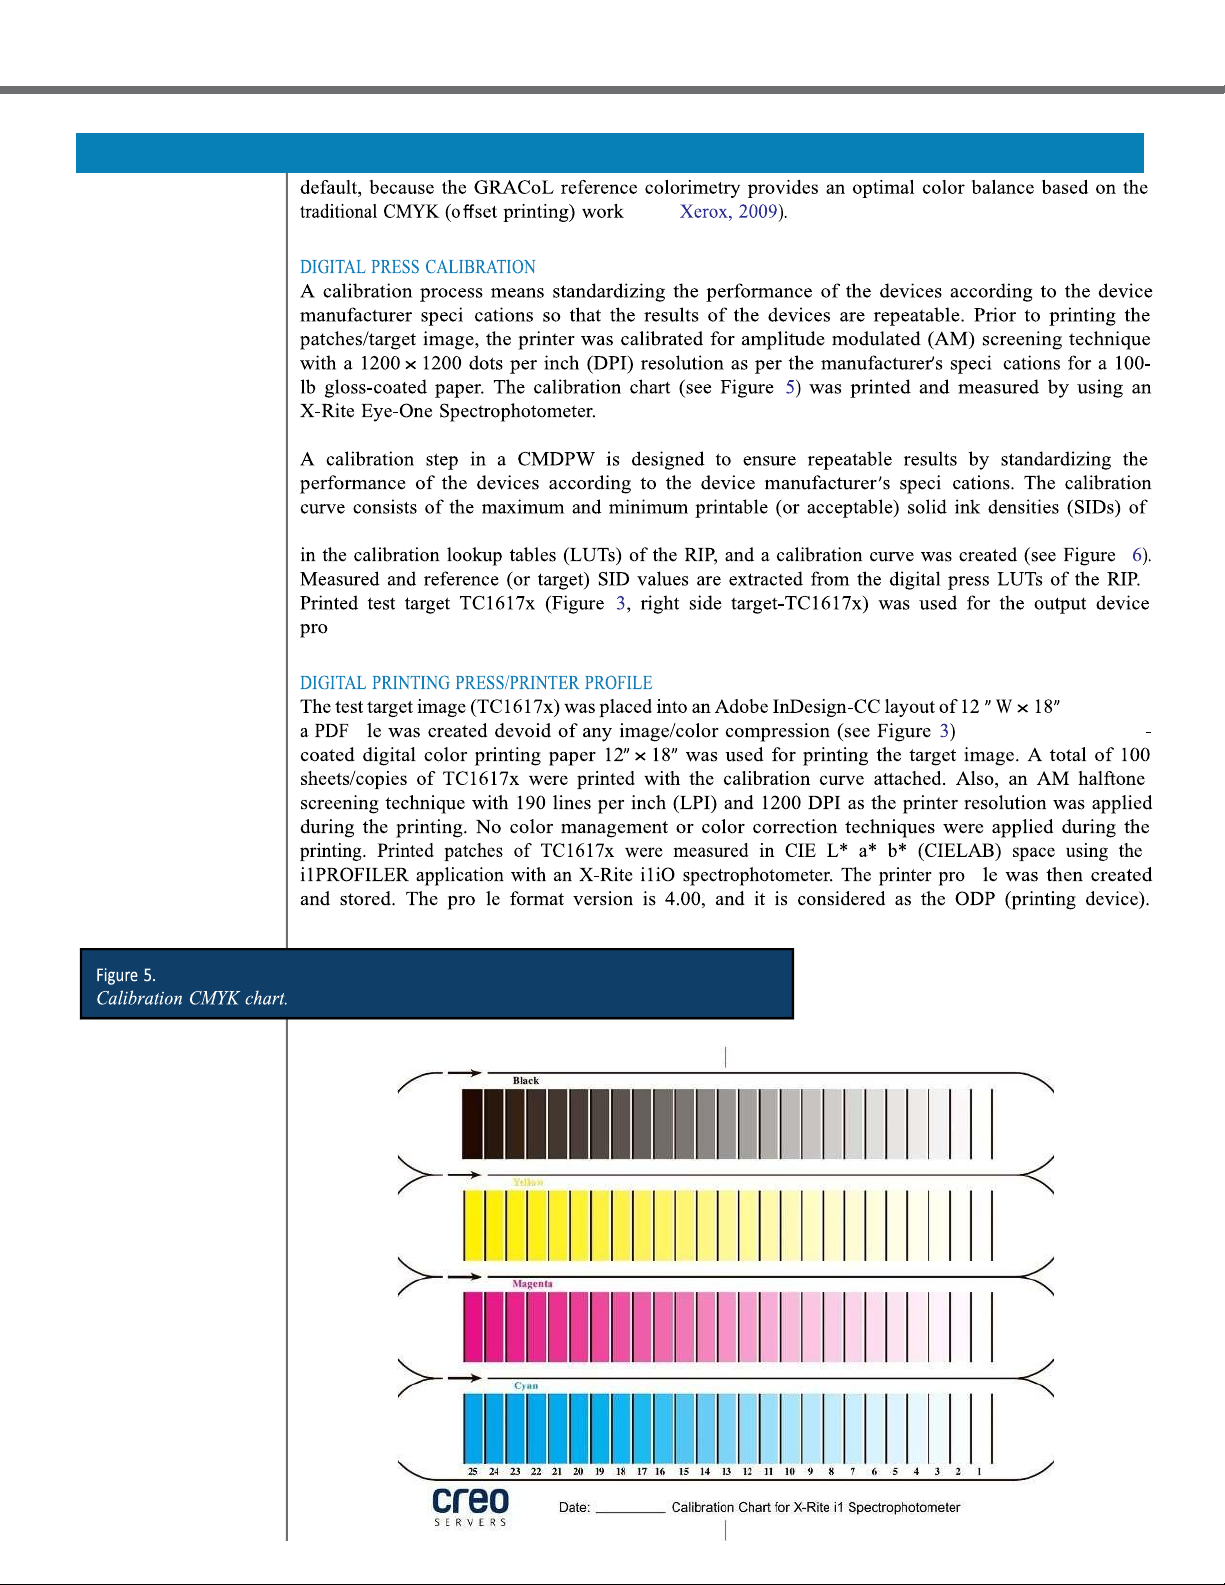
The digital color printing device used in this experiment is a Konica-Minolta (KM) bizHub C6000 Digital
Color Press. It uses a Creo IC-307 raster image process (RIP) application (front-end system). A two-page fi Figure Test target image. lOMoAR cPSD| 58583460 OCT-DEC 2023
The Journal of Technology, Management, and Applied Engineering Pro fi Pro fi fi fi fi Computer & Monitor fi Digital Press/Printer Print Resolution 1200 x 1200 Toner
Type of Illumination/Viewing Condition Color Measurement Device(s)
X-Rite Eye-One PRO Spectrophotometer with Status T,
Data Collection/Analysis Software fi lOMoAR cPSD| 58583460 OCT-DEC 2023
The Journal of Technology, Management, and Applied Engineering
The test target contained the following elements: generic images for subjective evaluation of color,
ISO12647-7 Control Strips (2013, three-tier), and a TC1617x target for gamut/profile creation.
Colorimetric, densitometric, and spectrophotometric data were extracted by using an X-Rite Eye-One
Spectrophotometer and an X-Rite i1iO Scanning Spectrophotometer from the color printed samples for the
analysis. The process (CMDPW) was monitored for a total of 100 days. A total of 100 samples of target
color images were printed/collected for daily measurement/analysis purpose; 100 prints were noted by the
letter “N” (N = 100). Of 100 samples, 80 samples (n = 80) were randomly selected and measured, noted by
the letter “n” (n = 80). This sample size was selected in order of the specific confidence interval (α= 0.05).
Glass and Hopkins (1996) provide an objective method to determine the sample size when the size of the
total population is known. This sample size is needed to ensure the reliability of data is accurate. It is well
documented that a large sample size is more representative of the sampling (subjects) population (Glass and
Hopkins, 1996). The following formula was used to determine the required sample size, which was 80 (n)
printed sheets for this study (Glass and Hopkins, 1996):
n = ½χ2NPð1 − PÞ ÷ ½d2ðN − 1Þ þ χ2Pð1 − PÞ
n = the required sample size χ2= the table value of chi-square for 1 degree of freedom at the desired confidence level (3.84) N = the total population size
P = the population proportion that it is desired to estimate (0.50) d =
the degree of accuracy expressed as a proportion (0.05)
CMW Setup for the Digital Press
The digital output device used in this experiment is a KM C6000bizHub color printer (or digital press). KM
C6000 uses a Creo IC-307 RIP server (front-end system)–based workflow application. This workflow
application (the RIP) enables the printer (or designer or operator) to emulate/simulate (see Figure 4) the
color device to print as per the ISO12647 series digital color printing production standards. The RIP
provides software tools for calibrating the printer and creating an ICC device profile.
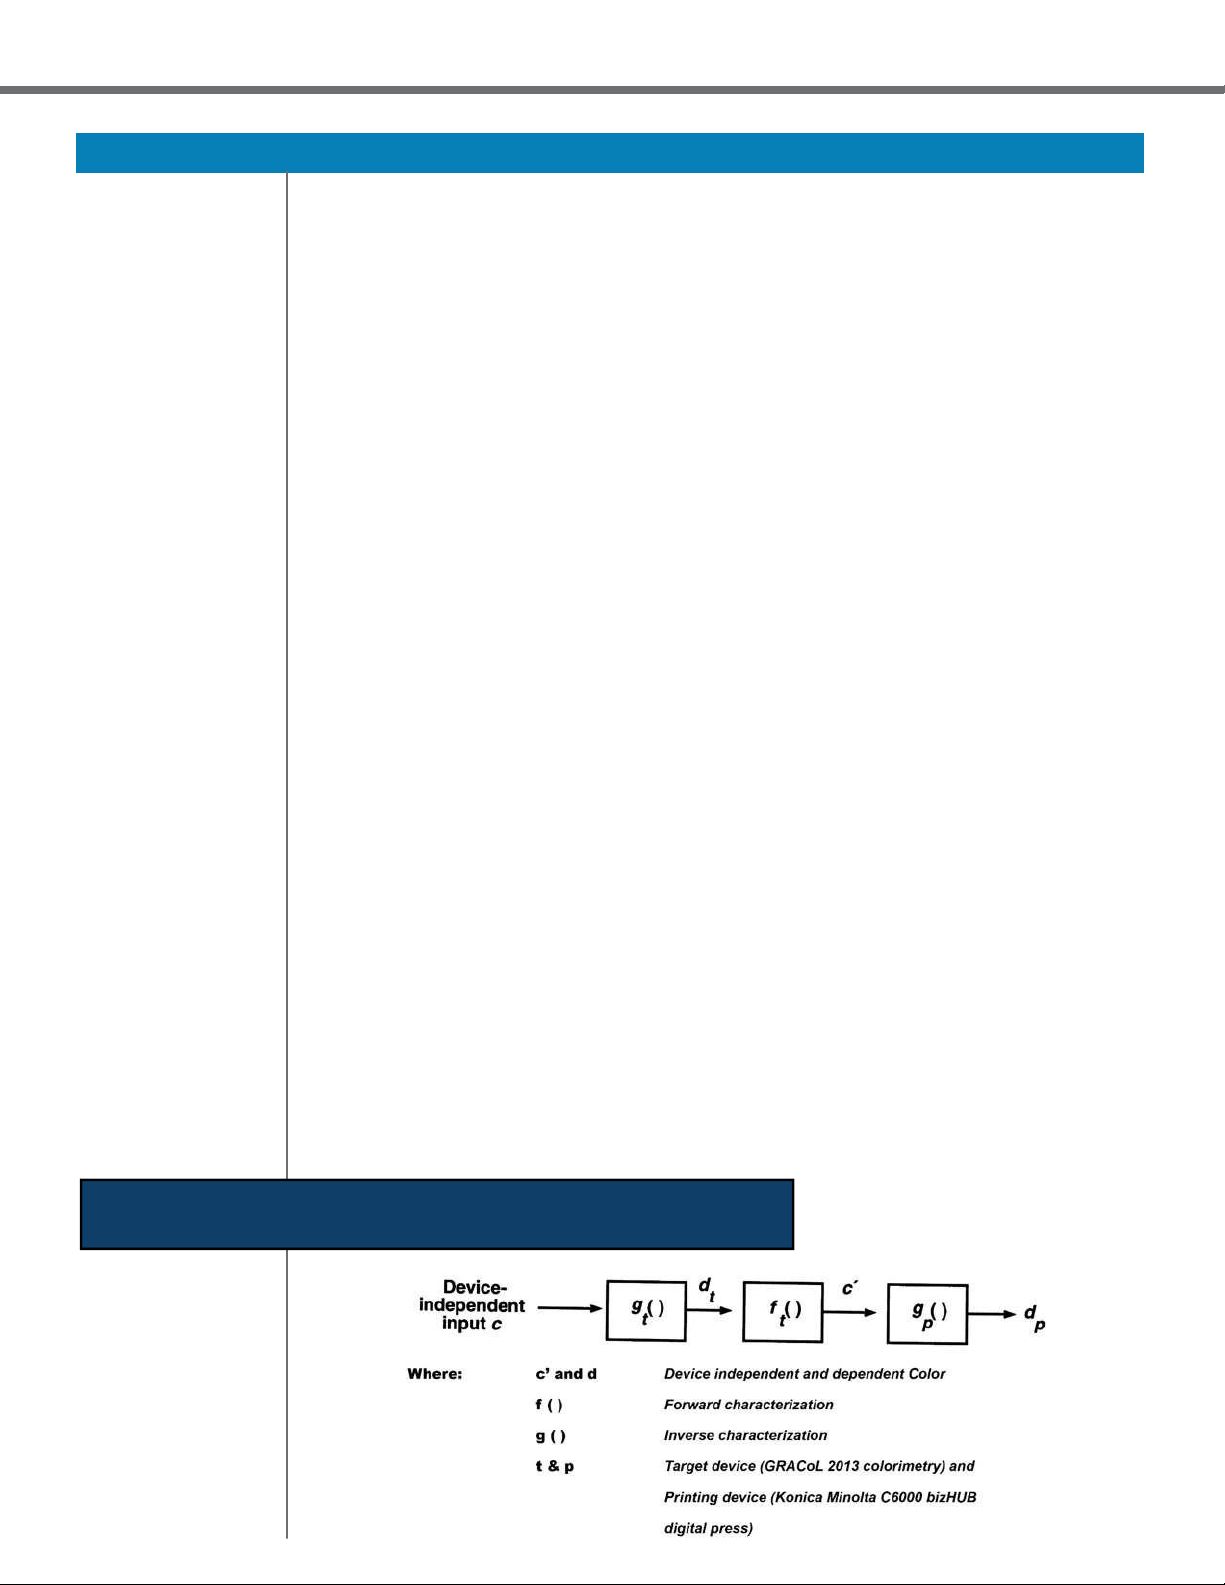
This simulation process requires the characterization data (an ICC profile) from the printing device
(destination printer) as well as the data from the target device (an ISO12647-7 reference colorimetry or
other target device profile). Figure 4 illustrates how a device emulation is accomplished from
characterizations of the proofing and target (printing) devices (Raja, 2002). Emulation/simulation is not
possible without two profiles. In this scenario, target colors are the source colors outlined in the General
Requirement for the Applications in the Commercial Offset Lithography (GRACoL 2013) standards, and
the printed colors are the destination colors of a device (KM bizHUB C6000 digital press). Many up-to-
date CMYK workflows emulate the printed colors to GRACoL standards by Figure 4.
Color transformation of device emulation/simulation (proof/printing). lOMoAR cPSD| 58583460 OCT-DEC 2023
The Journal of Technology, Management, and Applied Engineering fl ows ( fi fi fi
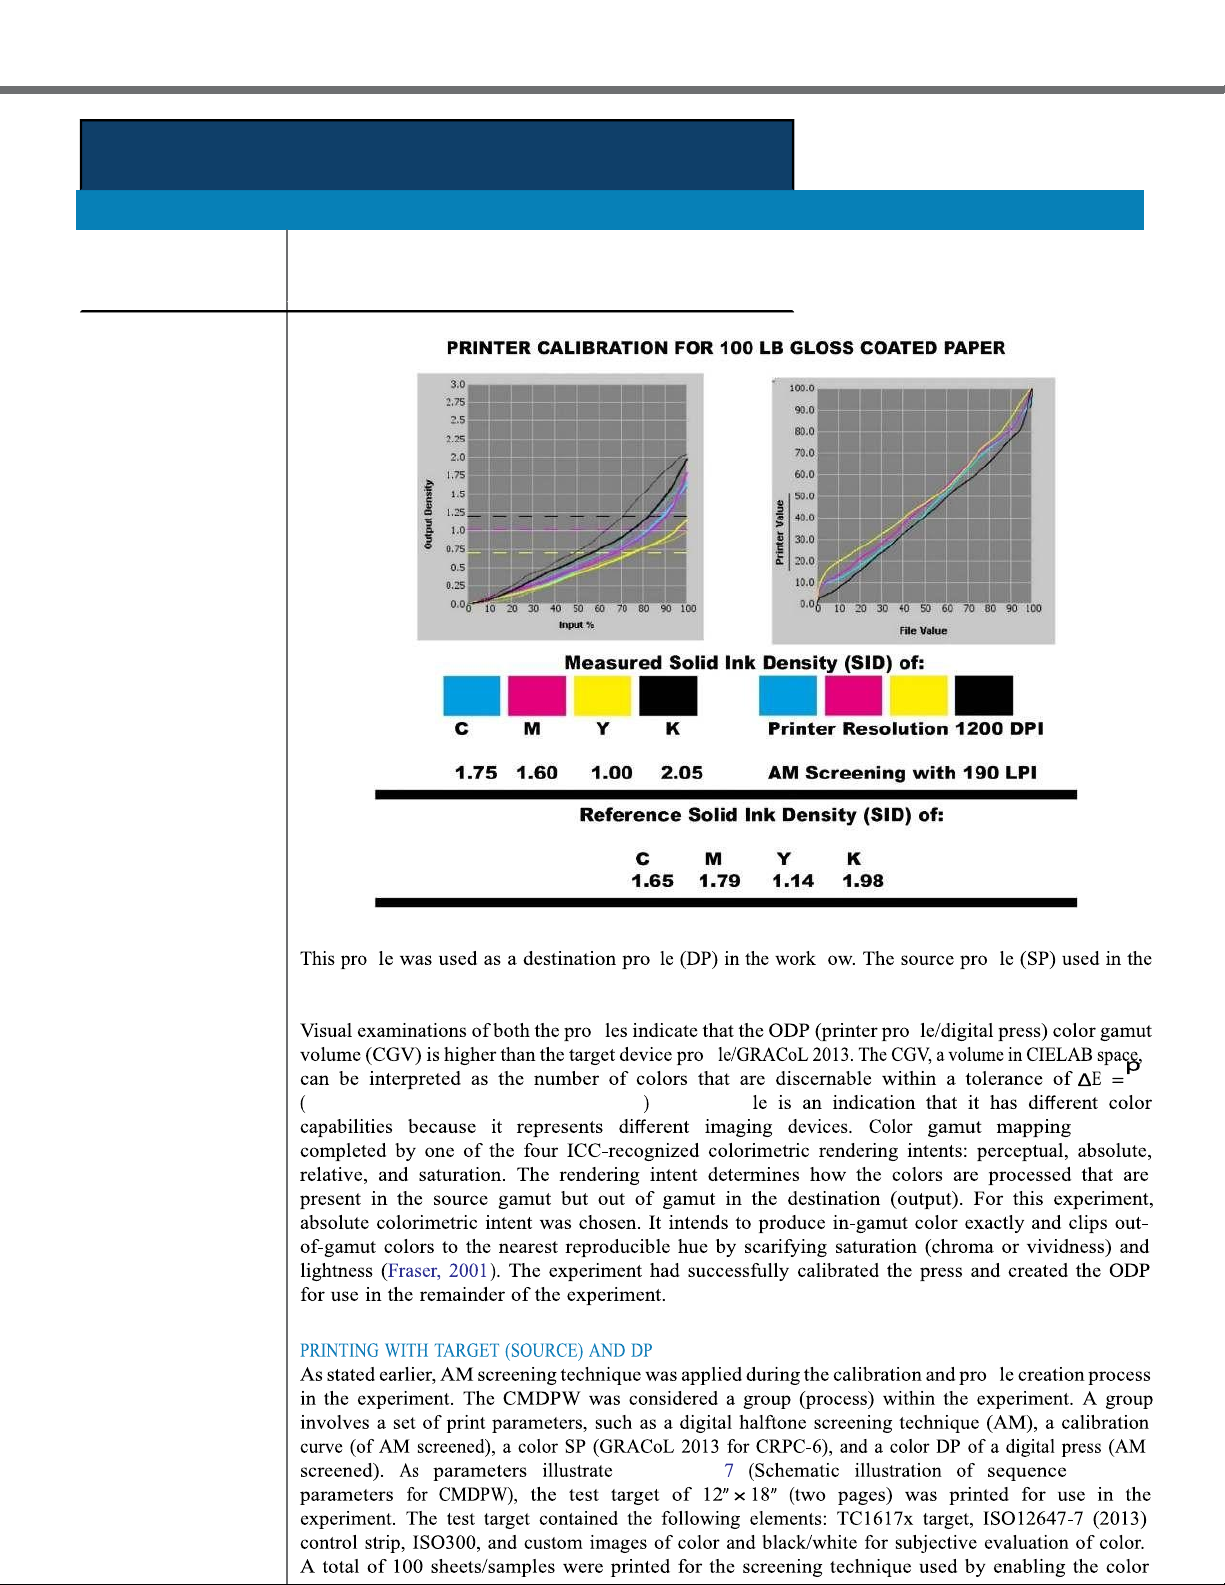
each color (CMYK) used for the printing. The calibration data (range of CMYK densities) were saved
fi le (ODP) creation process. H size, and fi . Mohawk 100-lb gloss fi fi lOMoAR cPSD| 58583460 OCT-DEC 2023
The Journal of Technology, Management, and Applied Engineering 3 fi fi fl fi
experiment is a GRACoL 2013 for characterized reference printing conditions-6 (CRPC-6). fi fi fi
Chovancova-Lowell and Fleming, 2009 . Each pro fi fi in Figure lOMoAR cPSD| 58583460 OCT-DEC 2023
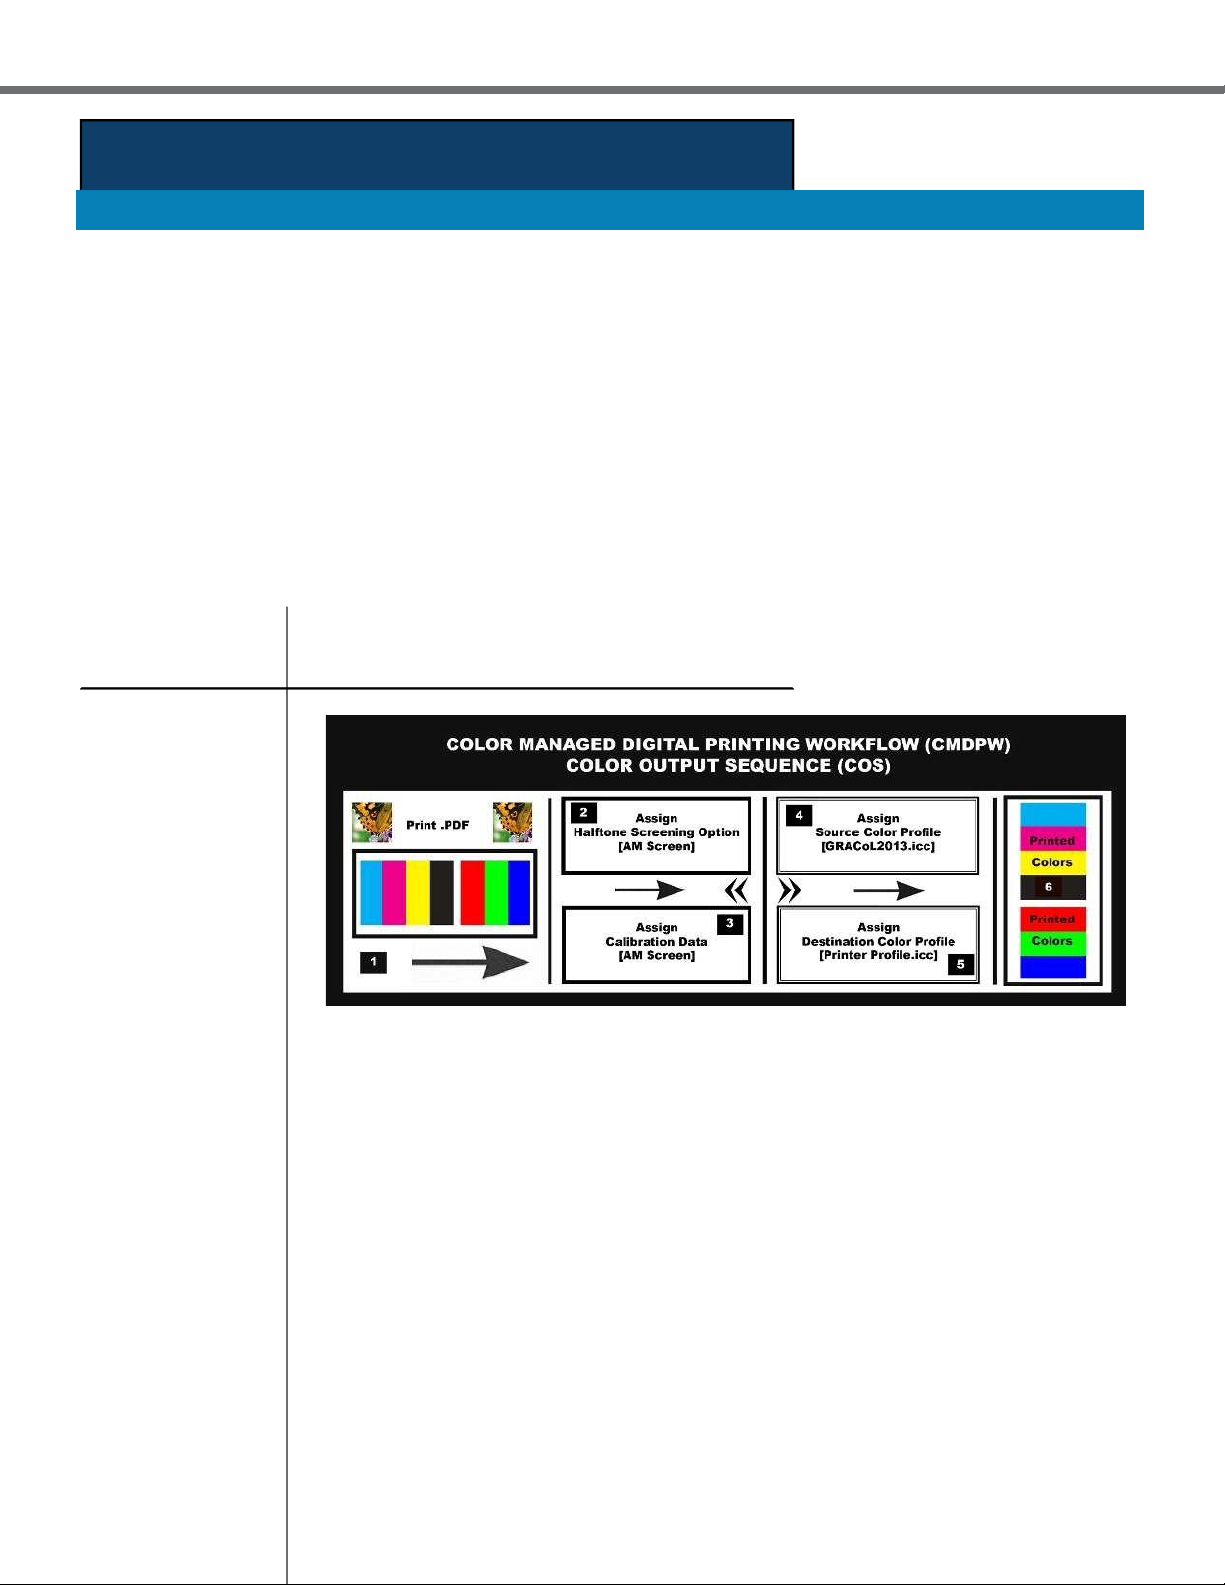
The Journal of Technology, Management, and Applied Engineering can be of print Figure 7.
Schematic illustration of sequence of print parameters for CMDPW.
management technique at the RIP. The digital press calibration curve, DP, and SPs all were applied during the printing (see Figure 7).
The group printing performances were monitored for a period of 100 days to determine the fluctuations in
the color consistency (4th C of CMW) by printing multiple printing jobs on the same type of paper with the
same print sequences. Prior to start of printing for the day, the test target (Figure 3) was printed and measured
for colorimetric and densitometric data, and the sample was kept aside for a later-stage analysis. A total of
100 target images were printed/collected for the analysis. Of the 100 printed samples (from 100 days, N =
100), data were generated from the randomly pulled 80 printed samples (80 days samples, n = 80). The test
image consists of a printed ISO12647-7 (2013) control strip (see Figure 3, right side, top bar). By using
Eye-One-Pro spectrophotometer with interface application, such as the CGS-ORIS Certified WEB, the
printed image was measured against the GRACoL2013_CRPC6 reference data. Measured colorimetric data
(CIELAB) from the ISO12647-7 (2013) control strip were used to determine the color deviations. Data
derived from the ISO126477 (2013) control strip (sample) is the difference between the characterization
data set (full IT8.7/4 target) and the sample. The control strip (wedge) image is intended primarily as a
control device for pre-press proofs but may also be used to control production printers or presses. The wedge
has three rows and 84 patches, and it contains only a small sub-sample of the total printable color gamut. lOMoAR cPSD| 58583460 OCT-DEC 2023
The Journal of Technology, Management, and Applied Engineering
The wedge contains too few patches to prove an accurate match to a specification like GRACoL or SWOP
(Specifications for Web Offset Publications). It does contain enough patches to monitor the stability of a
system that has previously been tested with a target such as the IT8.7/4 (CMYK target image). The reference
file content for this image (IT8.7/4) are the CMYK dot percentage values and the nominal CIELAB
characterization data values for the GRACoL 2013CRPC6 reference. Colorimetric, densitometric, and
spectrophotometric computations were used to determine the color deviations. Colorimetric formulae and
formats were presented in the following section (“Data Analysis and Research Findings”) for each of the
color deviations/ attributes investigated.
Data Analysis and Research Findings
Colorimetric computations and SPC methods were used for the color deviations and process variations.
Analyzed collected data are presented in the following pages and tables. Subjective judgment on color
difference or any deviations was not used in this particular study because the subjective judgment of color
differences could differ from person to person. For example, people see colors in an image not by isolating
one or two colors at a time (Goodhard and Wilhelm, 2003) but by mentally processing contextual
relationships between colors where the changes in lightness (value), hue, and chroma (saturation) contribute
independently to the visual detection of spatial patterns in the image (Goodhard and Wilhelm, 2003).
Instruments such as colorimeters and spectrophotometers eliminate subjective errors of color evaluation perceived by human beings. lOMoAR cPSD| 58583460 OCT-DEC 2023
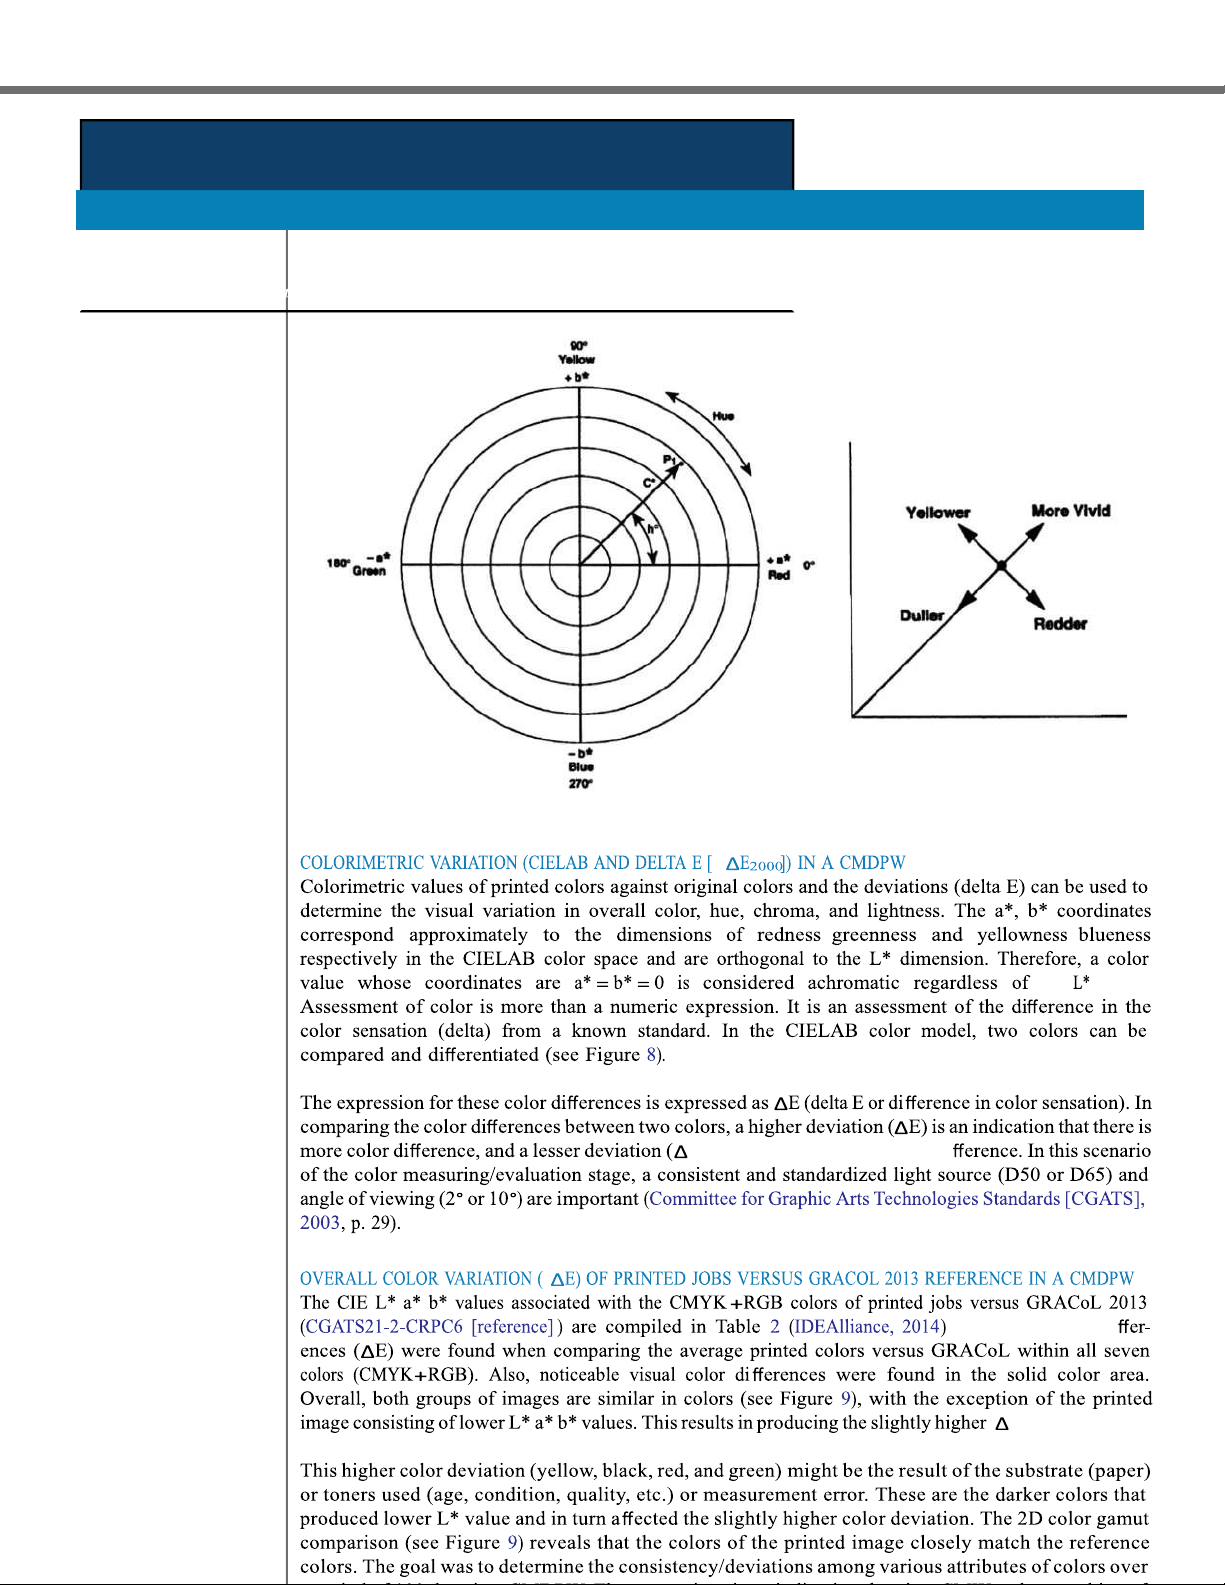
The Journal of Technology, Management, and Applied Engineering – – its
E) is an indication of less color di . Numerical color di E for these colors. lOMoAR cPSD| 58583460 OCT-DEC 2023
The Journal of Technology, Management, and Applied Engineering value. Table 2.
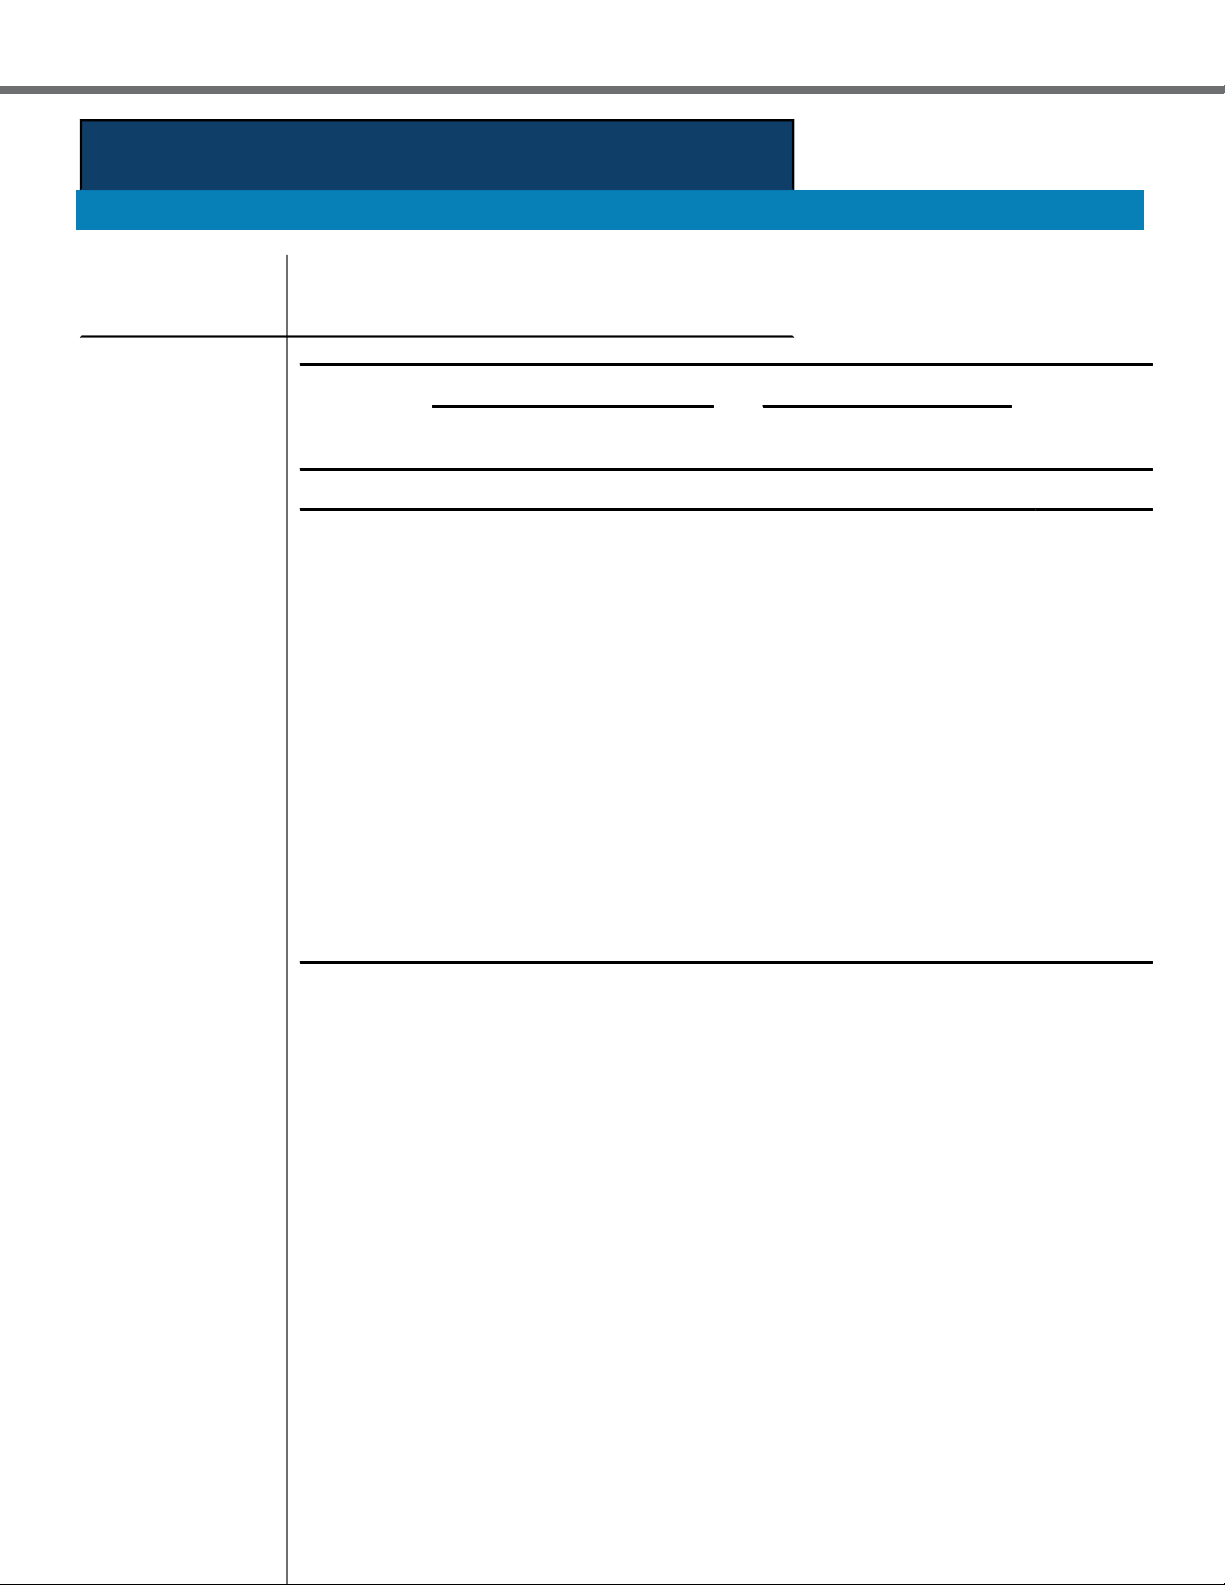
Overall Color Variation of CMYK+RGB: Printed Jobs vs. GRACoL 2013, CRPC-6 Ref. Printed Jobs Average GRACoL 2013 Color
CIE L* a* b* L* a* b* Difference Color(s) Color 1 Color 2 ΔE(2000) N = 80* N = N/A White (W) 95.99 1.22 −6.22 95.02 0.98 −4.02 1.890 Cyan 56.21 −34.54 −50.65 56 −37 −50 1.691 Magenta 47.15 74.92 −2.15 48 75 −4 2.307 Yellow 88.06 −3.94 87.23 89 −4 93 2.749 Black (K) 9.87 −0.18 0.08 16 0 0 3.272 Red 48.75 68.74 47.61 47 68 48 4.657 Green 52.43 −66.48 23.39 50 −66 26 4.038 Blue 24.55 20.66 −49.38 25 20 −46 2.125
Average Printed ΔE(2000) = 2.978; SD = 0.437; Acceptable Threshold ΔE(2000) ≤ 3.00
a target image can be achieved from device to device regardless of device color characterization and original
colors. Subjective judgment was not used for the color comparison.
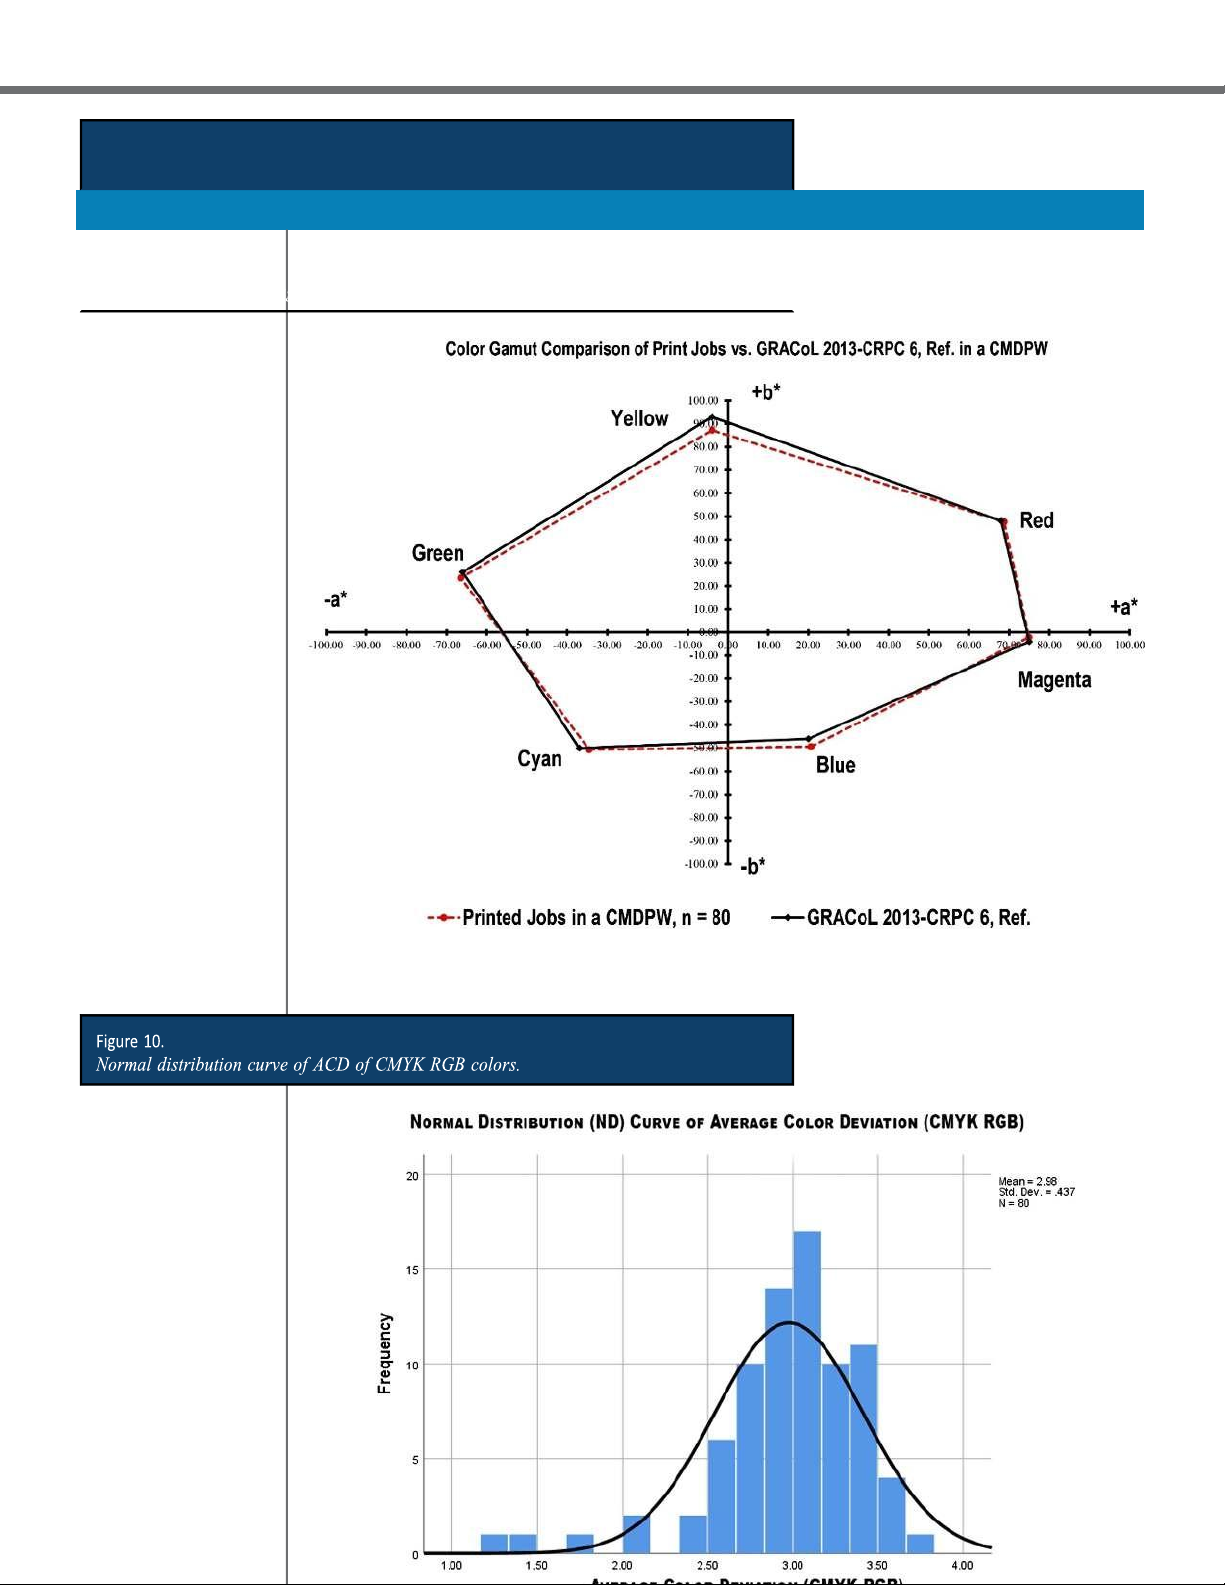
The ND curve is not symmetrical around the mean (average), but it is skewed to the left (see Figure 10)
showing that the average color deviation (ACD) is lower than the median of ACD (X¯ = 2.978, Med =
3.015, SD = 0.437). GRACoL 2013 guidelines indicate the acceptable ACD is 3.00 (ΔE(2000) ≤ 3.00). Most
of the printed jobs produced ΔE(2000) ≤ 3.00. The ACD values are more frequent in occurrence to the left
(see Figure 10) than the right of X. The standard error (Std Err or SE) of ACD is 0.048. It¯ determines the
reliability/accuracy of the average ACD of the CMYK RGB colors in the process. A small SE is an
indication that the produced average is a more accurate reflection of the actual population mean. A larger
sample size will normally result in a smaller SE, whereas the SD is not directly affected by sample size.
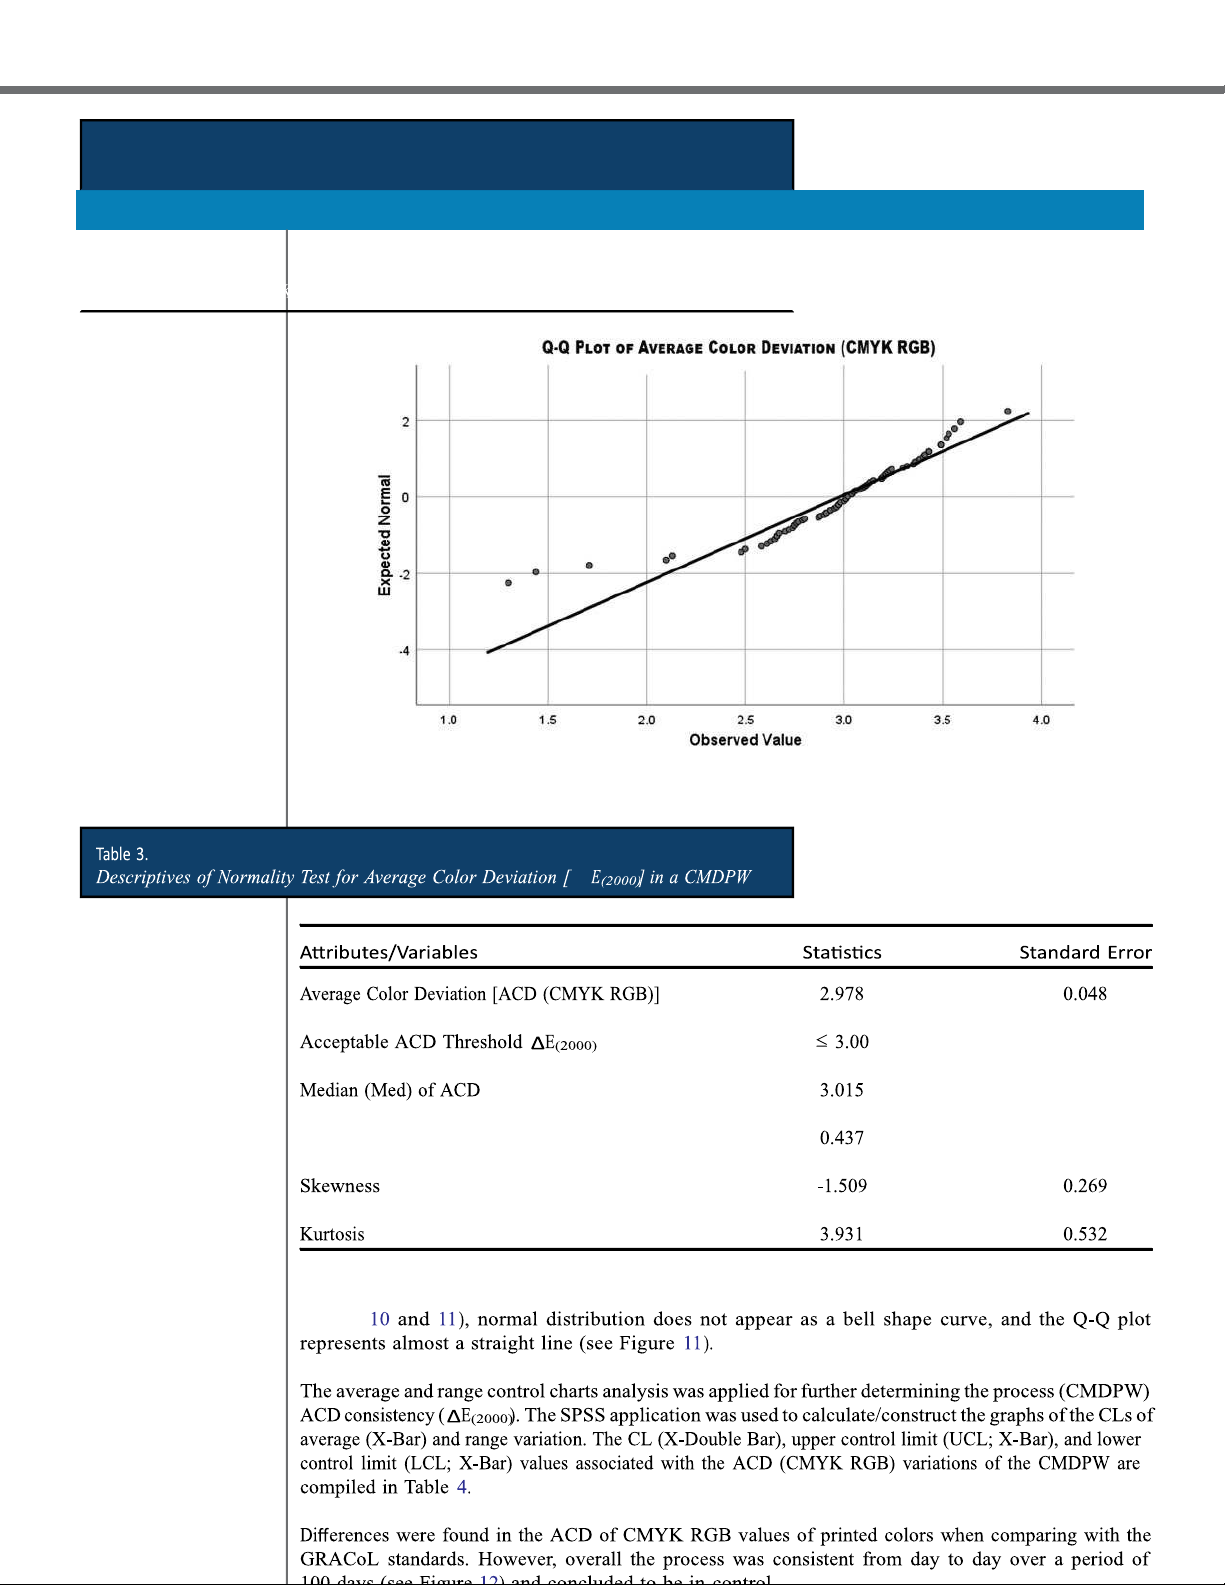
Further normality validation was performed by visually evaluating the ACD of CMYK RGB values by
plotting in the Quantile-Quantile (Q-Q) chart (see Figure 11). It plots the quantiles of ACD values (values
that split a data set into equal portions) of the data set instead of every individual data point of the collected
data. Also, a Q-Q plot is easier to interpret when there is a large sample size (in this case, N = 100, n = 80).
The skewness of the ND is −1.509 (with SE 0.048), and it is interpreted as the data are not symmetrical (see
Table 3). It is negatively skewed (−1 and −0.5). The kurtosis of the ND of the ACD of CMYK RGB colors
of the process is 3.931 (with SE 0.532). The distribution of ACD of CMYK RGB colors is leptokurtic lOMoAR cPSD| 58583460 OCT-DEC 2023
The Journal of Technology, Management, and Applied Engineering
(kurtosis of >3) because this type of distribution is longer and tails are fatter. The peak of the curve is higher
and sharper, which means that data are heavy tailed or there is a profusion of outliers. If the kurtosis is +1.00
of the ND of the ACD of CMYK RGB colors, then the distribution would be too peaked; if there is an
indication of −1.00 of the ND of the ACD of CMYK, the distribution would be too flat. Distributions
exhibiting skewness and/or kurtosis that exceed these guidelines are considered non-normal (Hair et al.,
2017), which the CMDPW was expected to produce. In the graphs (see lOMoAR cPSD| 58583460 OCT-DEC 2023
The Journal of Technology, Management, and Applied Engineering lOMoAR cPSD| 58583460 OCT-DEC 2023
The Journal of Technology, Management, and Applied Engineering Δ Standard Deviation (SD) Figures lOMoAR cPSD| 58583460 OCT-DEC 2023
The Journal of Technology, Management, and Applied Engineering Δ Std. Deviation
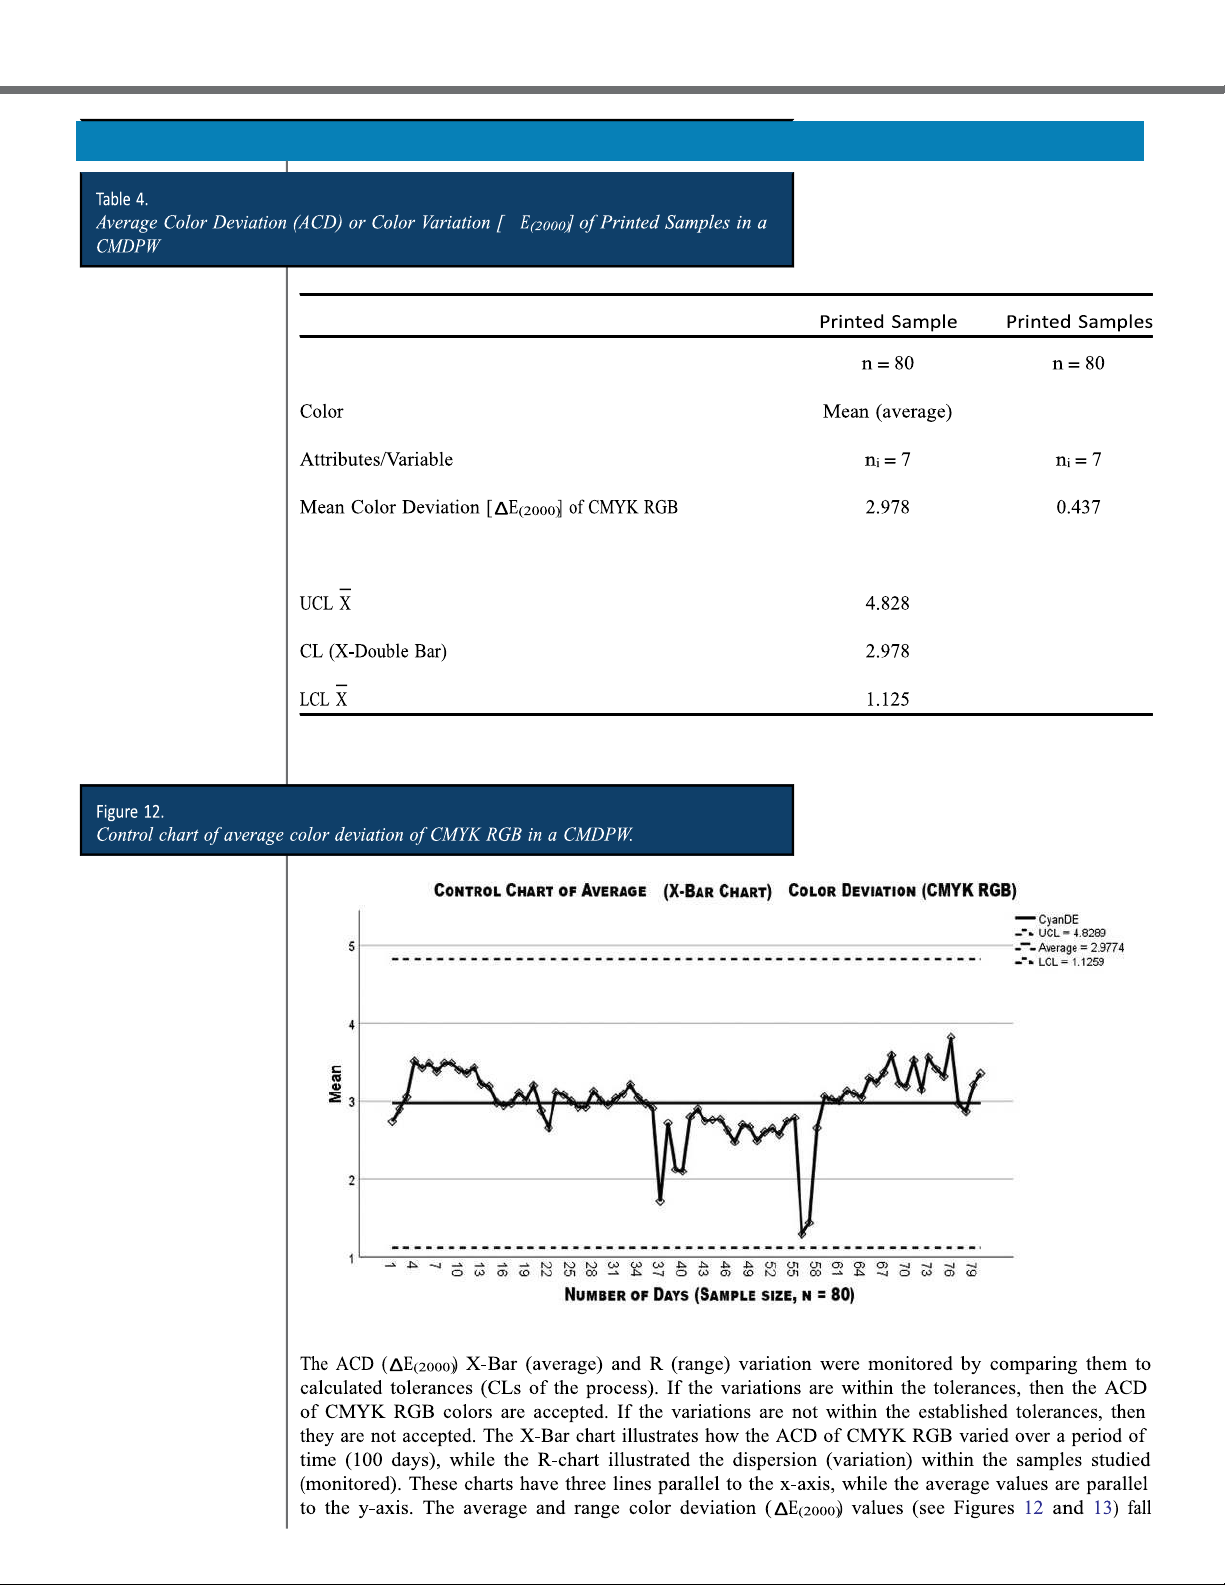
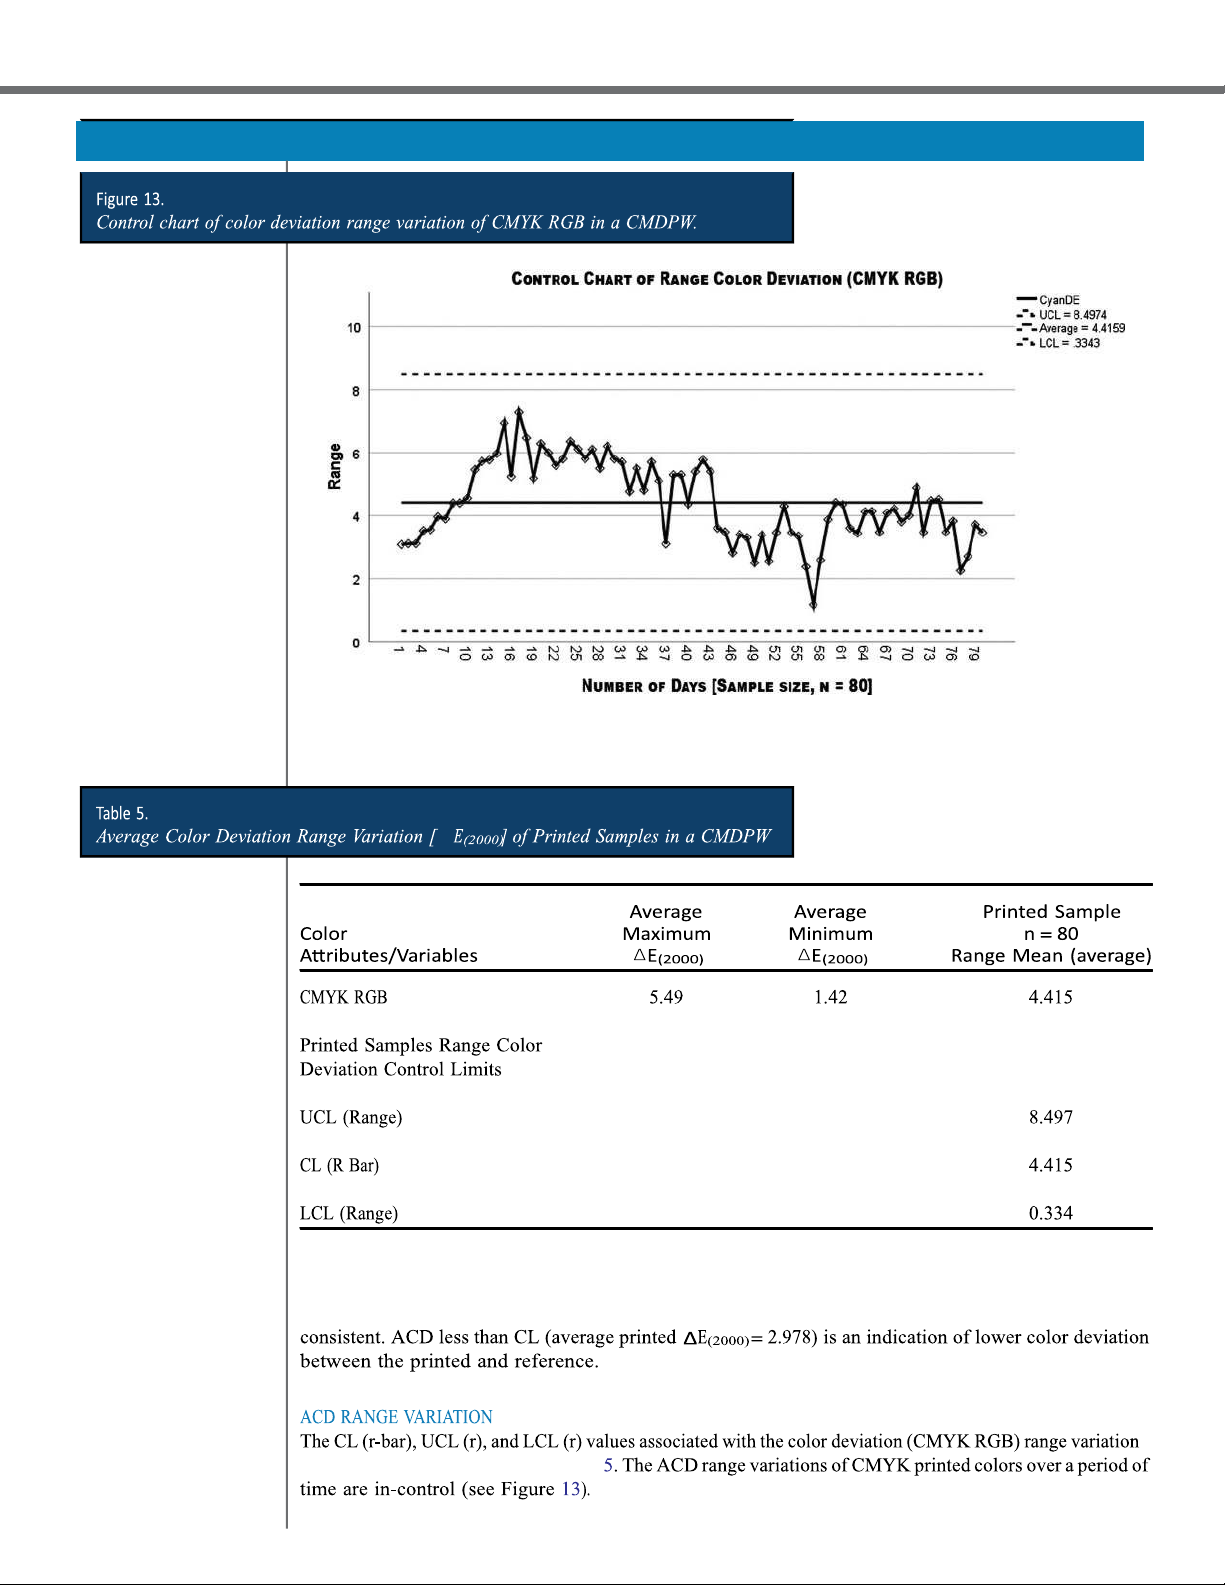
Printed Samples Average Color Deviation Control Limits lOMoAR cPSD| 58583460 OCT-DEC 2023
The Journal of Technology, Management, and Applied Engineering Δ
closely along the CL line (within the CLs) or below the CL indicating the ACD of the process was very
of the CMDPW are compiled in Table
Tài liệu liên quan:
-
Cảm biến đa tham số trong hệ thống báo cháy môn Công nghệ cảm biến | Trường Đại học Sư phạm Kỹ thuật Thành phố Hồ Chí Minh
38 19 -

Báo cáo Chương 19: Cảm biến Đo Biến Dạng (Strain Gages) | Môn Công nghệ cảm biến - Đại học Sư phạm Kỹ thuật Thành phố Hồ Chí Minh
164 82 -

Chapter 8: Hydraulic Systems Overview and Applications | Môn Công nghệ cảm biến - Đại học Sư phạm Kỹ thuật Thành phố Hồ Chí Minh
132 66 -

Đề tài Báo cáo Môn Công Nghệ Cảm Biến - Chi Tiết Các Chương 4 - 10 | Môn Công nghệ cảm biến - Đại học Sư phạm Kỹ thuật Thành phố Hồ Chí Minh
158 79