Group Assignment Guidelines for IS233 | Vật lý | Đại học Lâm nghiệp
Formulate a business. Group Assignment Guidelines for IS233 | Vật lý | Đại học Lâm nghiệp. Tài liệu sưu tầm gồm 2 trang, giúp bạn tham khảo, ôn tập và đạt kết quả cao.
Môn: Vật lý đại cương(VLDC) 12 tài liệu
Trường: Trường Đại học Lâm nghiệp 286 tài liệu
Tác giả:

Preview text:
lOMoARcPSD| 59629529
GUIDELINES FOR GROUP ASSIGNMENT IS233
I- Formulate a business problem statement
Development of a Database Application System
For Management Of Sales at Elise Store
II- Design a database to solve the problem
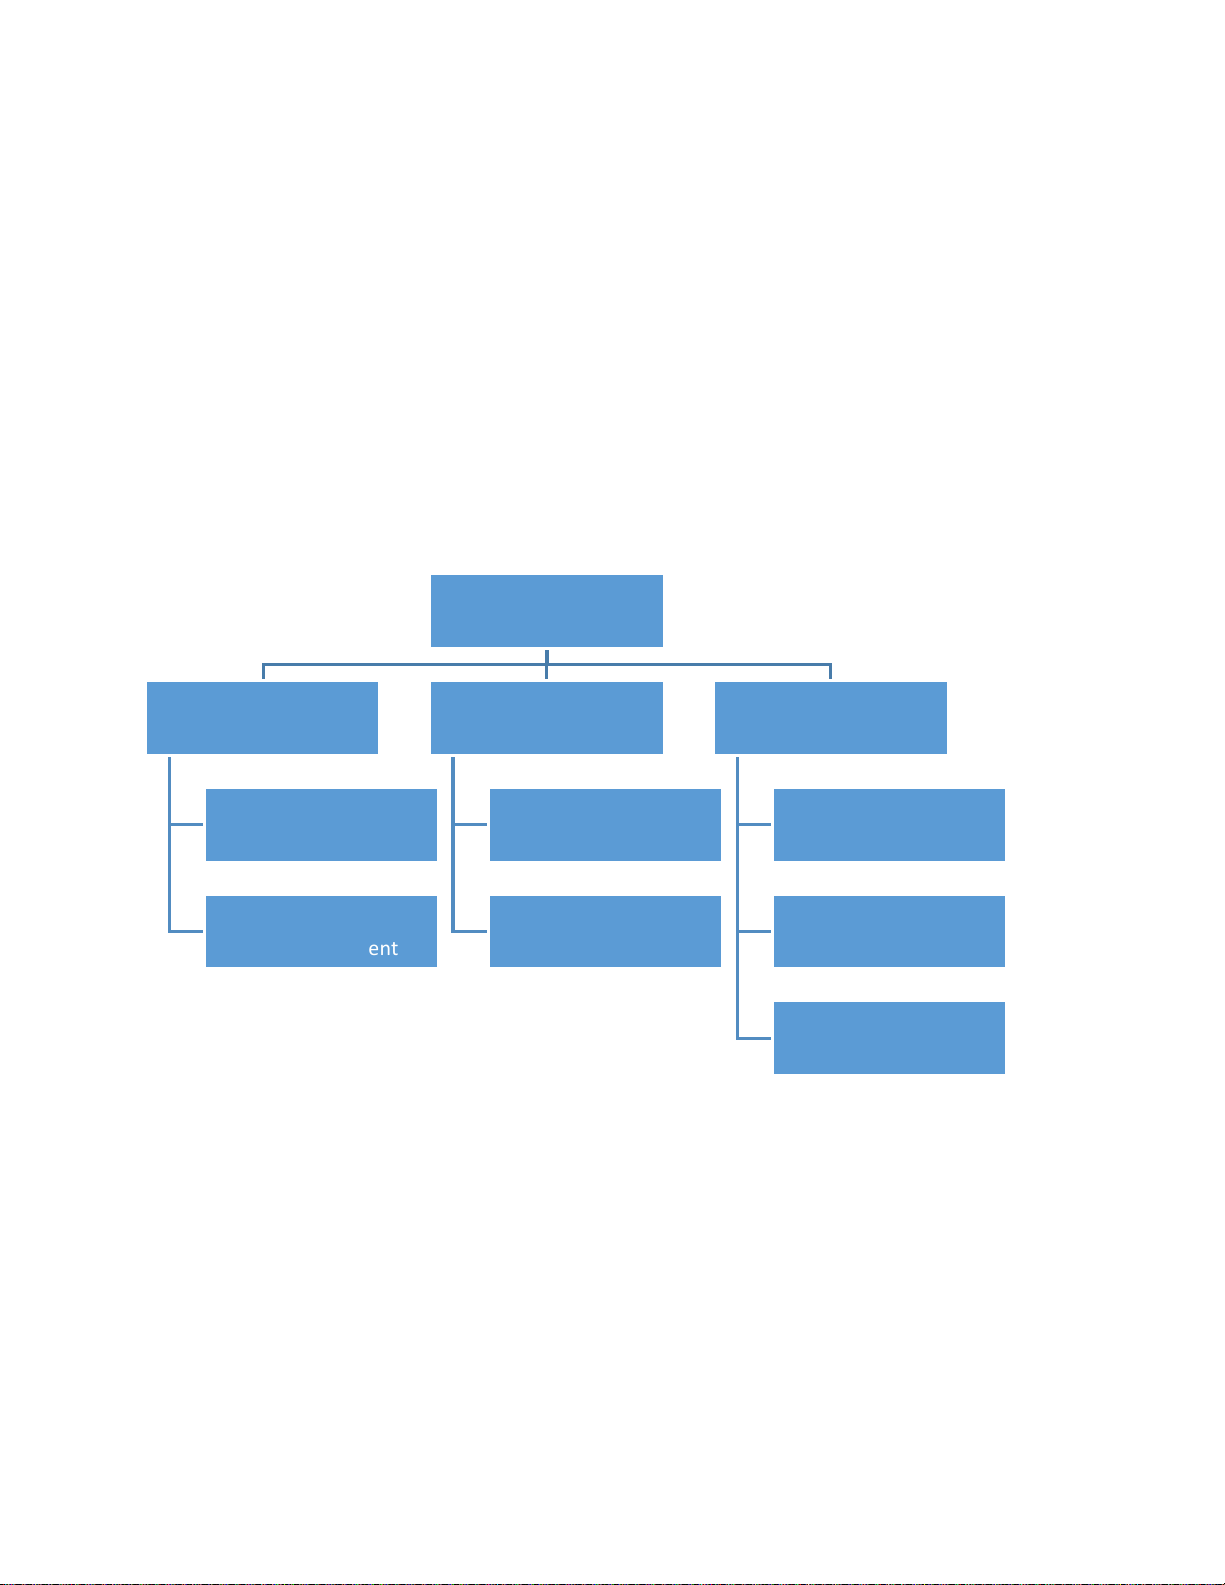
a. Build a Business Function Diagram (BFD) Sales Management Classification Transaction Reporting Management Management Information Custome r Good Sol d Request Managem ent Managem ent Determination Product Good Retur ned Data Access and Managem ent Managem ent Processing Report Building
b.Build a Data Structure Diagram (DSD) • Table 1: Good Management • Table 2: Customer Management • Table 3: Good Sold Management •
Table 4: Good Returrned Management (optional) 1 lOMoAR cPSD| 59629529
III- Implement the database on MS Excel
Enter operational data into the three/ or four designed tables
IV- Produce/ Extract information
Use SubTotal and PivotTable to
process data (information production)
V- Visualize extracted information
Create some charts to represent
information created in step III (the use of
different types of charts is strongly recommended) Notes
- Files to submit: 01 file Excel + 01 file PowerPoint 2
Tài liệu liên quan:
-
Câu hỏi trắc nghiệm chương-3-4-động lực học | Vật lý đại cương
23 12 -
Trắc nghiệm chương 1 - 2 Động học chất điểm | Vật lý đại cương
22 11 -
Final Exam Summary for 20230822 | Vật lý | Đại học Lâm nghiệp
155 78 -
Doanh thu - nothing | Vật lý | Đại học Lâm nghiệp
149 75 -
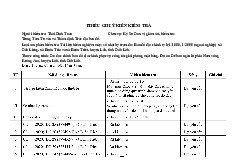
Phiếu Ghi Ý Kiến Kiểm Tra Bản Đồ Ngoại Nghiệp | Vật lý | Đại học Lâm nghiệp
145 73