Nucet article 54003 en 1
Nucet article 54003 en 1
Môn: Du lịch và cuộc sống (DLCS204) 13 tài liệu
Trường: Trường Cao đẳng Du lịch Sài Gòn 77 tài liệu
Tác giả:


Preview text:
lOMoAR cPSD| 36238895
Nuclear Energy and Technology 6(3): 181–194 DOI 10.3897/nucet.6.54003 Research Article
Assessment of costs of nuclear power in Bangladesh
Islam Md. Shafiqul1, Tanvir Hassan Bhuiyan1
1 Department of Nuclear Engineering, University of Dhaka, Dhaka-1000, Bangladesh
Corresponding author: Islam Md. Sha昀椀qul (msislam@du.ac.bd)
Academic editor: Giorgio Locatelli Received 7 May 2020 Accepted 17 September 2020 Published 6 November 2020
Citation: Islam MS, Bhuiyan TH (2020) Assessment of costs of nuclear power in Bangladesh. Nuclear Energy and Technology 6(3):
181–194. https://doi.org/10.3897/nucet.6.54003 Abstract
Financing and economic risks are two of the major challenges facing by the nuclear industry today for the construction
of a new build Gen III+ or an advanced Gen IV nuclear power plant (NPP). Prediction of economics and 昀椀nancial
aspects of an NPP always remains uncertain as these are heavily dependent on investment costs, construction time,
licensing and regulation, operation and maintenance (O&M) costs, fuel costs, 昀椀nancing costs, plant capacity factor
(PCF), etc. Such uncertainty in accurately predicting the risk of 昀椀nancing and economics limits the growth of the
nuclear industry. Furthermore, global high-trend construction costs of NPPs lack con昀椀dence amongst manufacturers
and builders. This paper attempts for modeling the costs of the twin under construction VVER-1200 model Gen III+
reactors at Rooppur in Bangladesh based on techno-economic and 昀椀nancial data, and some assumptions. To calculate
the levelized unit electricity cost (LUEC), net present value (NPV), internal rate of return (IRR), and payback period
(PBP), nine scenarios are modeled in the FINPLAN modeling tool given the plant technical data, investment costs,
昀椀nancial terms & conditions, global benchmarked operation & maintenance (O&M) costs and fuel costs, PCFs of
50–90%, and a 昀椀xed discount rate of 10%. The study 昀椀nds that the estimations of LUECs of the Rooppur NPP project
are in the range of 43.8–82.5 $/MWh of which are lower than for coal, oil, and renewable energy sources. The annual
rate of return of the project is found in the range of 13–20%. The PBP is within 7–8 years after the start of commercial
operation. Cost sensitivity analysis is performed by taking a large variation of O&M costs, fuel costs, and PCFs. The
results show favorable economic situations with regard to the country’s other power sources and are expected to be
competitive with global NPPs projects. Only the competitive NPP projects can contribute to a sustainable economic,
social, environmental, scienti昀椀c, and technological developments for both NPP importing and exporting countries. Keywords
Economic and 昀椀nancial indicators, Rooppur NPP project, VVER-1200 Gen III+ reactor, LUEC, Cost sensitivity, Cost competitiveness 1. Introduction
electricity and its uninterrupted power supply is the pre-
requisite for ensuring accelerated economic growth. To
Bangladesh aims to be a middle income and developed
keep pace with the current development growth, demand
country by 2030. In the last decade, the country has made
for electricity is found to be increasing at a rate of 10%
remarkable progress in the socio-economic develop-
each year (Bazlul and Iftekher 2017). The Power System
ment with an average 6.5% annual gross domestic pro-
Master Plan (PSMP) of the Ministry of Power, Energy,
duct growth rate (WB 2020). However, the generation of
and Mineral Resources is the roadmap of the country’s
Copyright Islam MS, Bhuiyan TH. This is an open access article distributed under the terms of the Creative Commons Attribution License (CC-BY 4.0), which
permits unrestricted use, distribution, and reproduction in any medium, provided the original author and source are credited. lOMoAR cPSD| 36238895 182
Islam MS & Bhuiyan TH: Assessment of costs of nuclear power in Bangladesh
power and energy development strategy. According to
WNA 2017). However, some other studies show that con-
the PSMP (2016), Bangladesh has planned to increase
struction of an NPP is a risky venture and will get lost
its power generation from 22GW to 60GW within 2041.
with alternatives if constructions delays, cost overruns,
Currently, Bangladesh’s power generation mix relies on regulatory uncertainty, poor performance (fuel cycles)
domestic gas (62%) which has a reserve for only 10–15
unregulated power market, and accidents are not properly
years at the current consumption rate, oil (29.8%), a
addressed (Thomas et al. 2007, Ishrak 2015a). In order to
small portion of renewables including hydro (1.75%),
be cost-competitive, construction costs and time of NPPs
coal (1.9%), and imported electricity (4.55%) from India
should be cut at least 25% from the existing estimates
(BPDB 2018–2019, Huq et al. 2018). Considering future
(MIT 2003). No scholarly articles are found focusing on
energy security for more industrialization, rapid econo-
economic and 昀椀nancial analyses against a particular NPP
mic growth, and global commitments towards sustaina-
project. To the authors’ knowledge, a few comprehensi-
ble development goals, PSMP (2016) has adopted a fuel
ve reports on the economic aspects of NPP projects are
diversi昀椀cation policy, including imported coal, lique昀椀ed
available online; for example Hungary, and Belarus (Paks
natural gas (LNG), and nuclear fuel. As the prospects of
II 2015, IAEA/INPRO 2013). It is imperative to study the
renewable energy technology are limited, the country’s economic and 昀椀nancial feasibility of an NPP project to
future energy security will primarily rely on coal, LNG, perceive its potential risk. and nuclear-based plants.
The 昀椀nancial and economic viability of the country’s
The idea of a nuclear power program for Bangladesh 昀椀rst NPP has constantly been under scrutiny by resear-
has a long history dating back to 1961. Pakistan Atomic chers, policymakers, and society. Part of the society is
Energy Commission had selected the Rooppur site, 160 constantly pressing the government to stop construction
km away from the capital Dhaka of Bangladesh in 1963 of the Rooppur NPP as it needs high capital investment,
out of 20 possible sites. During the 1960s, several inter- intensive infrastructure, and brings expensive unit elec-
national companies conducted feasibility studies but all tricity cost with respect to other available power sour-
the initiatives went in vein due to political unrest. After ces (Rahman, 2016a; Ishrak, 2015a). However, no such
the independence in 1971, the implementation of an NPP elaborative studies are available publicly in this regard
got stuck until 2009 due to the lack of funds and politi- except a few limited ones. Sieed et al. (2015) calculate
cal will. The prevailing power de昀椀cit across the country
the LUEC of 9.48 cents/kWh by considering overnight
compelled the government to take a 昀椀rm political decision
construction costs of 5000$/kWe, plant lifetime 60-year,
for reviving the Rooppur NPP project in 2009 (Ashraf and and PCF of 90% using INPRO methodology. They also Islam 2018, Akbar 2017).
昀椀nd that LUEC from nuclear power is a bit higher than
In 2011, Bangladesh signed an intergovernmental
the gas and coal-based power plants. Their economic
agreement (IGA) with the Russian Federation for the
feasibility studies 昀椀nd supportive towards the viability of
construction of the necessary infrastructure for the coun-
the project in terms of long-term economic contributions.
try’s 昀椀rst NPP at Rooppur site consisting of two VVER While Rahman (2016) in his hand calculation conside-
type nuclear reactors (IGA 2011). Subsequent to the
ring total capital costs including the costs of pre-project
IGA and the general contract agreements, Russian State
activities of 13.20 billion USD with a 4% simple interest
Atomic Energy Corporation-Rosatom and Bangladesh
rate for 28-year repayment period, 昀椀xed O&M costs of
Atomic Energy Commission signed a 昀椀nancial contract
0.2$/MWe-yr, variable O&M costs of 2.4$/MWh, fuel
in 2015 with amounts to the United States Dollar (USD)
costs of 0.62 cents/kWh, decommissioning costs of 1.5
12.65 billion for the design, construction, and supply of billion USD, PCFs of 65–85%, and a plant economic li-
twin VVER-1200 model Gen III+ nuclear reactors with fetime of 60-year shows that LUECs at ideal to realistic
1200MWe electric capacity each, including the 昀椀rst few conditions are found as 9 and 12 cents/kWh respecti-
years’ fresh fuel supply with Russia 昀椀nancing 90% of vely. He also argues that the project is costly compared
the total investment cost at an interest rate of libor plus to other power generating sources. Bazlul and Iftekher
1.75%, capped at 4%, repayable in 28 years with 10 years’ (2017) conduct 昀椀nancial and economic feasibility studies
grace period (WNA 2020). As O&M costs, fuel costs, and of the project by considering only one set of optimistic
other costs are related to the reactor startup, these are not parameters, such as a PCF of 93%, a plant lifetime of 50-
included in the general contract/agreements. NPPs requi- year, and a discount rate of 5%. They assume the LUEC
re high investment, intensive infrastructure, and lead to of 3.5 cents/kWh for 昀椀nding the bene昀椀t-cost ratio and
skepticism with regard to 昀椀nancial and economic viabili- other social and economic aspects of the project. Amimul
ty. The cost of electricity produced by an NPP should be et al. (2014) describe the necessity of the Rooppur NPP
competitive against gas, coal, and oil-昀椀red power plants.
project with its basic safety, security, and waste manage-
Most of the studies 昀椀nd that operating NPPs have ack-
ment features of the selected modern VVER-1200 model
nowledged cost-competitive with other alternatives. The
nuclear reactor technology without touching the econo-
reasons behind cost-competitive are due to low O&M mic aspects of the project.
costs, fuel costs, high production rate, long economic li-
This paper di昀昀ers from the existing literature, because
fetime, and low CO2 emission electricity supply (Locatel-
nobody has made a detailed cost-economic analysis con-
li and Mancini 2010, Carelli 2010, Lovering et al. 2016,
sidering the lifecycle costs of the country’s 昀椀rst NPP pro- lOMoAR cPSD| 36238895
Nuclear Energy and Technology 6(3): 181–194 183
ject so far, or at least the authors could not 昀椀nd any that
pect that nuclear can be a good option for maintaining a
would have been publicly available. This paper 昀椀lls this
steady electricity price. Ishraq (2015b) raises the question
gap in knowledge estimating the NPV, IRR, and LUEC
of whether it is worthy to spend huge money and take
under di昀昀erent postulated scenarios for depicting the 昀椀-
environmental risks to build the Rooppur NPP for genera-
nancial and economic aspects of the Rooppur NPP pro-
ting only 5% electricity to the national grid. Sakib (2015)
ject. The calculated cost-economic analyses could be used
studies support the Rooppur NPP project although it is
as a basis for whether the nuclear is more/less expensive
a much-talked issue in the country. Alam et al. (2019)
than a baseload gas or a coal-昀椀red plant.
emphasize the necessity for the construction of NPPs as
Furthermore, the 昀椀ndings are compared with the cost an alternative to fossil fuels for energy security and the
data of the global operating as well as under constructi- socio-economic development of the countries. Ahmed
on similar NPPs and give con昀椀dence in building modern (2014) advocates, Bangladesh should go nuclear for her
large size Gen III/III+ reactors economically. In order to energy security and sustainable development. Mollah et
calculate the NPV, IRR, and LUEC parameters, the stu- al. (2015) rationalize the government’s decision for the
dy explores investment costs and its terms & conditions, implementation of the Rooppur NPP project to optimize
O&M costs, fuel costs, PCF, and decommissioning costs the country’s energy mix to get rid of the chronic power
including waste management at the end of its economic crisis. Saha et al. (2018) give logical explanations for the
lifecycle (WNA 2020, Paks II 2015). The study uses the development of a nuclear power program in Bangladesh
FINPLAN modeling tool which is developed by the In- and expecting a successful implementation of the Roop-
ternational Atomic Energy Agency (IAEA) to clarify the pur NPP project. Matin (2015) estimates 4,875 $/kWe as
feasibility of electricity generation projects by compu- probable capital costs of the VVER-1200 model Gen III
ting important 昀椀nancial and economic indicators (IAEA reactor for the Rooppur NPP project and compares with
2009). Further details on the FINPLAN modeling tool can the costs of the global NPPs. He claims that this could
be found in Section 4.1. The rest of the paper is structured be a high capital cost in comparison with the similar mo-
as follows: section 2 presents the literature review; section del reactors to be built in Belarus, Turkey, China, India,
3 describes the indicators of economic and 昀椀nancial per- and Vietnam. Rahman (2016b) criticizes the government
formances of NPPs; section 4 provides a brief introducti- for frequent change in 昀椀xing the total price tag from $2
on to FINPLAN modeling tool and input data; section 5 billion to $12.65 billion between the VVER-1000 and
narrates the results and discussion based on nine postula- 1200 model reactors. Although the government has 昀椀xed
ted scenarios and 昀椀nally, section 6 concludes the paper.
the $12.65 billion capital cost of the 2400MWe capacity
VVER-1200 model twin reactors, he says, “the sky is the
limit for the 昀椀nal cost”. 2. Literature review
Bangladesh power development board (BPDB) is the
only government electric utility, who is the single buyer to
In the PSMP-2010, it was then decided that 10% of the
purchase electricity from other public and private utilities.
total electricity generation will come from NPPs by 2021
The price of electricity depends on not only the type of
and 2030, which are 2000MWe and 4000MWe respecti-
fuel but also the type of utility such as public or priva-
vely. However, in the new PSMP-2016, goals for power
te, or imported ones. The country has only one govern-
generation from NPPs remain the same as in the PSMP-
ment-owned power transmission company. The electrici-
2010. Due to the depletion of domestic gas reserves and
ty to be generated from the Rooppur NPP will be sold to
no discovery of new gas 昀椀elds as of August 2020, impor- the BPDB.
ted LNG, coal, and nuclear are considered three of the
Barkatullah and Ahmed (2017) investigate the existing
best options for baseload electricity generation for future
challenges to 昀椀nance NPPs and 昀椀nd no such unique mo-
energy security, environmental protection, and sustaina-
del. Historical record of construction costs, past success
ble economy. According to the PSMP-2016, the gover-
and failure experiences teach us that the projected average
nment plans to add 2,400MWe electricity from NPPs at
lifecycle costs of electricity are always underestimating
Rooppur (unit 3 & 4), and another 2400MWe electricity
than the real cost scenarios. High investment costs should
from a new NPP site in the southern part of the country.
be considered in 昀椀nancial and economic studies (Hultman
Rooppur NPP is the largest project ever undertaken by et al. 2007).
the country in terms of cost, infrastructure, technical com-
Construction of some modern reactors are abandoned
plexity, and risk pro昀椀le. Some mixed reactions are found
or much delayed from the schedule due to cost overruns.
from scholarly articles about the feasibility of the Roop-
Olkiluoto-3 plant in Finland was thought to have consi- pur NPP project.
dered a creative 昀椀nancing model, is now su昀昀ering from
Reza et al. (2014) raise the question about the a昀昀orda-
both cost overruns and construction delays (IAEA 2018).
bility of the rapid increase in electricity generation costs
Generation costs depend on country speci昀椀c, region spe-
with gas, oil, coal, and renewables. Considering public
ci昀椀c, size of a reactor, era, experience, and safety features
a昀昀ordability and to gain public popularity, the govern-
(Lovering et al. 2016). People may think that today’s mo-
ment provides a substantial amount of subsidies every
dern large light water reactors (Gen III/III+) can be built
year to the electricity generation companies. They ex-
more cheaply. Meanwhile, some other people may also lOMoAR cPSD| 36238895 184
Islam MS & Bhuiyan TH: Assessment of costs of nuclear power in Bangladesh
think, small modular reactors will be more promising in
factor to estimate the NPV and IRR accurately. Early on,
cost economics. However, these are two sides of the same
low O&M costs used to be considered in nuclear econo-
coin (Mignacca and Locatelli 2020, Boarin et al. 2017, Lo-
mics. But this assumption was proven wrong in the late
catelli and Mancini 2010, Carelli et al. 2010). Krautmann
1980s and early 1990s when a small number of US NPPs
and Solow (1988) realize that predicting the economics of
were retired for the high O&M costs compared with gas
the future nuclear industry is extremely risky. They 昀椀nd
power plants (EIA 1994). This happened due to the rise
that large size reactors do not guarantee much output in
of uranium prices in the global market. For economic
the long run cost function. However, constructions of mul-
analysis, O&M costs can be assumed from the OECD/
tiple units at a single site are economically attractive. De-
NEA (2005, 2015) or globally benchmarked data (Paks
spite the construction costs going up a substantial amount
II 2015). O&M costs vary with country speci昀椀c, region
due to the Three Mile Island, Chernobyl, and Fukushima
speci昀椀c, size of a reactor, e昀케ciency of the plant, safety
accidents as well as bankruptcy & restructuring of giant
features, and its major components comprising sta昀昀 costs,
nuclear companies, 4 newcomers i.e. Bangladesh, Belarus,
material costs, contractor services, and taxes, etc. It owes
Turkey, and United Arab Emirates have broken ground on
about 15% of the lifecycle costs (IAEA 2017).
new reactors out of 54 reactors under construction in 19
countries (IAEA/PRIS 2020). However, about 30 newco- 3.3 Fuel costs
mer countries especially in the developing world are acti-
vely considering building NPPs (WNA 2020).
The fuel cost refers to mining, conversion, enrichment,
and fabrication, which is called the front-end fuel cycle.
Most of the NPPs operating countries do not have their
3. Economic and financial
own fuel cycle capabilities. The Aszódi report (2014) performances of NPPs
mentions fuel costs as one of the key variable costs in
the formulation of the project’s LUEC and it is about
15% of the lifecycle costs (IAEA 2017). Fuel costs can
Before discussing the economic and 昀椀nancial performan-
be assumed from the globally benchmarked data. Alt-
ces of NPPs, it is relevant to di昀昀erentiate between econo-
hough the LUEC values of NPPs are relatively insen-
mic and 昀椀nancial studies. Economic studies focus on the
sitive to changes in fuel prices as it is almost stable in
e昀케ciency in production, distribution, and consumption of
the international market compared with fossil fuels. A
goods and services, taxes, in昀氀ation, exchange rates, costs,
strategic approach needs to be developed for a fuel cycle
prices, etc (Zweifel et al. 2017). LUEC is a common indi-
policy. In order to have a more competitive and secured
cator used in economic studies. The economic studies do
fuel supply management, an owner-operator can contract
not consider debt or equity. On the other hand, 昀椀nancial
with multiple vendors and of course need to be made
studies are based on the management of funds, 昀椀nancial long term agreements.
resources, debt, equity, risks, etc. NPV, IRR, and PBP are
the common indicators used in 昀椀nancial studies (Brigham
3.4 Decommissioning including waste management costs
and Ehrhardt 2011, Besley and Brigham 2016). Here is
given a brief purview of these indicators.
The decommissioning costs include all costs related to
the plant’s shutdown to the dismantling of nuclear and 3.1 Investment costs
non-nuclear structures, systems, and components phase
by phase. It also includes radioactive waste management
Construction of an NPP is highly capital intensive and
and disposal including spent fuels that will arise during
have a long construction period. Investment costs inclu-
the operation lifetime and dismantling of the plant after its
de cost of site preparation, construction, manufacture,
service life. According to the World Nuclear Association
and commissioning of reactors. Fixing investment costs
data, the decommissioning cost is assumed to be about
mainly depend on site characteristics, type of technology
9–15% of the total capital cost of an NPP (OECD/NEA
with safety features, manpower, materials, regulatory re-
2016). The plant owner has to accumulate this decommis-
quirements, and localization of technology. It is the major
sioning fund during plant operation.
percentage (70%) of the lifecycle costs of an NPP and ma-
jor decision making matrices for taking a project by the
3.5 Levelized unit electricity cost (LUEC)
policymakers. The cost of capital of an NPP is a function
of the 昀椀nancial risk associated with the project investment
The LUEC/levelized cost of electricity (LCOE) is equi-
(Carelli and Ingersoll 2014, Barkatullah and Ahmed 2011,
valent to the generation costs of electricity at the plant Xoubi 2019, IAEA 2017).
level that would have to be paid by the consumers to
repay exactly all costs for investment, year-wise O&M
3.2 Operation & Maintenance (O&M) costs
costs, fuel costs, and decommissioning costs with a pro-
per discount rate and without considering pro昀椀ts. It can
O&M activities refer to the day-to-day operations of the
be said in another way that LUEC is the minimum aver-
plant. The assumption of O&M costs is a very important
age busbar costs/selling price in which an owner-operator lOMoAR cPSD| 36238895
Nuclear Energy and Technology 6(3): 181–194 185
would precisely break-even on the project after paying
3.8 Net present value (NPV)
all necessary expenses over its operating lifetime. This
economic indicator is called a lifecycle costs of an NPP
The NPV is the di昀昀erence between the present value of net
and is expressed in energy currency ($/kWh) (Mignacca
cash in昀氀ow(revenues) and net cash out昀氀ow (expenditu-
and Locatelli 2020). Equation (1) can be used to calculate
res). It is used in capital budgeting to analyze the pro昀椀tabi-
the LUEC without considering the cost of carbon (IAEA/
lity of an investment or project and is expressed in [$]. For NES 2018).
an investment project, raising the discount rate tends to
reduce the NPV. This parameter is multiplication between
Lifetime Investment cost O M cost Fuel cost Decommissioning cost t t t t (1)
net cash 昀氀ow and discount factor (Mignacca and Locatelli, t tc (1+r)t LUEC Lifetime
Annual electricity generation
2020). Equation (2) can be used to calculate the NPV; ( ) t 1 (1+r t
Where t; the expected lifetime of the plant (year); T C NPV t C
t : the duration of construction (year); c t 1 (1 r)t o (2) r: annual discount rate (%);
Annual electricity generation in MWh
Where, C = net cash 昀氀ow during the periods ($) t, C = t o
Here it is worthy to note that LUEC is not a complete
total initial investment costs ($), r = discount rate, (1+r)t =
and absolute method of assessing the economic bene昀椀ts
discount factor, and t = number of time periods.
of an electricity generating source because it excludes the
NPV is used as an indicator for viability of a project
true re昀氀ection of market realities and network costs of a as follow;
power system. In the case of nuclear power generation,
NPV = positive value (+), Project feasible /can be ac-
the LUEC is strongly dependent on investment costs, cepted, higher NPV is better;
O&M costs, and fuel costs (Lovering et al. 2016, Barka-
NPV = negative value (-), Project not feasible /cannot
tullah 2011, Mignacca and Locatelli 2020). be accepted;
NPV = zero (0), neutral value/break-even (no pro昀椀t or 3.6 Discount rate no loss).
The discount rate is possibly one of the most critical para-
3.9 Internal rate of return (IRR)
meters of the economic and 昀椀nancial analyses of a power
generating plant. It varies by country, technology, and 昀椀-
The IRR is the discount rate at which the NPV of net cash
nance speci昀椀cs. LUEC is sensitive to change in the dis-
昀氀ow (both positive or negative) from a project or invest-
count rate i.e. the interest rate used to calculate the present
ment equals to zero. It is also used to evaluate the viability
value of future cash 昀氀ows. The choice of the discount rate
of a project or investment and is expressed in dimension-
depends on a number of factors such as, competitors, po-
less indicator [%]. When the IRR of a new project exceeds
wer market policy, and investor (who determine the requi-
its required rate of return, the project is desirable. On the
red rate of return). In many review studies, the discount
other hand, if IRR falls below the required rate of return,
rate was arbitrarily chosen as 5% and 10% (Larsson,
the project is not 昀椀nancially desirable (Mignacca and Lo-
2014). British economist Dimson (1989) shows in his stu-
catelli, 2020). IRR can be calculated using Equation (3).
dy that the discount rate for a new NPP after tax should
be 11%. In an open electricity market, building and ope- C C C C t 3 tn
rating an NPP is risky as cost recovery is not guaranteed.
NPV 0 C 0 t1 t 2 2 1 3 n (3)
(1 IRR) (1 IRR) (1 IRR) (1 IRR)
In this context, for evaluating an NPP project pro昀椀tabili-
ty, the energy information administration (EIA)/USDOE
Where C = total initial investment costs ($), C , ... 0 t1
(1994) is proposed to take a discount rate of 10% in real
C equals the net cash 昀氀ow during the periods 1, 2, 3, ... tn
terms (the 3% risk-free return plus a 7% risk premium) n, respectively. (IAEA/NES 2018).
Feasibility criteria of IRR gives indication as follow;
IRR > wanted discount rate (r), project feasible /ac-
3.7 Plant capacity factor (PCF) cepted;
IRR < wanted discount rate (r), project not feasible /
Uncertainty between the plant’s idealized and realized not accepted;
capacity factor is a very important issue for economic
IRR = wanted discount rate (r), project not feasible /
and 昀椀nancial analyses of an NPP project (Yangbo and not accepted.
John, 2010). It indicates the operating performance of
a plant under many O&M challenges. Usually, a plant
3.10 Payback period (PBP)
running at a higher PCF incurs a lower unit production
cost compared to a plant running at a lower PCF. The
The PBP is a duration needed to return the investment
global average PCF for NPPs is about 85% (Paks II,
cost, which is calculated from net cash 昀氀ow. Net cash
205). However, it took much e昀昀ort to achieve such a
昀氀ow is a di昀昀erence between the revenue and expenditures high average PCF.
every year. PBP is an indicator of how many years are lOMoAR cPSD| 36238895 186
Islam MS & Bhuiyan TH: Assessment of costs of nuclear power in Bangladesh
needed for the project to cover the total investment costs.
Equation (4) can be used to calculate the PBP. t PBP B C (4) t 1 0
Where t = time (yr), PBP = Payback period (yr), B= bene- 昀椀
t of pro昀椀t ($), C0 = total investment costs ($)
If the projects were constructed within the 5–6 years,
the payback period would be usually within 7–9 years (Paks II 2015).
Now it is understood from the theoretical discussions
Figure 1. Data processing systems.
that the LUEC, NPV, IRR, and PBP indicators are used to
昀椀nd out the competitiveness of an NPP project with other time, and PCF. Economic parameters referred to revenues,
power generating sources in order to ensure the pro昀椀ta-
expenditures, in昀氀ation, exchange rates, taxes, etc. Financial
bility. Kharitonov and Kosterin (2017) develop analytical
parameters included credits, loans, bonds, and equity, etc.
relationships between the investment performance criteria
Figure 1 shows how the FINPLAN modeling tool converts
(LUEC, NPV, IRR, discounted PBP, discounted costs) and
from input into output parameters for each year.
basic engineering - economic parameters (capital costs,
The model provides outputs as cash 昀氀ows, balance
annual operating costs, annual revenue, construction dura-
sheet, 昀椀nancial ratios, NPV, IRR, etc. Foreign currency,
tion, operating lifetime) of an NPP for measuring the pro-
exchange rate, and in昀氀ation rate were considered as the
昀椀tability and competitiveness at the microeconomic level. important parameters in 昀椀nancial analysis. As such, the
OECD/NEA (2007) predicts the LUECs and other 昀椀-
FINPLAN modeling tool allows options for considering
nancial risks of the Gen IV reactors with other energy sour-
one or multiple foreign currencies in the 昀椀nancial analy-
ces and 昀椀nds highly competitive in the international energy
sis. In the data on a product sale/purchase, the FINPLAN
markets. Lucheroni and Mari (2014) suggest careful use of
modeling tool needed the number of units of electrical
LCOE when someone estimates the performances of the
energy to be sold per annum and the unit electricity selling
lifecycle costs of a new NPP and compare it with other po-
price data over the plant’s economic lifetime. Nine di昀昀e-
wer sources as these are not homogeneous in nature. LCOE
rent postulated scenarios were created for the calculation
value for NPPs works as an asset to reduce the dynamics of
of 昀椀nancial and economic analysis of the Rooppur NPP
fossil fuels and carbon prices in the volatile power markets
project. Based on the 昀椀xed cost 昀椀nancial contract, plant
(Mari, 2014). While calculating the LUEC, NPV, and IRR
data, general data, and some assumptions on O&M costs,
for modeling the economics of a new NPP, these indicators
fuel costs, decommissioning costs, and PCFs, etc. LUEC,
are found to be heavily dependent on realized input data.
NPV, IRR, and PBP were calculated for each case study.
Winkler and Streit (2008) 昀椀nd the economic pro昀椀tability
of the three NPP projects at Beznau, Muhlenberg, and Nie-
4.2 Technical, economic, and 昀椀nancial data
deramt in Switzerland. The LUEC of the Swiss operating
NPPs is about 2.4 cents/kWh. IAEA/INPRO (2013) 昀椀nds
Nine case studies were modeled based on the plant’s
the economic viability of the Belarus NPP project by eva-
technical, economic, 昀椀nancial data, and a few assumpti-
luating the LUEC, IRR, return of investment, and invest-
ons for calculating the 昀椀nancial and economic aspects of
ment volume indicators. Paks II NPP project of Hungary
the Rooppur NPP project. In this regard, Table 1 shows
is also found economically viable by evaluating LCOE,
a summary of some key plant technical, 昀椀nancial, and
NPV, IRR, and PBP parameters (Paks II 2015).
economic input data. Brief descriptions of these data are
given in the following sections.
4. Calculation tool and input data 4.2.1 Plant technical data 4.1 FINPLAN model
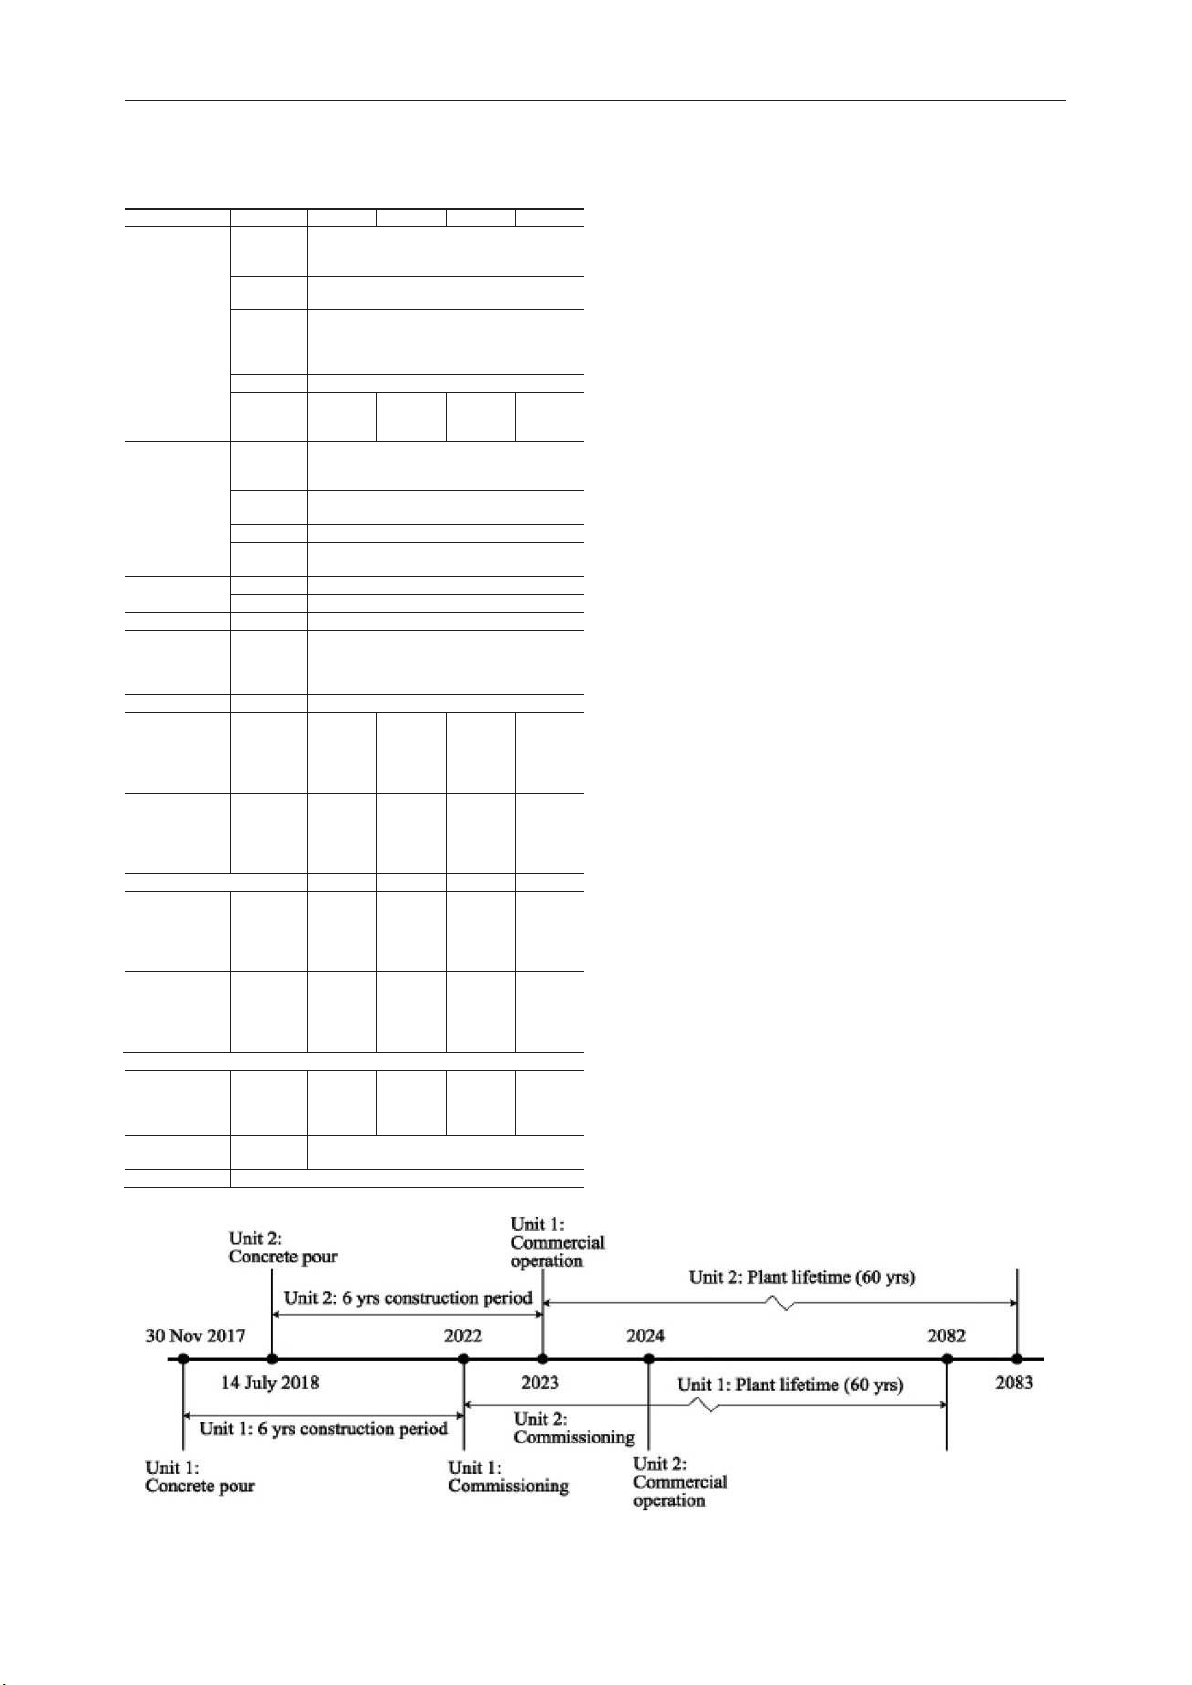
According to Table 1 and Figure 2, the Rooppur NPP pro-
ject comprises the twin unit of VVER-1200 model reac-
The model for Financial Analysis of Electric Sector Expan-
tors with 1200MWe electric capacity each. In this calcu-
sion Plans (FINPLAN) is a world-wide recognized 昀椀nancial
lation, the construction time was taken as 6-year while the
modeling tool, which is used for 昀椀nancial analysis of elec-
plant economic lifetime was considered as 60-year. The
tricity generation projects (IAEA 2009). Inputs for the FIN-
昀椀rst commercial operations of both units are expected to
PLAN modeling tool were divided into four headings; cost
be in 2023 and 2024 respectively.
related data, technical data, economic and 昀椀scal parameters,
The construction, commissioning, and commercial
and 昀椀nancial data. Cost-related data included investments,
operation schedule of the unit-1 and unit-2 of VVER-
O&M costs, fuel costs, and decommissioning costs. Tech-
1200MWe capacity of each reactor are shown in Figure
nical data involved plant’s power generation capacity, con-
2. Schedule test operation of the unit-1 is going to be held
struction period, commercial operational year, plant life-
in 2022 and the unit-2 in the later year. The nuclear power lOMoAR cPSD| 36238895
Nuclear Energy and Technology 6(3): 181–194 187
Table 1. Some key plant technical, economic, and 昀椀nancial data
company of Bangladesh limited is a public limited one
at nine di昀昀erent postulated cases considering low and high val-
who is the operator of the Rooppur NPP.
ues of O&M costs and fuel costs (WNA 2020, Paks II 2015). Item Variable Case-1 Case-2 Case-3 Case-4
4.2.2 Economic and 昀椀nancial data Plant technical Unit- wise 1200MW × 2 unit = 2400MWe e data plant
4.2.2.1 Investment costs and its terms & conditions capacity Construction 6-year period
According to the 昀椀nancial contract, Russia has agreed First
Unit 1–2023 and Unit 2–2024 commercial
to provide11.38 billion USD as a State credit with an operation
interest rate of Libor plus 1.75% and capped at 4%. This year Plant lifetime
60-year (2022/2023 to 2081/2082)
covers 90% of the total investment costs of 12.65 billion Plant 75% 80% 85% 90%
USD. This State credit is to be repaid over a period of capacity factor (PCF)
28 years. The government of Bangladesh provides the Investment costs United 11.4 billion
remaining 10% i.e. USD1.27 billion of the total invest- and its terms and States Dollar conditions (USD)
ment costs (WNA 2020, Akbar 2017, Rahman 2016). Bangladeshi 219.2 billion
The in昀氀ation rate was taken to be changed at a steady taka (BDT)
rate of 6% per year against the local currency (Bangla- Interest rate 4% Repayment 28 years
deshi Taka-BDT; 1USD = 80 BDT). For the USD foreign period
currency, the in昀氀ation rate changes at a steady rate of 2% In昀氀ation rate USD Steady rate 2% /year
per year. Among the four available depreciation calcula- BDT Steady rate 6% / year Tax rate Steady rate 25%
tion methods, linear depreciation was chosen to calcula- Currency Exchange 80 BDT per USD
te the total depreciation over the depreciable life of the exchange rate rate re昀氀ects the in昀氀ation
plant for simplicity. In this calculation, the depreciation rate
time was considered over the total economic life of the Depreciation Linear 60 Years plant e.g. 60-year.
O & M costs (Low From 2022 123 Million 131.5 139.7 148 Million case) USD per Million Million USD per year (7.82 USD per USD per year (7.82 $/MWh) year (7.82 year (7.82 $/MWh)
4.2.2.2 Operation & Maintenance (O& M) costs $/MWh) $/MWh) Fuel costs (Low From 2022 70.95 75.7 80.4 85.1 case) Million Million Million Million
In the case of the Rooppur NPP project, it was not publicly USD per USD per USD per USD per
available to get the actual data of O&M as well as fuel costs
year (4.5 $/ year (4.5 $/ year (4.5 $/ year (4.5 $/ MWh) MWh) MWh) MWh)
from the 昀椀nancial agreement between the Russian Federa- Case-5 Case-6 Case-7 Case-8
tion and Bangladesh (Akbar 2017). Under this situation, O & M costs From 2022 228.6 243.8 259 Million 274.4
we searched for global benchmarked data. Table 2 shows (High case) Million Million USD per Million USD per USD per year (14.5 USD per
the global NPP O&M costs and fuel costs data used in dif- year (14.5 year (14.5 $/MWh) year (14.5
ferent economic studies. Under di昀昀erent studies, the O&M $/MWh) $/MWh) $/MWh) Fuel costs (High From 2022 176.6 188.4 200.1 211.9
costs and fuel costs data are not varied except OECD/NEA case) Million Million Million Million
(2005). In the OECD/NEA (2005) studies, a high variation USD per USD per USD per USD per year (11.2 year (11.2 year (11.2 year (11.2
is found in both O&M and fuel costs data. In the Hungarian $/MWh) $/MWh) $/MWh) $/MWh)
economic study on the Paks II NPP project, they took the Case-9: Worst-case
O&M costs (High 14.5 $/MWh Fuel costs 11.2 $/ Plant 50%
global average benchmarked data (Paks II 2015). case) (High case) MWh capacity
In line with the global cost trend data, in our analysis, factor (Worst)
assumptions of O&M costs for low and high case scenarios Decommissioning Fund starting 1.0 billion USD
were considered as 7.82$/MWh and 14.5$/MWh respecti- costs from 2030
vely. The variation of O&M costs from low to high case Discount rate 10%
Figure 2. Construction, commissioning, and commercial operation schedule of the twin VVER-1200MWe model reactors at Rooppur. lOMoAR cPSD| 36238895 188
Islam MS & Bhuiyan TH: Assessment of costs of nuclear power in Bangladesh
Table 2. NPP O&M costs and fuel costs data (Thomas et al.
(vi) Possibility of high opportunity costs of 10% gover-
2007, Locatelli and Mancini 2010). nment fund Name of the study O&M cost ($/MWh) Fuel cost ($/MWh)
(vii) Possible accidents and liability. MIT (2003) 12.34 4.82 The Royal Academy of Engg. 14.58 11.22 (2004)
4.2.2.6 Plant capacity factor (PCF) The University of Chicago 8.98 4.49 (2004)
In this study, four di昀昀erent PCFs were considered as 75, Canadian Nuclear Association 7.86 4.49 (2004)
80, 85, and 90%. However, the design PCF of the VVER- OECD/NEA(2005) 11.22–29.23 4.49–19 (average=11.74)
1200 is 90% and the global average PCF is 85% (Paks (average=20.2)
II 2015). It is noteworthy that the average PCF of fos- UK Energy Review (2006) 12.9 6.51 Global high case (Paks II, 18.4 7.85
sil fuel-based power plants is below 50% in Bangladesh 2015)
(BPDB 2018–2019). The reasons for this low PCF are due Global low case (Paks-II, 7.52 5.27 2015)
to interrupted primary fuel supply, grid instability, insu昀케-
Global average (Paks-II, 2015) 12.79 6.28
cient grid network, poor management, and less consump-
This study (Rooppur NPP project)
tion of electricity during the lean period. In such a situa- High case 14.5 11.2 Low case 7.82 4.5
tion, Rooppur NPP may not be an exceptional one. For
this, a 50% PCF was considered in a worst-case scenario
scenarios is about 45%. The assumed O&M costs data for
to predict a high perceived risk.
the high case scenario is close to the global average data. 4.2.2.3 Fuel costs
5. Results and discussion
In the case of fuel costs, the OECD/NEA’s (2005) low 5.1 Case study 1 to 4
and high benchmarked data are 4.49$/MWh and 19$/
MWh respectively while the global average data is 6.28$/
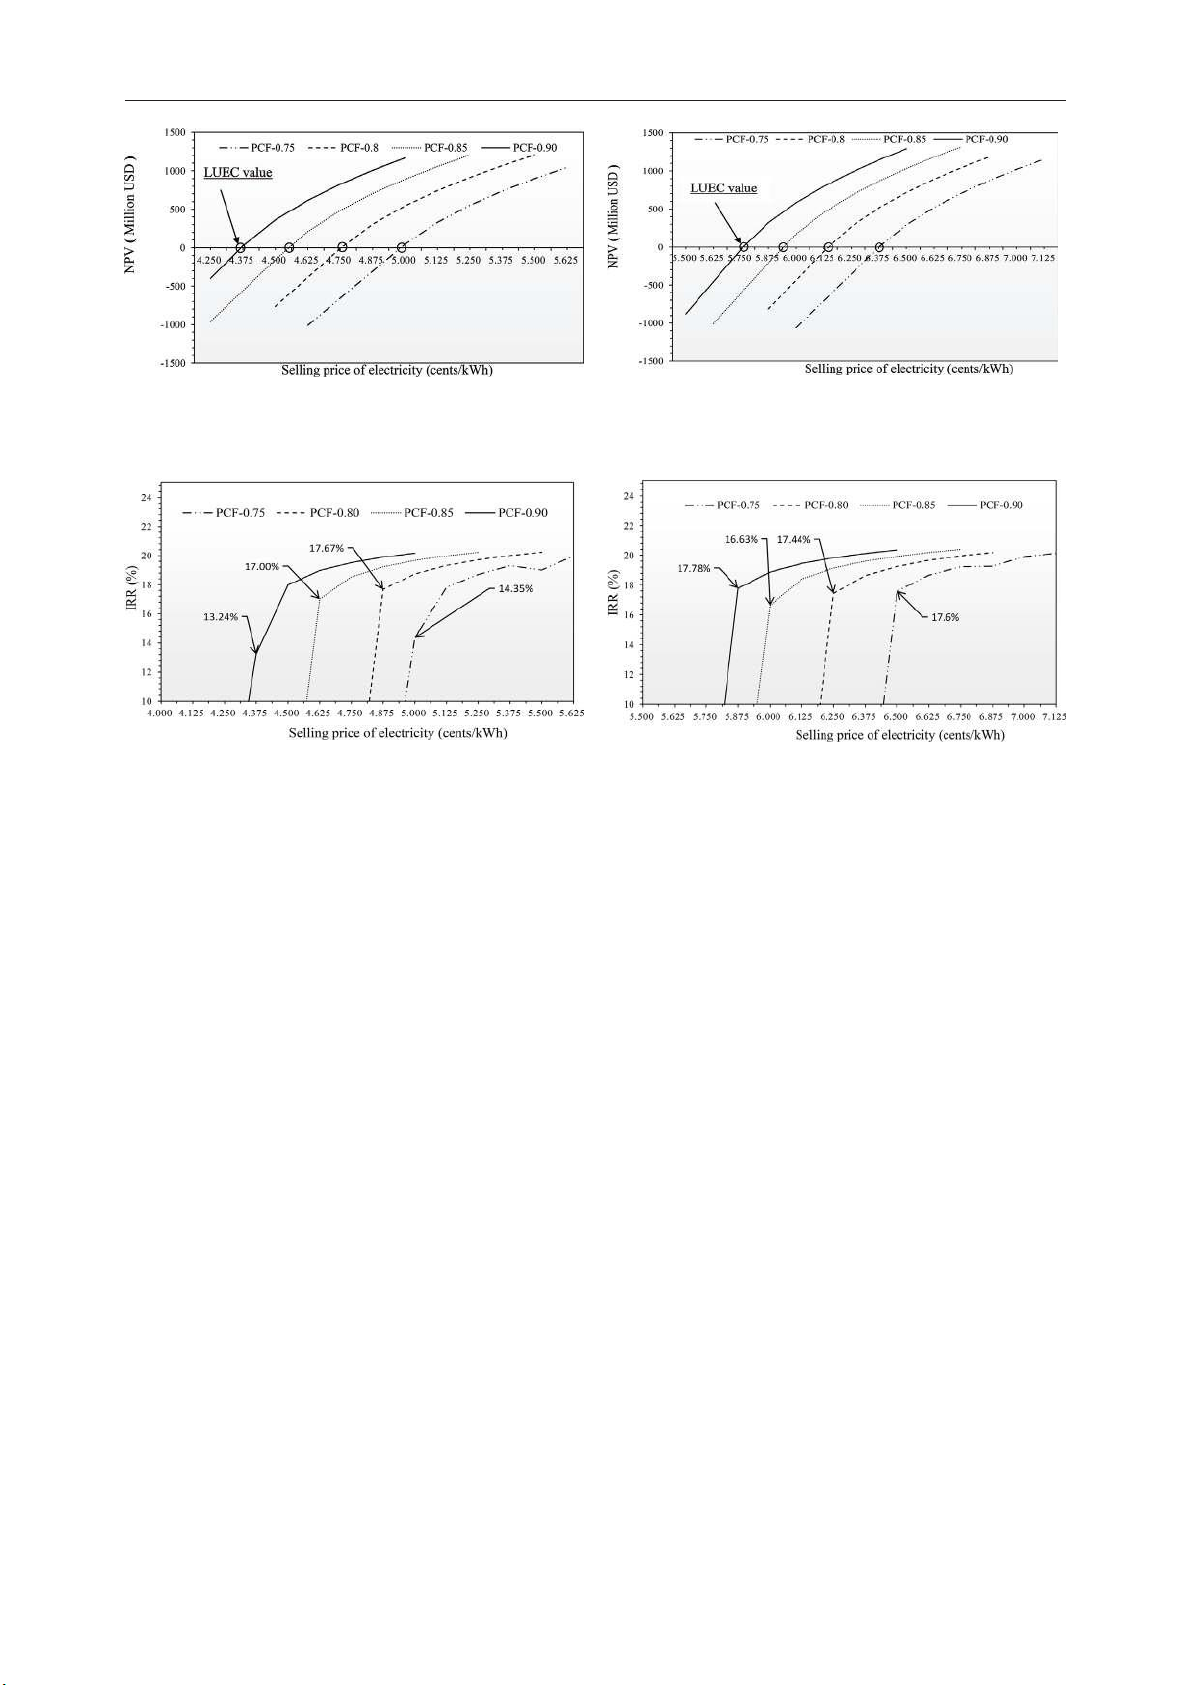
The variation of NPV and IRR are plotted by varying
MWh. In this analysis, a low and a high value of fuel costs
the selling price of electricity at nine di昀昀erent postulated
were assumed as 4.5$/MWh and 11.2$/MWh respective-
scenarios for twin units. Figures 3 and 4 depict the varia-
ly. The variation in fuel costs from low to high cases is at
tion of NPV and IRR with the selling price of electricity
about 40%. The high-end fuel cost is about double to the
at low O&M costs and fuel costs with four di昀昀erent PCFs
global average data but close to the OECD/NEA average
of 75, 80, 85, and 90%. These curves are plotted by ta-
data. Russia will provide the up-to-date e昀케cient fuels at
king a gradual increment in each step of 0.125 cents/kWh
the international market price for the entire operating li-
(BDT: 0.1 taka/kWh). It is found in Fig. 3 that for the
fetime of the two units of the Rooppur NPP according to
four case studies of 1 to 4, LUEC values stand to 4.95,
the fuel supply contract (TVEL 2019). The fuel reloading
4.75, 4.60, 4.37 cents/kWh at which NPV=0. It is also
cycle will recommence in every 18 months.
seen above or below those LUEC values, NPV becomes
positive or negative. At NPV=0, the total revenue (cash
4.2.2.4 Decommissioning costs
in昀氀ows) is equal to the total expenditures (cash out昀氀ows)
of which is the break-even or minimum selling price of
In this study, a fund amounting to 1 billion USD which is
electricity of the project. When the selling price of elec-
equivalent to 9%, was considered for decommissioning
tricity drops below those LUEC points, NPV becomes
cost in order to dismantle the two units after the end of its
negative, which results in a net loss of the project. From
60-year economic service life.
the IRR perspective, as shown in Fig.4, at NPV=0, the
threshold IRR stands to 14.30, 17.67, 17.00, and 13.24% 4.2.2.5 Discount rate
at four case studies of 1–4 respectively which is higher
than the discount rate (10%) of the project. With the in-
The discount rate was set to 10% for the nine case studies
crease in the selling price of electricity as well as the
where the foreign loan interest rate is to be not more than
PCF, a small variation of IRR is found for all the cases.
4%. Reasons for 昀椀xing a high discount rate for a deve-
However, it reaches up to 20%. On the other hand, below
loping economic country like Bangladesh are manifold;
those LUEC values, IRR becomes less than the discount (i)
Quick return of investment (shorter payback period)
rate (10%) which is risky for the project. It can be worth for higher LUECs
mentioned here that for high investment and long opera-
(ii) Operational uncertainty (a high gap between de-
ting lifetime of an NPP, a higher IRR is not expected but mand-supply)
an attractive NPV is expected steadily over a long time (iii) High in昀氀ation rate
of the plant. Among the four case studies, case study-4
(iv) Socio-political uncertainty and natural calamities
is found better in terms of the selling price of electricity prone country
where LUEC stands to 4.37 cents/kWh at a high PCF of
(v) Country’s high infrastructure development cost than
90% and low O&M costs and fuel costs. However, such the neighboring countries
a high PCF matters only 12% on the LUECs. In this ana- lOMoAR cPSD| 36238895
Nuclear Energy and Technology 6(3): 181–194 189
Figure 3. Variation of NPV with selling price of electricity con-
Figure 5. Variation of NPV with selling price of electricity consid-
sidering low O&M cost-7.82$/MWh and fuel cost-4.50$/MWh,
ering high O&M costs-14.5$/MWh and fuel costs-11.2$/MWh,
discount rate-10%, and PCFs-75, 80, 85, and 90% (Case 1 to 4).
discount rate-10% and PCFs-75, 80, 85, and 90% (Case 5 to 8).
Figure 4. Variation of IRR with selling price of electricity con-
Figure 6. Variation of IRR with selling price of electricity con-
sidering low O&M costs-7.82$/MWh and fuel costs-4.50$/
sidering high O&M costs-14.5$/MWh and fuel costs-11.2$/
MWh, discount rate-10% and PCFs-75, 80, 85, and 90% (Case
MWh, discount rate-10% and PCFs-75, 80, 85, and 90% (Case 1 to 4). 5 to 8).
lysis, the relationship between NPV vs selling price of
not much a昀昀ect generation costs if the discount rate,
electricity and IRR vs selling price of electricity appear
investment costs, and construction time remain 昀椀xed.
non-linearity as the in昀氀ation rate for both foreign and lo-
With the increase of O&M costs and fuel costs, only
cal parts of 2% and 6% respectively in which is far from
a slight variation of the unit selling price of electricity the discount rate (10%).
( 1cent) is found in comparison with the low O&M
costs and fuel costs scenarios. And no major variation 5.2 Case study 5 to 8
is found in the NPVs amongst all the case studies. From
these 昀椀ndings, it can be said that levelized generation
The case studies of 5–8 (Figures 5 and 6) are drawn to
costs of an NPP do not depend much on O&M costs and
see the variation of NPV and IRR with a selling price of
fuel costs as these are contributing small portions of the
electricity considering a high O&M cost of 14.5$/MWh lifecycle costs of the plant.
and a high fuel cost of 11.2$/MWh. Graphs NPV vs.
selling price of electricity (Fig. 5) and IRR vs. selling
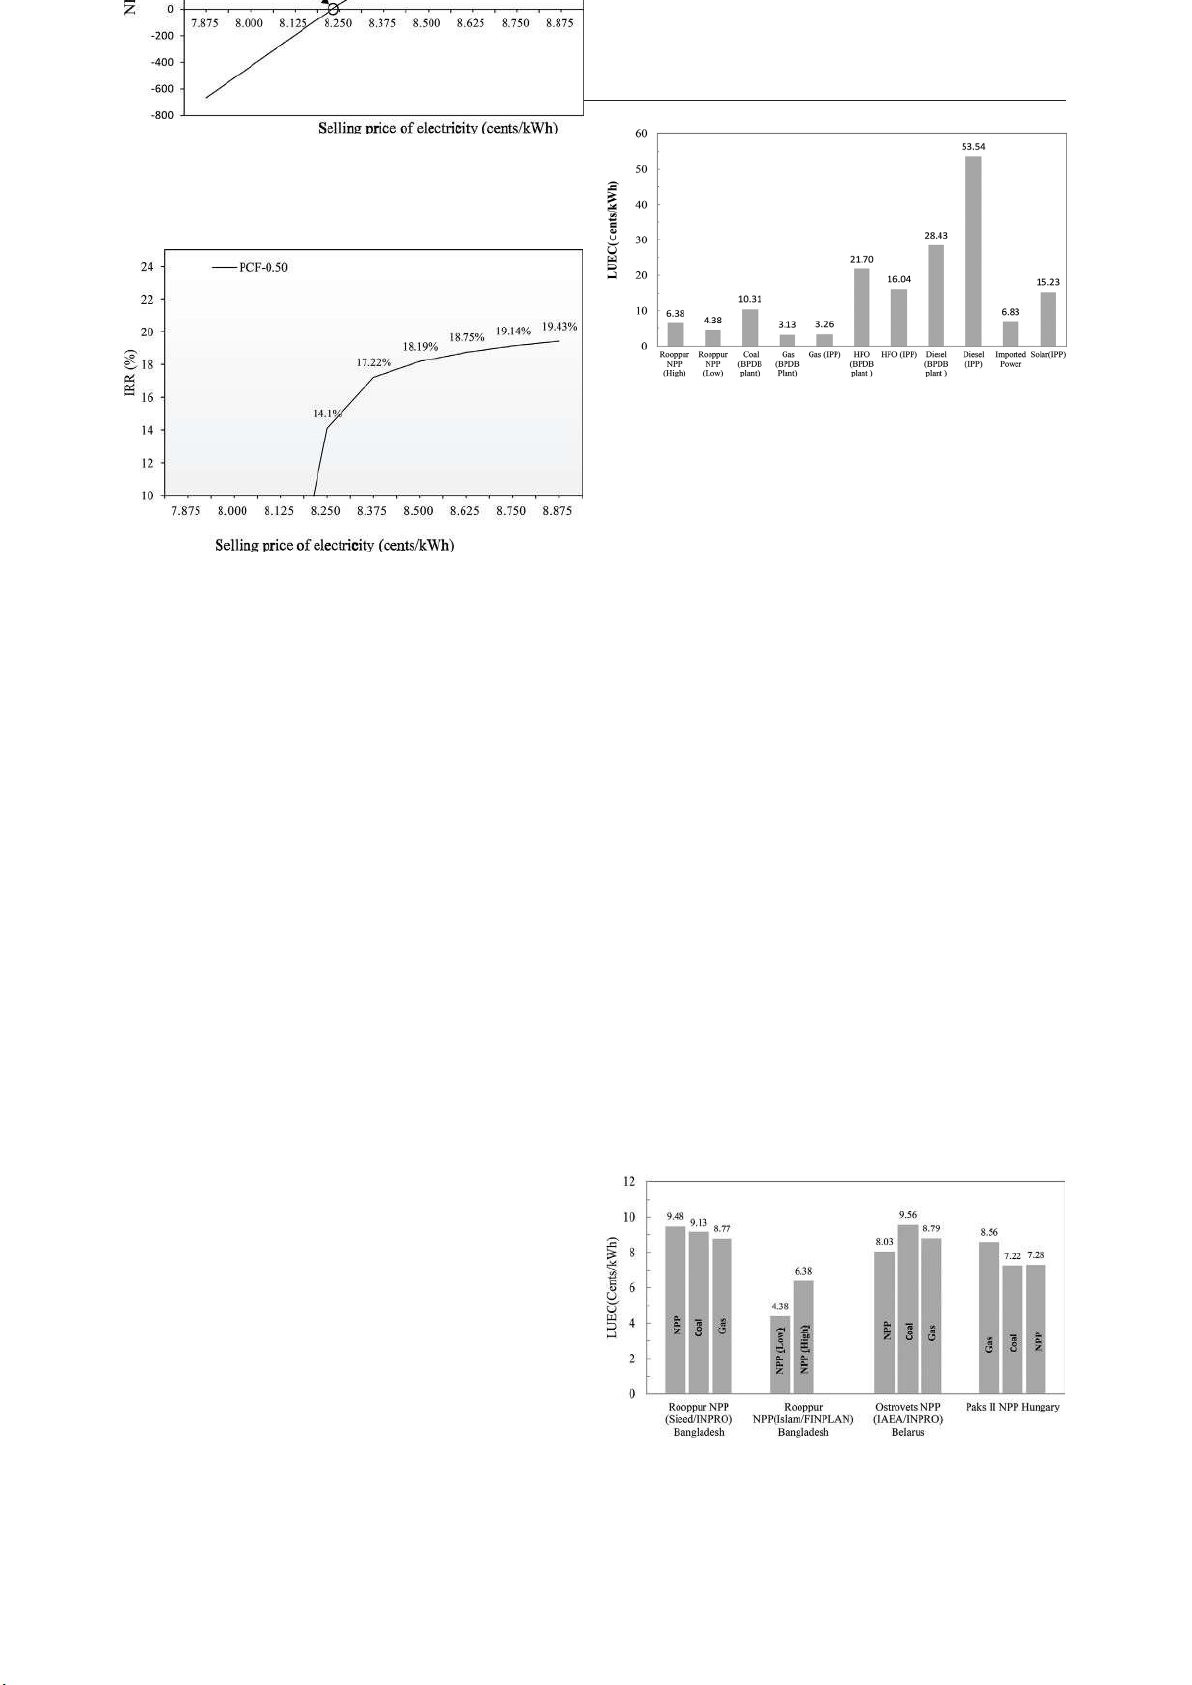
5.3 Case study-9: Worst scenario
price of electricity (Fig. 6) are plotted with a gradual
increment in each step of 0.127 cents/kWh (BDT: 0.1 taka/kWh).
Figures 7 and 8 show the selling price of electricity con-
Considering 54% increased plant O&M costs, 40%
sidering high O&M costs, fuel costs, and very low PCF
increased fuel costs, and keeping the same PCFs com-
of 50%. Under this extreme situation, a high LUEC va-
pared with the four low case cost studies of 1–4, the
lue of 8.25 is found at which NPV=0 with the threshold
LUEC values at the four case studies of 5–8 stand to
IRR value of 14.1%. Considering such an extremely
6.37, 6.16, 5.94, 5.75 cents/kWh respectively at which
low value of PCF, it impacts on the LUEC value but it
NPV=0. And then, above those LUEC points, NPV be-
does not impact on the IRR. This 50% low PCF can be
comes positive and below those LUEC points, NPV be-
thought of due to a shortage of electricity transmissi-
comes negative. Even though for considering such high
on network, grid instability, failure of major electrical
O&M costs and fuel costs over the 60-year lifetime of
equipment (generator, transformer, etc.), and ine昀케cient
the plant, the variation of IRR over the LUECs is found
fuel management during the operation lifecycle of the
insensitive which means O&M costs and fuel costs do
plant for an inexperienced and low technologically ad- lOMoAR cPSD| 36238895 190
Islam MS & Bhuiyan TH: Assessment of costs of nuclear power in Bangladesh
Figure 7. Variation of NPV with selling price of electricity
(cents/kWh) considering high plant O&M costs-14.5$/MWh
and fuel costs-11.2$/MWh, discount rate-10% and PCF-50%.
Figure 9. Comparison of LUEC with other power generating
sources in Bangladesh (BPDB 2018–2019).
supply from home and abroad. Heavy fuel oil (HFO) as
well as diesel fuels which are used in power generation
in both government and independent power producers
(IPPs) show a high rate of electricity generation because
Figure 8. Variation of IRR with selling price of electricity
of being costly imported oil (BPDB 2018–2019). Hence
(cents/kWh) considering high plant O&M costs-14.5$/MWh
power generation from the Rooppur NPP project shows
and fuel costs-11.2$/MWh, discount rate-10% and PCF-50%.
very much cost competitive with gas, coal, and imported
electricity from India except oil and solar based power
vanced countries like Bangladesh. In summary, the generating sources.
LUEC values are found in the range of 4.37–8.25 cents/
Figure 10 compares the LUECs of Bangladesh, Be-
kWh at nine postulated case studies. The case study-9
larusian, and Hungarian NPP projects with the other
anticipates the worst possible scenario. However, the es-
two baseload power sources such as gas and coal. The
timation of LUEC under the worst case scenario shows
LUEC calculated by Sieed et al. (2015) using the IN-
good agreement with the LUEC estimations of Sieed
PRO model shows slightly high for the Rooppur NPP
et al. (2015) and Rahman (2016). Furthermore, LUEC
project compared with coal and gas 昀椀red power plants.
predicted by Bazlul and Iftekher (2017) shows disagree-
In our analysis, the FINPLAN model predicts a lower ment with our estimations.
estimation of LUEC for an NPP. The reasons for vari-
ation in LUECs are due to considering overnight con-
struction costs of $5000/kWe instead of lifecycle costs.
5.4 Comparison of LUECs with other power genera-
In the case of the Belarusian NPP project at Ostrovets, ting sources
IAEA calculation using the INPRO model shows slight-
ly high electricity costs for the coal and gas 昀椀red po-
Figure 9 shows the comparison of LUEC values of the
wer plants in comparison with nuclear (IAEA/INPRO
Rooppur NPP project with other available power gene-
2013). Costs of electricity both nuclear and coal are
rating sources in Bangladesh. According to the BPD-
found almost the same trend during the economic eva-
B’s 2018–2019 annual report, LUEC values for its own luation of the Hungarian Paks II NPP project. Three
plants varied from 3.13 to 54 cents/kWh. The LUEC
countries are constructing the same reactor model, elec-
value of 3.13 cents/kWh is the cheapest for the indigen-
tric output, similar 昀椀nancial terms and conditions, and
ous gas based power plant. However, future electricity
same vendor country i.e. Russia. Among the three NPP
costs from gas source will not be cheap as indigenous
gas supply has been decreasing gradually and the short-
fall will be 昀椀lled in by imported LNG. Coal based power
plant shows little bit high cost due to mixed mode coal
Figure 10. Comparison of LUEC of the three VVER-1200 Gen
III+ NPP projects with two baseload power sources (IAEA/IN- PRO 2013, Paks II 2015). lOMoAR cPSD| 36238895
Nuclear Energy and Technology 6(3): 181–194 191
projects, the costs of the Rooppur NPP project both low
5.6 Cumulative loss/pro昀椀t
and high end cases show the most competitive, attrac-
tive, and risk acceptable compared with coal and gas
Retained earnings (cumulative loss/pro昀椀t) over the whole 昀椀red power plants.
60-year operation lifecycle of the plant at eight di昀昀erent
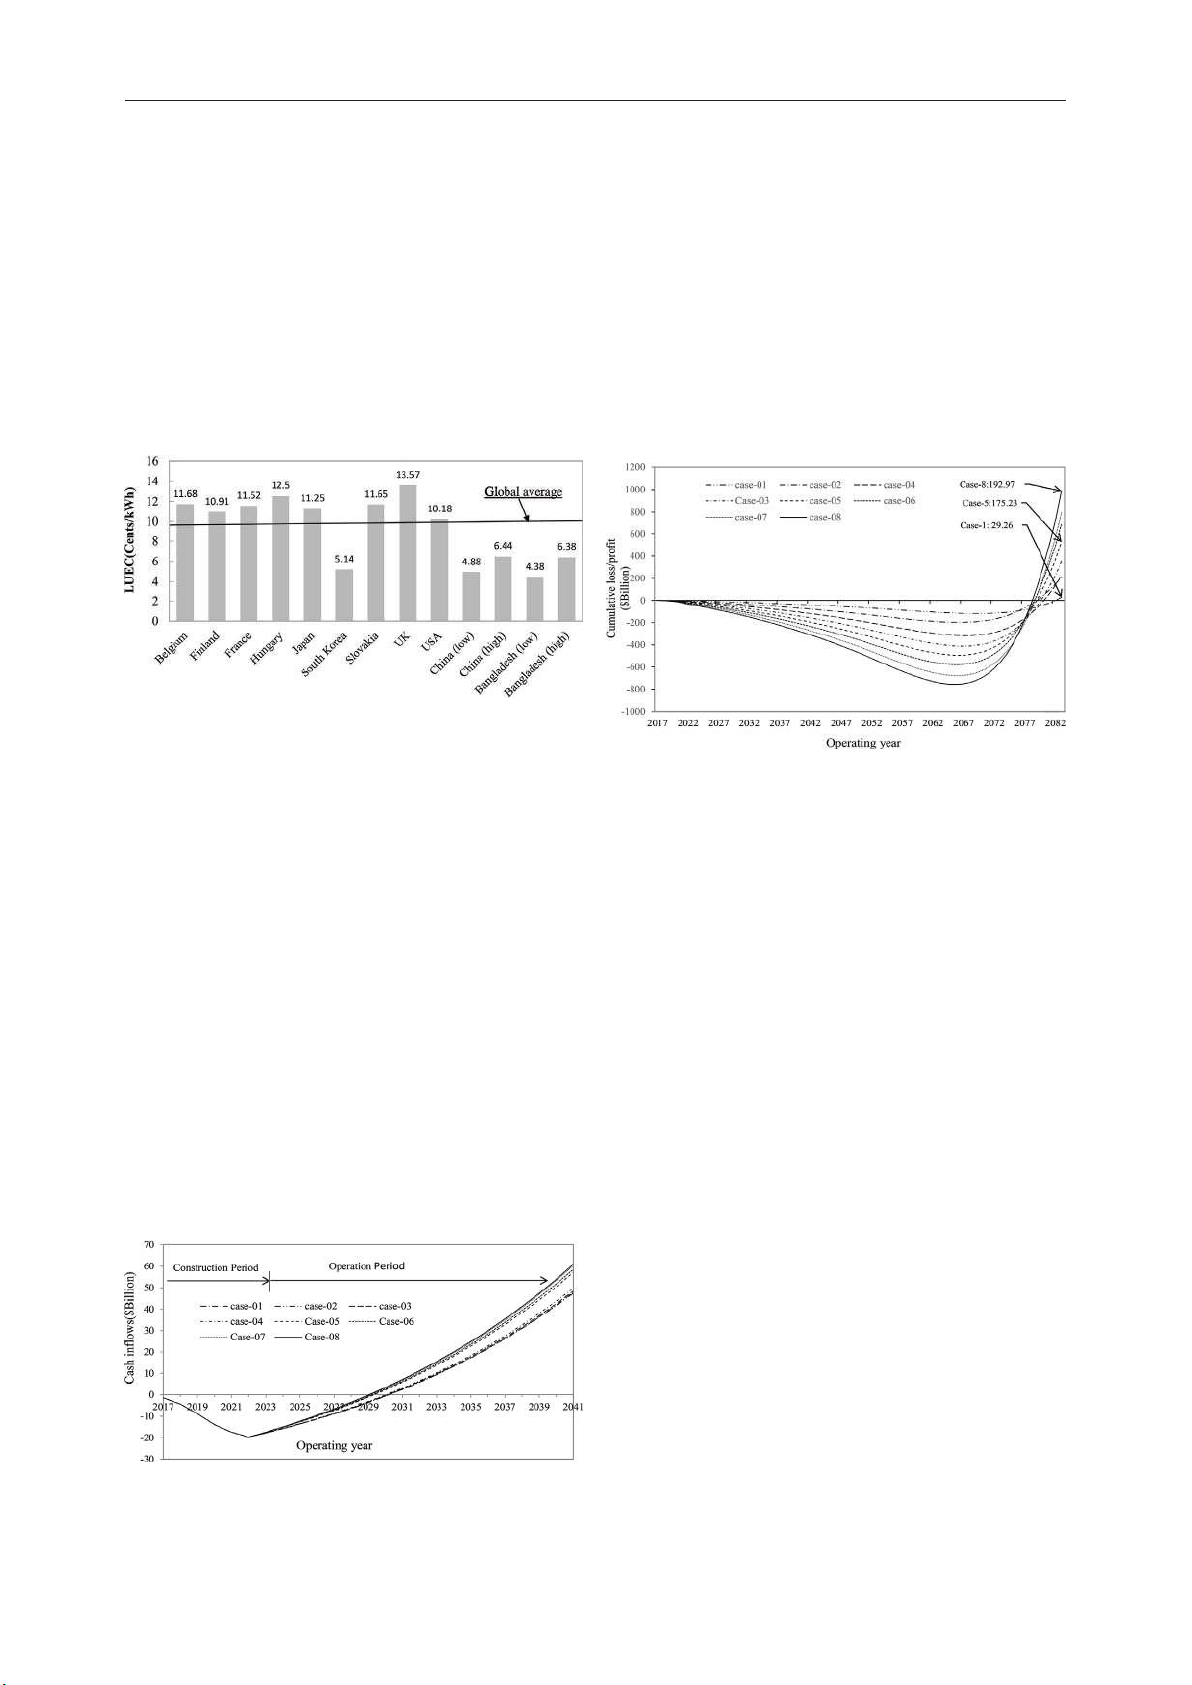
Figure 11 shows the LUECs of global NPPs. The
postulated scenarios is accumulated to be 15.72 to 192.96
highest lifecycle cost appears in the UK. The US and
billion USD respectively. The revenue generated at eight
some European countries are found in similar trends
cases during the operational period is anticipated to be
in nuclear power generating costs while South Ko-
su昀케cient to cover the annual cost of O&M including the
rea and China are found to be the lowest generation
funding of waste management, decommissioning, and the
costs. Bangladesh stands to China and South Korea,
payment of taxes. This can be seen in Fig.13 that the pro昀椀t
and about half the global average unit generation costs
is adequate to enable the State to cover the cost associated (9.59 cents/kWh).
with repaying the 昀椀nancial credit agreement and to recei- ve investment.
Figure 11. Comparison of LUEC values with global nuclear
power generating countries (discount rate of 10% and PCF of 85% (OECD/NEA 2015).
Figure 13. Illustrative retained earnings at eight di昀昀erent case
studies of the Rooppur NPP project. 5.5 Payback period 6. Conclusion
Figure 12 shows the project cumulative cash in昀氀ows that
is loan drawn during the construction period (2017/18–
2022/23) and the revenue earning from electricity sales
Evaluation of 昀椀nancing and economic risks associated
at eight postulated case studies excluding the worst case
with the construction of a new build NPP is an important
scenario (Case-9). The breakeven point at four case stu-
prerequisite for a successful nuclear power program. Such
dies of 1–4 is found to be in 2028 and the rest four case
investment risk should be acceptable in comparison to
studies of 5–8 are found to be in 2029. The project will
other available power projects. The article calculates the
have cash in昀氀ows from the electricity sales in the same
economic and 昀椀nancial indicators e.g. LUEC, NPV, IRR,
amount of its total investments within 7–8 years after the
and PBP to show how potential and economic robustness
start of commercial operation of the two units in 2023 and
of the Rooppur NPP project is. The LUECs of the Rooppur
2024. Sensitivity analysis indicates that the return of in-
NPP project are found in the range of 43.8 to 63.8$/MWh
vestment of the project is not overly sensitive to the PCF
at the eight di昀昀erent postulated scenarios from low to high
over the operational lifetime of the plant. For a higher
O&M costs (7.82–14.5$/MWh and low to high fuel costs
LUEC, quicker PBP is expected for a discount rate of
(4.5–11.2$/MWh) with the four PCFs of 75, 80, 85 and
10% and a plant lifetime of 60-year.
90%. Even though considering the 45% high O&M costs
and 40% high fuel costs with regard to the low case scena-
rios of 1–4, the LUEC becomes at 63.8 $/MWh at a PCF
of 75%. In these high O&M costs and fuel costs scena-
rios, at which NPV=0, the threshold IRR value is found
in the range of 16.63 to 17.78% against the discount rate
of 10%, which shows an attractive rate of return. With the
increase in the selling price of electricity, NPV becomes
positive and the IRR reaches up to 20% in all case studies.
The PBP for accumulating the capital investments from
electricity sales after the start of commercial operation in
2023 and 2024, will be the at least in 2029. This plant may
Figure 12. Cumulative cash in昀氀ows pro昀椀le of the Rooppur NPP
bring a cumulative pro昀椀t of around 15.72 to 192.96 billion project (Billion USD).
USD respectively at the eight di昀昀erent scenarios over the lOMoAR cPSD| 36238895 192
Islam MS & Bhuiyan TH: Assessment of costs of nuclear power in Bangladesh
60-year uninterruptable reactor operation. Apart from the List of acronyms
eight di昀昀erent case studies, the LUEC is found as 82.5$/
MWh when the worst case scenario is anticipated. BPDB
Bangladesh Power Development Board
In this analysis, the LUECs from the Rooppur NPPs BDT Bangladesh Taka
are found to provide a reasonable and attractive rate FINPLAN
Financial Analysis of Electric Sector Ex-
of return with regard to the coal, oil, and renewables. pansion Plans
LUECs from the Rooppur NPPs show slightly costlier HFO Heavy Fuel Oil
than the gas based power plants. However, this advan- IRR Internal Rate of Return (%)
tageous situation is yet to remain last long as gas based IGA Intergovernmental Agreement
power plants are going to be replaced by the imported IAEA
International Atomic Energy Agency
expensive LNG. The 昀椀nancial and economic analyses INPRO
International Project on Innovative Nuclear
of the Rooppur NPP project in Bangladesh are found to Reactors and Fuel Cycles
be in a favorable condition than those of the Belarusi- IPP Independent Power Producers
an and Hungarian NPPs projects. From the global per- kWh kilowatt hour-Energy unit
spectives, LUECs for nuclear power in Bangladesh also LUEC
Levelized Unit Electricity Cost ($/kWh)
stand to a suitable situation. These assessments limit a LCOE
Levelized Cost of Electricity ($/kWh)
particular discount rate of 10%, a 昀椀xed investment cost, LNG Lique昀椀ed Natural Gas
a 昀椀xed construction time, uncertainty in taking the actu- MWe Megawatt Electric-Power Unit
al O&M costs and fuel costs, and considering up to the NPV Net Present Value ($ million)
60-year reactor design lifetime. Life extension of the NPP Nuclear Power Plant
two reactors is not considered during economic evalu- NEA Nuclear Energy Agency
ations of the plants. Since the country has no NPP ope- O&M Operation and Maintenance
rating experiences, this may bring uncertainty in main- OECD
Organisation for Economic Co-operation
taining the plant with high PCFs of above 75% as the and Development
average PCF of the fossil fuel power plants is 50%. To PSMP Power System Master Plan
keep maintaining the LUECs from nuclear power more PBP Payback Period (yr)
competitive with gas, coal, and renewables, the opera- PCF Plant Capacity Factor (%)
ting organization has to operate and maintain the NPPs US United States
locally with skilled workforces. This study suggests for USD United States Dollar ($)
developing trained manpower as well as ensuring the USDOE
United States Department of Energy
stable electrical grid system, and market demand for VVER Water-Water Energetic Reactor maintaining a higher PCF.
Furthermore, the macro-economic impact for intro-
duction to this large scale modern Gen III+ baseload Acknowledgement
NPP is huge and it creates a good number of employment
opportunities, manufacturing capabilities, infrastructure,
The authors gratefully acknowledge the reviewers’ in-
power, and environmental developments. Since there are
sightful comments and suggestions. We would like to
no publicly available 昀椀nancial and economic analysis of
thank Md. Ahsan Uddin and Prof. Dr. Mohammad Iftek-
the Rooppur NPP project, it is imperative to have a detai-
her Hossain, Department of Accounting and Informati-
led techno-economic and 昀椀nancial report using real-life
on Systems and Department of Economics, respectively,
data to perceive actual risk. Although there exist some
University of Dhaka for their valuable opinions in pre-
risks in investments due to unforeseen reasons, opera-
paring the data analysis. The authors also wish to thank
ting the Rooppur NPPs in a safe and secure manner still
Jubair Sieed, Nuclear power company of Bangladesh li-
appears to be instrumental for sustainable development
mited for his feedback. This work has not received any
with clean energy sources in Bangladesh.
sort of grant from any individual or organization. References
Aszódi A, et al. (2014) Report on Extension of the Paks II NPP-
Akbar MS (2017) A snapshot on Rooppur Nuclear Power Plant
energy political, technical and economical evaluations, Institute of Project
https://rooppurnpp.portal.gov.bd/sites/default/昀椀les/昀椀les/
Nuclear Techniques, Budapest University of Technology and Eco-
rooppurnpp.portal.gov.bd/notices/7e349f02_ec26_4a27_be29_66ef- nomics, Hungary.
81041cb8/A%20snapshot%20on%20Rooppur%20Nuclear%20
Amimul EM, Das CK, Alam MJ (2014) Feasibility and Safety Power%20Plant%20Project.pdf
Study of Nuclear Power in Bangladesh: Perspective to Rooppur
Ashraf ASMA, Islam MS (2018) Explaining Public Policy Choic-
Nuclear Power Plant, 1st National Conference on Electrical &
es: A Case Study of the First Nuclear Power Plant in Bangladesh,
Communication Engineering and Renewable Energy, 27 Novem-
Strategic Analysis, 42:5, 503–523. https://doi.org/10.1080/097001 ber, CUET, Bangladesh. 61.2018.1523076 lOMoAR cPSD| 36238895
Nuclear Energy and Technology 6(3): 181–194 193
Alam F, Sarkar R, Chowdhury H (2019) Nuclear power plants in
Ishrak AS (2015b) The nuclear conundrum for developing countries:
emerging economics and human resource development: A re-
are they ready yet?, Journal of Energy & Natural Resources Law,
view, Energy Procedia, 160, 3–10. https://doi.org/10.1016/j.egy-
33:2, 171–177. https://doi.org/10.1080/02646811.2015.1022441 pro.2019.02.111
IAEA/INPRO (2013) Assessment of the Planned Nuclear Energy
Ahamed MA (2014) Nuclear power as a tool for sustainable de-
System of Belarus, TECDOC No.1716.
velopment in energy sector in Bangladesh, International Con-
IAEA (2017) Managing the Financial Risk Associated with the Fi-
ference on Electrical Engineering and Information & Com-
nancing of New Nuclear Power Plant Projects, Nuclear Energy Se- munication Technology (ICEEICT). https://doi.org/10.1109/ ries No. NG-T-4.6. ICEEICT.2014.6919059
IAEA(2009) Tools and Methodologies for Energy System Planning
BPDB (2018–2019) Bangladesh Power Development Board, Gov-
and Nuclear Energy System Assessments, Sustainable Energy for
ernment of the People’s Republic of Bangladesh, Annual Report of
the 21st Century; https://sustainabledevelopment.un.org/content/
Fiscal-Year: 2018–2019. [Accessed 16/4/2020]
documents/19916IAEA_Brochure_ToolsMethodologies_for_Ener-
Bazlul HK, Iftekher HM (2017) Financial and Economical Feasibil- gy_System_Planning.pdf
ity of Rooppur NPP, Energy and Power.
IAEA/PRIS (2020) (Power Reactor Information System) database;
Boarin S, Locatelli G, Mancini M, Ricotti ME (2017) Financial
https://pris.iaea.org/PRIS/WorldStatistics/UnderConstructionReac-
Case Studies on Small-and Medium-Size Modular Reactors, Nu- torsByCountry.aspx
clear Technology, 178(2), 218–232. https://doi.org/10.13182/
IAEA/NES (2018) Economic Assessment of the Long Term Op- NT12-A13561
eration of Nuclear Power Plants: Approaches and Experience, No.
Barkatullah N (2011) Financing Nuclear Power Projects: Challenges NP-T-3.25.
and IAEA Assistance in Capacity Building, TM/Workshop on Topi-
Kharitonov VV, Kosterin NN (2017) Criteria of Return on Invest-
cal Issues on Infrastructure Development: Management and Evalua-
ment in Nuclear Energy, Nuclear Engineering and Technology,
tion of a National Nuclear Infrastructure, Vienna, Austria.
3(176–182). https://doi.org/10.1016/j.nucet.2017.08.006
Barkatullah N, Ahmad A (2017) Current status and emerging trends
Krautmann AC, Solow JL (1988) Economies of Scale in Nucle-
in 昀椀nancing nuclear power projects, Energy Strategy Reviews 18:
ar Power Generation, Southern Economic Journal, Vol. 55, No. 1.
127–140. https://doi.org/10.1016/j.esr.2017.09.015
https://doi.org/10.2307/1058857
Brigham EF, Ehrhardt MC (2011) Financial management: theory and
Lovering JR, Yip A, Nordhaus T (2016) Historical Construction
practice. thirteenth ed., Mason, OH: South-Western Cengage Learning.
Cost of Global Nuclear Power Reactor, Energy Policy, 91, 371–382.
Besley S, Brigham EF (2016) Essentials of Managerial Finance, 14th
https://doi.org/10.1016/j.enpol.2016.01.011 revised ed., Thomson Int.
Lucheroni C, Mari C (2014) Stochastic LCOE for Optimal Electric-
Carelli MD, Garrone P, Locatelli G, Mancini M, Myco昀昀 C, Trucco P, Ri-
ity Generation Portfolio Selection, 11th International Conference on
cotti ME (2010) Economic features of integral, modular, small-to-me-
the European Energy Market (EEM14), P.1–8, IEE, Crakow, Poland.
dium size reactors, Progress in Nuclear Enegry, 52: 403–414.
https://doi.org/10.1109/EEM.2014.6861243
Carelli MD, Ingersoll DT (2014) Handbook of Small Modular Nu-
Larsson S, Fantazzini D, Davidsson S, Kullander S, Höök M (2014)
clear Reactors, Woodhead Publishing, Elsevier.
Reviewing Electricity Cost Assessments, Renewable and Sustain-
CNA (2004) Canadian Nuclear Association, Canadian Energy Re-
able Energy Reviews, Vol. 30, p.170–183. https://doi.org/10.1016/j.
search Institute(CERI), Levelised Unit Electricity Cost Comparison of rser.2013.09.028
Alternate Technologies for Baseload Generation in Ontario, Canada.
Locatelli G, Mancini M (2010) Small-medium sized nuclear coal
Dimson E (1989) The Discount Rate of A Power Station, En-
and gas power plant: A probabilistic analysis of their 昀椀nancial of
ergy Economics, Vol. 11, Issue 3, 175–180, UK. https://doi.
their 昀椀nancial performances and in昀氀uence of CO2 cost, Energy Poli-
org/10.1016/0140-9883(89)90022-4
cy, 38(6360–6374). https://doi.org/10.1016/j.enpol.2010.06.027
EIA (1994) World Nuclear Outlook (1994), Report Number:
Mignacca B, Locatelli G (2020) Economics and 昀椀nance of small
DOE/EIA-0436(94), O昀케ce of Coal, Nuclear, Electric and Alter-
modular reactors: A systematic review and research agenda, Re-
nate Fuels, U.S. Department of Energy, Washington, DC 20585.
newable and Sustainable Energy Reviews, 118(109519). https://doi.
http://www.IAEA.Org/Inis/Collection/Nclcollectionstore/_Pub-
org/10.1016/j.rser.2019.109519 lic/26/070/26070262.pdf
Mari C (2014) Hedging Electricity Price Volatility Using Nu-
Huq S, Haque S, Zion B-d, Nasir N, Yusuf M, Huq S (2018) Assess-
clear Power, Applied Energy, Vol.113, p. 615–621. https://doi.
ment of Socio-economic Impacts of Cross-Border Electricity Trade
org/10.1016/j.apenergy.2013.08.016
(CBET) in Bangladesh, Technical Report, IRADe-SARI-23. https://
MIT (2003) The Future of Nuclear Power, An Interdiciplinary MIT
doi.org/10.13140/RG.2.2.14794.82885
Study, Massachusetts Institute of Technology, Cambridge, MA, USA.
Hultman NE, Koomey JG, Kammen DM (2007) What history can
Mollah AS (2015) Prospects of nuclear energy for sustainable en-
teach us about the future costs of U.S. nuclear power, Environ. Sci.
ergy development in Bangladesh, International Journal of Nuclear
Technol., 41 (7) 2088–2093. https://doi.org/10.1021/es0725089
Energy Science and Engineering (IJNESE) Volume 5. https://doi.
IGA (2011) Intergovernmental Agreement between the Government
org/10.14355/ijnese.2015.05.004
of the Russian Federation and the Government of the People’s Re-
Matin A (2015) The capital cost of Rooppur nuclear power plant,
public of Bangladesh on cooperation Concerning of a Nuclear Power
Chapter 18, Nuclear power & Rooppur, Issues and Concern, Mad-
Plant on the Territory of the People’s Republic of Bangladesh.
hyama Media & Publications Ltd., Dhaka, Bangladesh.
Ishrak AS (2015a) The Rooppur nuclear power plant: is Bangladsh
OECD/NEA (2005) Projected costs of generating electricity update.
really ready for nuclear power, Journal of World Energy Law and
OECD/NEA (2007) Cost Estimating Guidelines for Generation IV
Business, Vol.8, No.1. https://doi.org/10.1093/jwelb/jwu040
Nuclear Energy Systems (2007), The Economic Modeling Work- lOMoAR cPSD| 36238895 194
Islam MS & Bhuiyan TH: Assessment of costs of nuclear power in Bangladesh
ing Group of the Generation IV International Forum, Revision 4.2,
of mechanical engineering, Vol. 68, No.3, 167–182. https://doi. p.181. org/10.2478/scjme-2018-0033
OECD/NEA (2015) Projected Costs of Generating Electricity; https://
The Royal Academy of Engineering (2004) The Cost of Generating
www.OECD-NEA.Org/Ndd/Pubs/2015/7057-Proj-Costs-Electrici- Electricity, London. ty-2015.pdf
Thomas S, Bradford P, Froggatt A, Milborrow D (2007) The Eco-
OECD/NEA (2016) Costs of Decommissioning Nuclear Power
nomics of Nuclear Power, Research Report, Greenpeace Int. https://
Plants, No. 7201, https://www.Oecd-Nea.Org/Ndd/Pubs/2016/7201-
www.energiestiftung.ch/昀椀les/energiestiftung/publikationen/down- Costs-Decom-NPP.pdf.
loads/energiethemen-atomenergie-kosten/3greenpeace-2007.pdf
Paks II nuclear power project (2015) An economic analysis: A ratio-
The University of Chicago (2004) The Economic Future of Nuclear
nal investment case for Hungarian State resources, Rothschild, the
Power, Argonne National Laboratory, Chicago, IL, USA.
Prime Minister’s O昀케ce of the Hungarian Government.
TVEL (2019) Fuel Company of Rosatom to supply nuclear fuel for
PSMP (2016) Final Report Summary, People’s Republic of Bangla-
Rooppur NPP in Bangladesh https://www.rosatom.ru/en/press-cen-
desh Power & Energy Sector Master Plan.
tre/news/tvel-fuel-company-of-rosatom-to-supply-nuclear-fuel-for-
PSMP (2010) Ministry of Power, Energy and Mineral Resources rooppur-npp-in-bangladesh/
(MOPEMR). Government of the People’s Republic of Bangladesh;
UK Energy Review Report (2006) The Energy Challenge, Depart-
http://www.BPDB.Gov.Bd/Download/Psmp/Psmp2010.pdf [Ac- ment of Trade and Industry. cessed 02/05/2017]
Winkler T, Streit M (2008) Modelling the Economics of a New Nu-
Rahman MKM (2016) Rooppur Nuclear Power Plant: A Review of
clear Power Plant in Switzerland, Proceedings of International Youth
Cost of Project & Power, Energy and Power, Vol. 14, Issue 5, August 16.
Nuclear Congress, Paper No:215, Interlaken Switzerland, 20–26
Rahman A (2016a) Controversy over the Rooppur NPP Energy Cost, September.
Energy and Power, Vol. 13, Issue 17.
WNA (2020) Plan for new build reactors. https://www.world-nucle-
Rahman A (2016b) Cost of Rooppur nuclear power plant: Sky is the
ar.org/information-library/current-and-future-generation/plans-for-
limit, Energy & Power, Vol.14, Issue 9, pp. 41–42. new-reactors-worldwide.aspx
Reza SS, Nawaz T, Yamin A, Tutul DD, Chowdhury TA (2014)
WNA (2017) Report, Nuclear Power Economics and Project Struc-
Determination of a昀昀ordable production cost and nuclear based
turing, Report No. 2017/001, London, UK.
electricity generation in Bangladesh, 8th International Conference
WNA (2020) Nuclear Power in Bangladesh; https://www.world-nu-
on Electrical and Computer Engineering 20–22 December, Dhaka,
clear.org/information-library/country-pro昀椀les/countries-a-f/bangla-
Bangladesh. https://doi.org/10.1109/ICECE.2014.7026955 desh.aspx
Sieed J, Hossain S, Kabir KA (2015) Applications of INPRO Meth-
WB (2020) Accessed on August 2020; https://www.worldbank.org/
odology to Assess Economic Feasibility of Proposed Rooppur Nu-
en/country/bangladesh/overview
clear Power Plant, International Conference on Materials, Electron-
Xoubi N (2019) Economic assessment of nuclear electricity from
ics & Information Engineering, ICMEIE, Rajshahi, Bangladesh.
VVER-1000 reactor deployment in a developing country, Ener-
Sakib KN (2015) Nuclear power plant in Bangladesh and the much
gy175, 14–22. https://doi.org/10.1016/j.energy.2019.03.071
talked about Rooppur project, Global Journal of Researches in Engi-
Yangbo D, John EP (2010) Capacity Factor Risk at Nuclear Power
neering Mechanical and Mechanics Engineering, Volume 15, Issue
Plants, Center for Energy and Environmental Policy Research, MIT, 2, Version 1. USA.
Saha S, Koushik R, Souvik R, Asfakur RMd, Zahid HMd (2018)
Zweifel P, Praktiknjo A, Erdmann G (2017) Peter, Energy Econom-
Rooppur nuclear power plant: current status & feasibility, Journal
ics, Theory and Applications, Springer.
Tài liệu liên quan:
-

Giao tiếp Trực Tiếp và Gián Tiếp: Ưu Nhược Điểm và Ảnh Hưởng
26 13 -

Khái Niệm Khách Du Lịch: Định Nghĩa và Phân Loại Chi Tiết
19 10 -
Khảo Sát Hành Vi Du Lịch Của Thanh Niên BTL Marketing Du Lịch
42 21 -
Các khu du lịch nổi tiếng tại Việt Nam năm 2023 | Môn Du lịch và cuộc sống - Trường Cao đẳng Du lịch Sài Gòn
154 77 -

Khám Phá Các Địa Điểm Du Lịch Đẹp Ở Việt Nam | Môn Du lịch và cuộc sống - Trường Cao đẳng Du lịch Sài Gòn
127 64