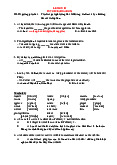
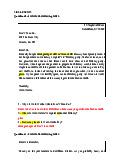
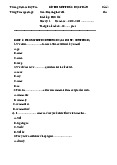
Quiz test - Reading level 2 | Trường Đại Học Duy Tân

Q1. Scale in which the respondent directly compares two or more objects and makes choices among them is A. Ranking Scale B. Rating Scale C. Graphic Scale D. None of these Tài liệu giúp bạn tham khảo, ôn tập và đạt kết quả cao. Mời bạn đọc đón xem!

Môn:
Trường:

Đại học Duy Tân 1.8 K tài liệu

Thông tin:
3 trang 7 tháng trước

Bình luận

Vui lòng đăng nhập hoặc đăng ký để gửi bình luận.

Quiz test - Reading level 2 | Trường Đại Học Duy Tân

Q1. Scale in which the respondent directly compares two or more objects and makes choices among them is A. Ranking Scale B. Rating Scale C. Graphic Scale D. None of these Tài liệu giúp bạn tham khảo, ôn tập và đạt kết quả cao. Mời bạn đọc đón xem!

60 30 lượt tải Tải xuống
The name: Phan Trương Thảo Uyên
The ID : 27202241039
MKT 403 D
CHAPTER 5 QUIZ
Q1. Scale in which the respondent directly compares two or more objects and
makes choices among them is
A. Ranking Scale
B. Rating Scale
C. Graphic Scale
D. None of these
Q 2. Final stage in the Research Process is
A. Problem formulation
B. Data collection
C. Data Analysis
D. Report Writing
Q 3. A comprehensive full Report of the research process is called
A. Thesis
B. Summary Report
C. Abstract
D. Article
Q 4. The first page of the research report is
A. Appendix
B. Bibliography
C. Index
D. Title Page
Q 5. The chi-square test is:
A. A mean
B. A multi-question tests.
C. A statistical mistake.
D. A statistic
Q 6. ANOVA is_______________
A. A government body which collects social statistics.
B. The name of a statistical software package.
C. A one-way analysis of variance.
D. A two-way analysis of variance.
Q 7. Which of the following is not one of the seven major parts to the research
report?
A. Results
B. Abstract
C. Method
D. Footnotes
Q 8. In SPSS, what is the "Data Viewer"?
A. A table summarizing the frequencies of data for one variable
B. A spreadsheet into which data can be entered
C. A dialog box that allows you to choose a statistical test
D. A screen in which variables can be defined and labeled
Q 9. What type of chart is useful for comparing values over categories?
A. Pie Chart
B. Column Chart
C. Line Chart
D. Dot Graph
Q 10. A feature that displays only the data in column (s) according to specified
criteria
A. Formula
B. Sorting
C. Filtering
D. Pivot
Q 11. Functions in MS Excel must begin with ___
A. An () sign
B. An Equal Sign
C. A Plus Sign
D. A > Sign
Q 12. The ____ feature of MS Excel quickly completes a series of data
A. Auto Complete
B. Auto Fill
C. Fill Handle
D. Sorting
Q 13. How many sheets are there, by default, when we create a new Excel file?
A. 1
B. 3
C. 5
D. 10
Q 14. In Excel, which one denoted a range from B1 through E5
A. B1 - E5
B. B1:E5
C. B1 to E5
D. B1$E5
Q 15. What type of chart is useful for showing trends or changes over time?
A. Pie Chart
B. Column Chart
C. Line Chart
D. Dot Graph
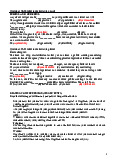
| 1/3

Preview text:

The name: Phan Trương Thảo Uyên The ID : 27202241039 MKT 403 D CHAPTER 5 QUIZ
Q1. Scale in which the respondent directly compares two or more objects and makes choices among them is A. Ranking Scale B. Rating Scale C. Graphic Scale D. None of these
Q 2. Final stage in the Research Process is A. Problem formulation B. Data collection C. Data Analysis D. Report Writing
Q 3. A comprehensive full Report of the research process is called A. Thesis B. Summary Report C. Abstract D. Article
Q 4. The first page of the research report is A. Appendix B. Bibliography C. Index D. Title Page Q 5. The chi-square test is: A. A mean B. A multi-question tests. C. A statistical mistake. D. A statistic Q 6. ANOVA is_______________
A. A government body which collects social statistics.
B. The name of a statistical software package.
C. A one-way analysis of variance.
D. A two-way analysis of variance.
Q 7. Which of the following is not one of the seven major parts to the research report? A. Results B. Abstract C. Method D. Footnotes
Q 8. In SPSS, what is the "Data Viewer"?
A. A table summarizing the frequencies of data for one variable
B. A spreadsheet into which data can be entered
C. A dialog box that allows you to choose a statistical test
D. A screen in which variables can be defined and labeled
Q 9. What type of chart is useful for comparing values over categories? A. Pie Chart B. Column Chart C. Line Chart D. Dot Graph
Q 10. A feature that displays only the data in column (s) according to specified criteria A. Formula B. Sorting C. Filtering D. Pivot
Q 11. Functions in MS Excel must begin with ___ A. An () sign B. An Equal Sign C. A Plus Sign D. A > Sign
Q 12. The ____ feature of MS Excel quickly completes a series of data A. Auto Complete B. Auto Fill C. Fill Handle D. Sorting
Q 13. How many sheets are there, by default, when we create a new Excel file? A. 1 B. 3 C. 5 D. 10
Q 14. In Excel, which one denoted a range from B1 through E5 A. B1 - E5 B. B1:E5 C. B1 to E5 D. B1$E5
Q 15. What type of chart is useful for showing trends or changes over time? A. Pie Chart B. Column Chart C. Line Chart D. Dot Graph