Reading 7 Introduction to Linear Regression - Business English | Trường Đại học Hùng Vương
Reading 7 Introduction to Linear Regression - Business English | Trường Đại học Hùng Vương được sưu tầm và soạn thảo dưới dạng file PDF để gửi tới các bạn sinh viên cùng tham khảo, ôn tập đầy đủ kiến thức, chuẩn bị cho các buổi học thật tốt. Mời bạn đọc đón xem!
Môn: Business English( TA1901) 89 tài liệu
Trường: Trường Đại học Hùng Vương 164 tài liệu
Tác giả:


Preview text:
Question #1 of 7 Question ID: 1377373
The coefficient of determination for a linear regression is best described as the:
percentage of the variation in the dependent variable explained by the variation of A) the independent variable.
percentage of the variation in the independent variable explained by the variation of B) the dependent variable.
C) covariance of the independent and dependent variables. Question #2 of 7 Question ID: 1377375
Consider the following analysis of variance (ANOVA) table: Sum of Degrees of Mean sum of Source squares freedom squares Regression 550 1 550.000 Error 750 38 19.737 Total 1,300 39
The F-statistic for the test of the fit of the model is closest to: A) 0.97. B) 0.42. C) 27.87. Question #3 of 7 Question ID: 1377377
Use the following t-table for this question: Probability in Right Tail d.f. 5.0% 2.5% 1.0% 196 1.653 1.972 2.346 197 1.653 1.972 2.345 198 1.653 1.972 2.345 199 1.653 1.972 2.345 200 1.653 1.972 2.345 201 1.652 1.972 2.345 202 1.652 1.972 2.345
A sample of 200 monthly observations is used for a simple linear regression of returns
versus leverage. The resulting equation is:
returns = 0.04 + 0.894(Leverage) + ε
If the standard error of the estimated slope variable is 0.06, a test of the hypothesis that the
slope coefficient is greater than or equal to 1.0 with a significance of 5% should:
A) be rejected the test statistic of –1.77 is greater than the critical value.
B) be rejected because the test statistic of –1.77 is less than the critical value.
C) not be rejected because the test statistic of –1.58 is not less than the critical value. Question #4 of 7 Question ID: 1377374
A simple linear regression is performed to quantify the relationship between the return on
the common stocks of medium-sized companies (mid-caps) and the return on the S&P 500
index, using the monthly return on mid-cap stocks as the dependent variable and the
monthly return on the S&P 500 as the independent variable. The results of the regression are shown below:
Coefficient Standard Error of Coefficient t-Value Intercept 1.71 2.950 0.58 S&P 500 1.52 0.130 11.69
Coefficient of determination = 0.599
The strength of the relationship, as measured by the correlation coefficient, between the
return on mid-cap stocks and the return on the S&P 500 for the period under study was: A) 0.599. B) 0.774. C) 0.130. Question #5 of 7 Question ID: 1377378
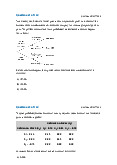
Given the relationship: Y = 2.83 + 1.5X
What is the predicted value of the dependent variable when the value of the independent variable equals 2? A) –0.55. B) 2.83. C) 5.83. Question #6 of 7 Question ID: 1377376
Consider the following analysis of variance (ANOVA) table: Sum of Degrees of Mean sum of Source squares freedom squares Regression 556 1 556 Error 679 50 13.5 Total 1,235 51
The R2 for this regression is closest to: A) 0.82. B) 0.45. C) 0.55 Question #7 of 7 Question ID: 1377372
Which of the following is least likely an assumption of linear regression?
A) The variance of the error terms each period remains the same.
B) The error terms from a regression are positively correlated.
C) Values of the independent variable are not correlated with the error term.
Tài liệu liên quan:
-
Reading 10 Aggregate Output, Prices - Business English | Trường Đại học Hùng Vương
295 148 -
Reading 9 The Firm and Market Structures - Business English | Trường Đại học Hùng Vương
266 133 -
Reading 8 Topics in Demand - Business English | Trường Đại học Hùng Vương
265 133 -
Reading 3 Probability Concepts - Business English | Trường Đại học Hùng Vương
295 148