Write a Sales Report - Tiếng anh cơ bản | Đại học Tài chính - Quản trị kinh doanh

Product Units Sold Revenue ($)Laptops 16,000 10,400,000Smartphones 30,000 18,000,000Tablets 18,000 7,200,000. Tài liệu giúp bạn tham khảo, ôn tập và đạt kết quả cao. Mời bạn đọc đón xem!

Môn:
Thông tin:
2 trang 3 tháng trước

Bình luận

Vui lòng đăng nhập hoặc đăng ký để gửi bình luận.

Write a Sales Report - Tiếng anh cơ bản | Đại học Tài chính - Quản trị kinh doanh

Product Units Sold Revenue ($)Laptops 16,000 10,400,000Smartphones 30,000 18,000,000Tablets 18,000 7,200,000. Tài liệu giúp bạn tham khảo, ôn tập và đạt kết quả cao. Mời bạn đọc đón xem!

21 11 lượt tải Tải xuống
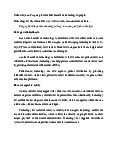
GreenLife Electronics Sales Data 2022-2023
Overall Sales Data 2022
Product Units Sold Revenue ($)
Laptops 16,000 10,400,000
Smartphones 30,000 18,000,000
Tablets 18,000 7,200,000
Accessories 42,000 2,100,000
Overall Sales Data 2023
Product Units Sold Revenue ($)
Laptops 18,000 11,700,000
Smartphones 32,000 19,200,000
Tablets 20,000 8,000,000
Accessories 45,000 2,250,000
Quarterly Sales Data 2023
Q1 2023
Product Units Sold Revenue ($)
Laptops 4,200 2,730,000
Smartphones 7,500 4,500,000
Tablets 4,500 1,800,000
Accessories 11,000 550,000
Q2 2023
Product Units Sold Revenue ($)
Laptops 4,500 2,925,000
Smartphones 7,800 4,680,000
Tablets 4,800 1,920,000
Accessories 11,500 575,000
Q3 2023
Product Units Sold Revenue ($)
Laptops 4,600 2,990,000
Smartphones 8,000 4,800,000
Tablets 5,000 2,000,000
Accessories 11,800 590,000
Q4 2023
Product Units Sold Revenue ($)
Laptops 4,700 3,055,000
Smartphones 8,700 5,220,000
Tablets 5,700 2,280,000
Accessories 12,200 610,000
Overall Customer Demographics (2022)
Age Group Percentage (%)
18-24 22
25-34 33
35-44 25
45-54 12
55+ 8
Overall Customer Demographics (2023)
Age Group Percentage (%)
18-24 20
25-34 35
35-44 25
45-54 10
55+ 10
| 1/2

Preview text:

GreenLife Electronics Sales Data 2022-2023 Overall Sales Data 2022 Product Units Sold Revenue ($) Laptops 16,000 10,400,000 Smartphones 30,000 18,000,000 Tablets 18,000 7,200,000 Accessories 42,000 2,100,000 Overall Sales Data 2023 Product Units Sold Revenue ($) Laptops 18,000 11,700,000 Smartphones 32,000 19,200,000 Tablets 20,000 8,000,000 Accessories 45,000 2,250,000
Quarterly Sales Data 2023 Q1 2023 Product Units Sold Revenue ($) Laptops 4,200 2,730,000 Smartphones 7,500 4,500,000 Tablets 4,500 1,800,000 Accessories 11,000 550,000 Q2 2023 Product Units Sold Revenue ($) Laptops 4,500 2,925,000 Smartphones 7,800 4,680,000 Tablets 4,800 1,920,000 Accessories 11,500 575,000 Q3 2023 Product Units Sold Revenue ($) Laptops 4,600 2,990,000 Smartphones 8,000 4,800,000 Tablets 5,000 2,000,000 Accessories 11,800 590,000 Q4 2023 Product Units Sold Revenue ($) Laptops 4,700 3,055,000 Smartphones 8,700 5,220,000 Tablets 5,700 2,280,000 Accessories 12,200 610,000
Overall Customer Demographics (2022)
Age Group Percentage (%) 18-24 22 25-34 33 35-44 25 45-54 12 55+ 8
Overall Customer Demographics (2023)
Age Group Percentage (%) 18-24 20 25-34 35 35-44 25 45-54 10 55+ 10