Writing Skill Practice for IELT | Học viện Hành chính Quốc gia
Writing Skill Practice for IELTgiaThe pie chart presents the percentages of the energy consumed for variouspurposes and how much greenhouse gas is emitted by an average Australianfamily Tài liệu giúp bạn tham khảo, ôn tập và đạt kết quả cao. Mời đọc đón xem!
Môn: Tiếng Anh chuyên ngành (TA2024) 127 tài liệu
Trường: Học viện Hành chính Quốc gia 1.1 K tài liệu
Tác giả:


Preview text:
lOMoARcPSD|49830739
Writing Task 1 – Test 1 – Cam 10
The pie chart presents the percentages of the energy consumed for various purposes
and how much greenhouse gas is emitted by an average Australian family.
Overall, it is clear that heating accounted for the highest proportion of consumption,
while, the largest percentage belongs to water heating.
As for Australia’s household energy use, 42% of the energy consumed is used for
heating, followed by water heating, at 30%. In contrast, this figure for other
appliances stands at 15%, and the rest, including refrigeration, lighting, and cooling
has the lowest range of household energy consumption, under 7% each.
In terms of greenhouse gas released, the proportion of water heating and other
appliances takes priority and becomes the primary causes, with about 32% and 28%
respectively. In comparison, this figure for heating and refrigeration is lower, around
15% each. Both cooling and lighting contribute to one-tenth of total gas emissions.
Writing Task 1 – Test 2 – Cam 10
These tables present the amount of money earned from selling coffee and bananas in
two years, 1999 and 2004 in five European countries.
Overall, it is clear that the data on selling coffee displayed an upward tendency in
five years from 1999 to 2004, while as for selling bananas, this figure for Sweden
and Denmark was a downward trend in the same period.
In 1999, Switzerland earned 3 million euros from selling coffee, followed by around
1.5 and 1.8 million euros in UK and Denmark respectively. Five years later, there
was a dramatic increase in purchasing coffee in the UK, with its number reaching a
peak at 20 million euros. The other countries also rose by around 0.2 and 3 million.
Regarding selling bananas, the amount of money Switzerland earned from banana
sales was 15 million euros in 1999 and the grew rapidly over 3 times in 2004, to 47
million. The UK and Belgium had significant growth in their sales at 5.5 million and
4 million respectively, while this figure for Denmark shapely dropped from 2
to 0.9 at the end of the research period. lOMoARcPSD|49830739
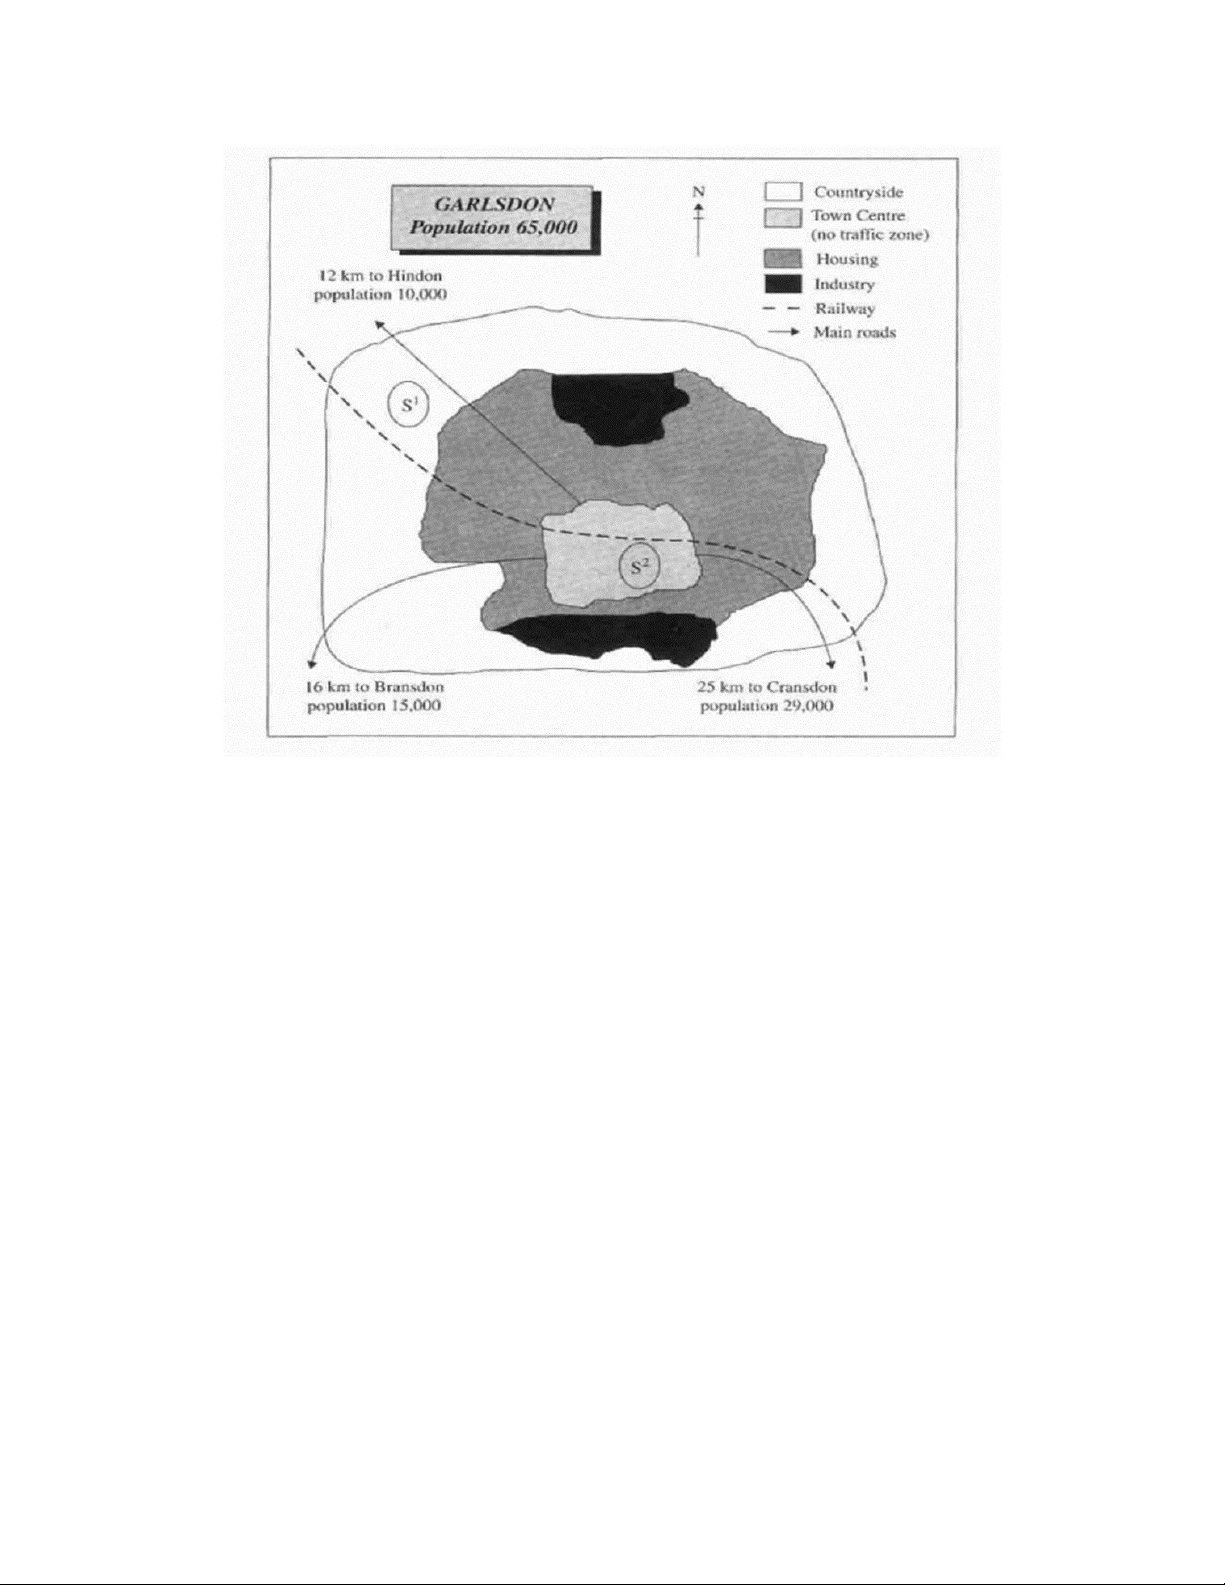
The picture illustrates two potential areas for constructing a supermarket in a town called Garlsdon.
Overall, it can be seen from the map that the first possible location for a supermarket
(S1) is in the countryside, with plenty of space for cars or agriculture and while the
second one (S2) is situated in the center of the town. Both supermarket sites are close
to the railway that runs through Garlsdon from Hindon to Cransdon.
According to the first plan, S1 is in a rural area to the Northwest of Grarlson and
close to the housing area. Moreover, it is next to the main road that is about 12km to
the northwest of Hindon. The site could be accessed easily by populations from both
Garlsdon and Hindon (65000 and 10000 relatively). However, the Cransdon
residents have a little bit of difficulty because of the distance and they only travel to this site by train.
By contrast, S2 is in the town centre which is surrounded by the residential area. It
is not only convenient for the local people of Garlsdon to shop but it could also be
reached by road from Bradson (15km to the southwest with its 15000 residents) or lOMoARcPSD|49830739
railway from Cransdon (25km to the southeast). Whereas, it is difficult to access S2
by car because of no traffic zone on this site.