Writing Task 1 Vocabulary Guide môn English | Trường Đại học Khoa học Tự nhiên, Đại học Quốc gia Thành phố Hồ Chí Minh
All Rights Reserved. No part of this publication may be reproduced,distributed, or transmitted in any form or by any means, including photocopying, recording, or other electronic or mechanical methods. Tài liệu giúp bạn tham khảo ôn tập và đạt kết quả cao. Mời bạn đọc đón xem!
Môn: English (CS105) 25 tài liệu
Trường: Trường Đại học Khoa học tự nhiên, Đại học Quốc gia Thành phố Hồ Chí Minh 1.1 K tài liệu
Tác giả:


Preview text:
lOMoAR cPSD| 59994889 lOMoAR cPSD| 59994889 C
opyright © 2021 ESL FLUENCY .
All Rights Reserved. No part of this publication may be reproduced, distributed, or
transmitted in any form or by any means, including photocopying, recording, or other
electronic or mechanical methods, without the prior written permission of the publisher,
except in case of brief quotations embodied in critical rev ie ws and certain other
noncommercial uses permitted by copyright law.
Any references to places or nationalities in this document have been used fictitiously . Such
words have been used only to describe data in the diagrams. www.eslfluency.com 2 lOMoAR cPSD| 59994889 Contents Title Page
Line Graph ………………………………………………………………………………………………………………………………………… 5
Pie Chart …………………………………………………………………………………………………………………………………………… 12
Prediction …………………………………………………………………………………………………………………………………………. 15
Comparison ………………………………………………………………………………………………………………………………………. 17
Map ……………………………………………………………………………………………………………………………………………. 19
Process ……………………………………………………………………………………………………………………………………………… 23 3 lOMoAR cPSD| 59994889 Introduction
Who is this ebook for?
Vocabulary For IELTS Academic Writing Task 1 will help IELTS test takers learn the language they need to
describe trends, maps, and processes in diagrams. All the words and phrases are used in a variety of
examples to help the reader learn different ways of describing such data. How to use this book?
This is not a book of sample task 1 reports. It is a collection of words and phrases used in isolated
sentences. Think of it as a pocket dictionary of task 1 vocabulary. Read the examples and learn how they
are used in a sentence. Then try to describe the diagrams in your writing using those words and phrases.
Where can I find well-written samples for task 1?
You can find sample reports for all types of diagrams on eslfluency.com. Visit this page to read the samples.
Will I score higher if I use these vocabulary items only in simple sentences?
In order to score high in the exam, you need to use a variety of sentence structures (simple, compound,
complex, and compound-complex). Using only simple sentences will result in low scores.
Should I discuss all the trends and numbers in the chart?
When there are too many figures in the task, you need to identify the important ones and discuss the main trends.
You don’t need to mention all the figures to score high; however, you should mention at least one trend for each
category to achieve a high band score for your task response. 4 lOMoAR cPSD| 59994889
Note: This ebook was written in the Autumn of 2021, so in the diagrams, years like 2022 or 2030 are
considered to be in the future.. Line Graph
Important Note: The purpose of this document is to show you how you can use different vocabulary
items to explain the data in diagrams. The sentences are isolated to make them easier to understand;
therefore, the categories are not grouped, and there are no paragraphs. However, in the exam, you need
to group the categories logically and use paragraphs to write your report. If you want to see how you can
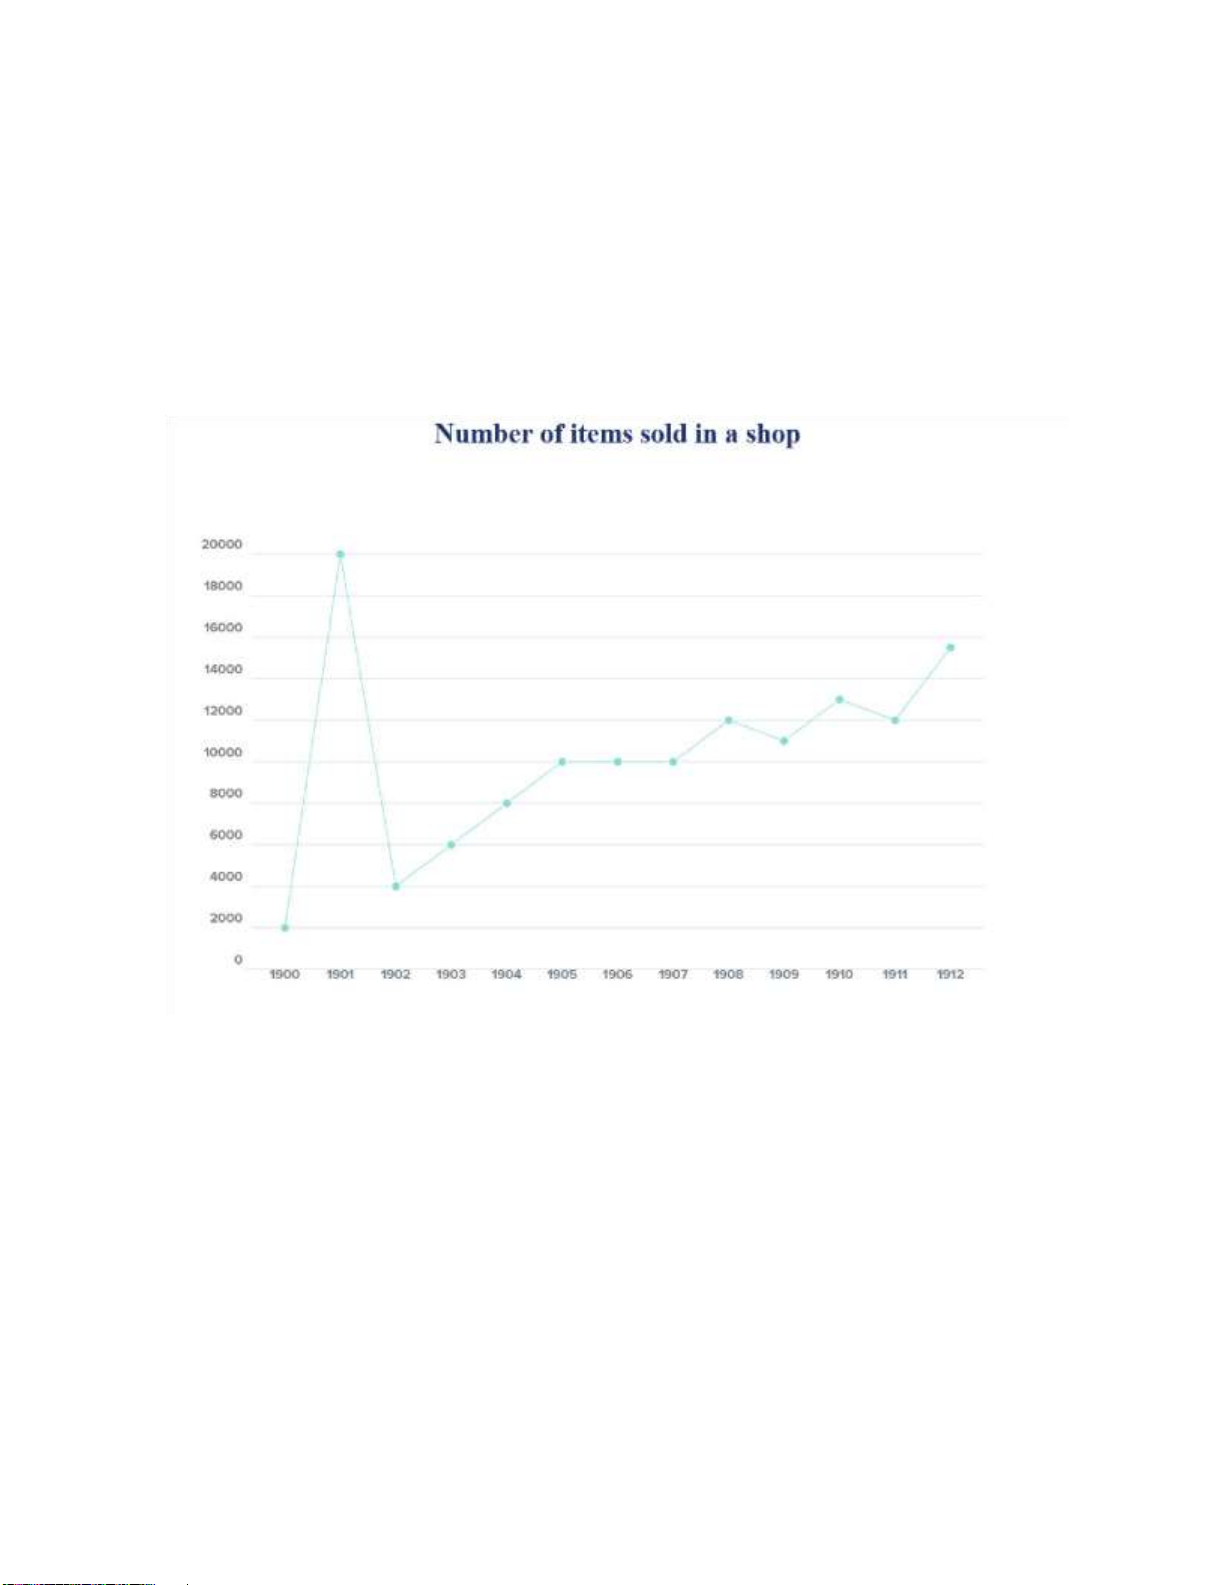
use these sentences together to form a well-written report, read the samples on this webpage. From 1900 to 1901: 5 lOMoAR cPSD| 59994889
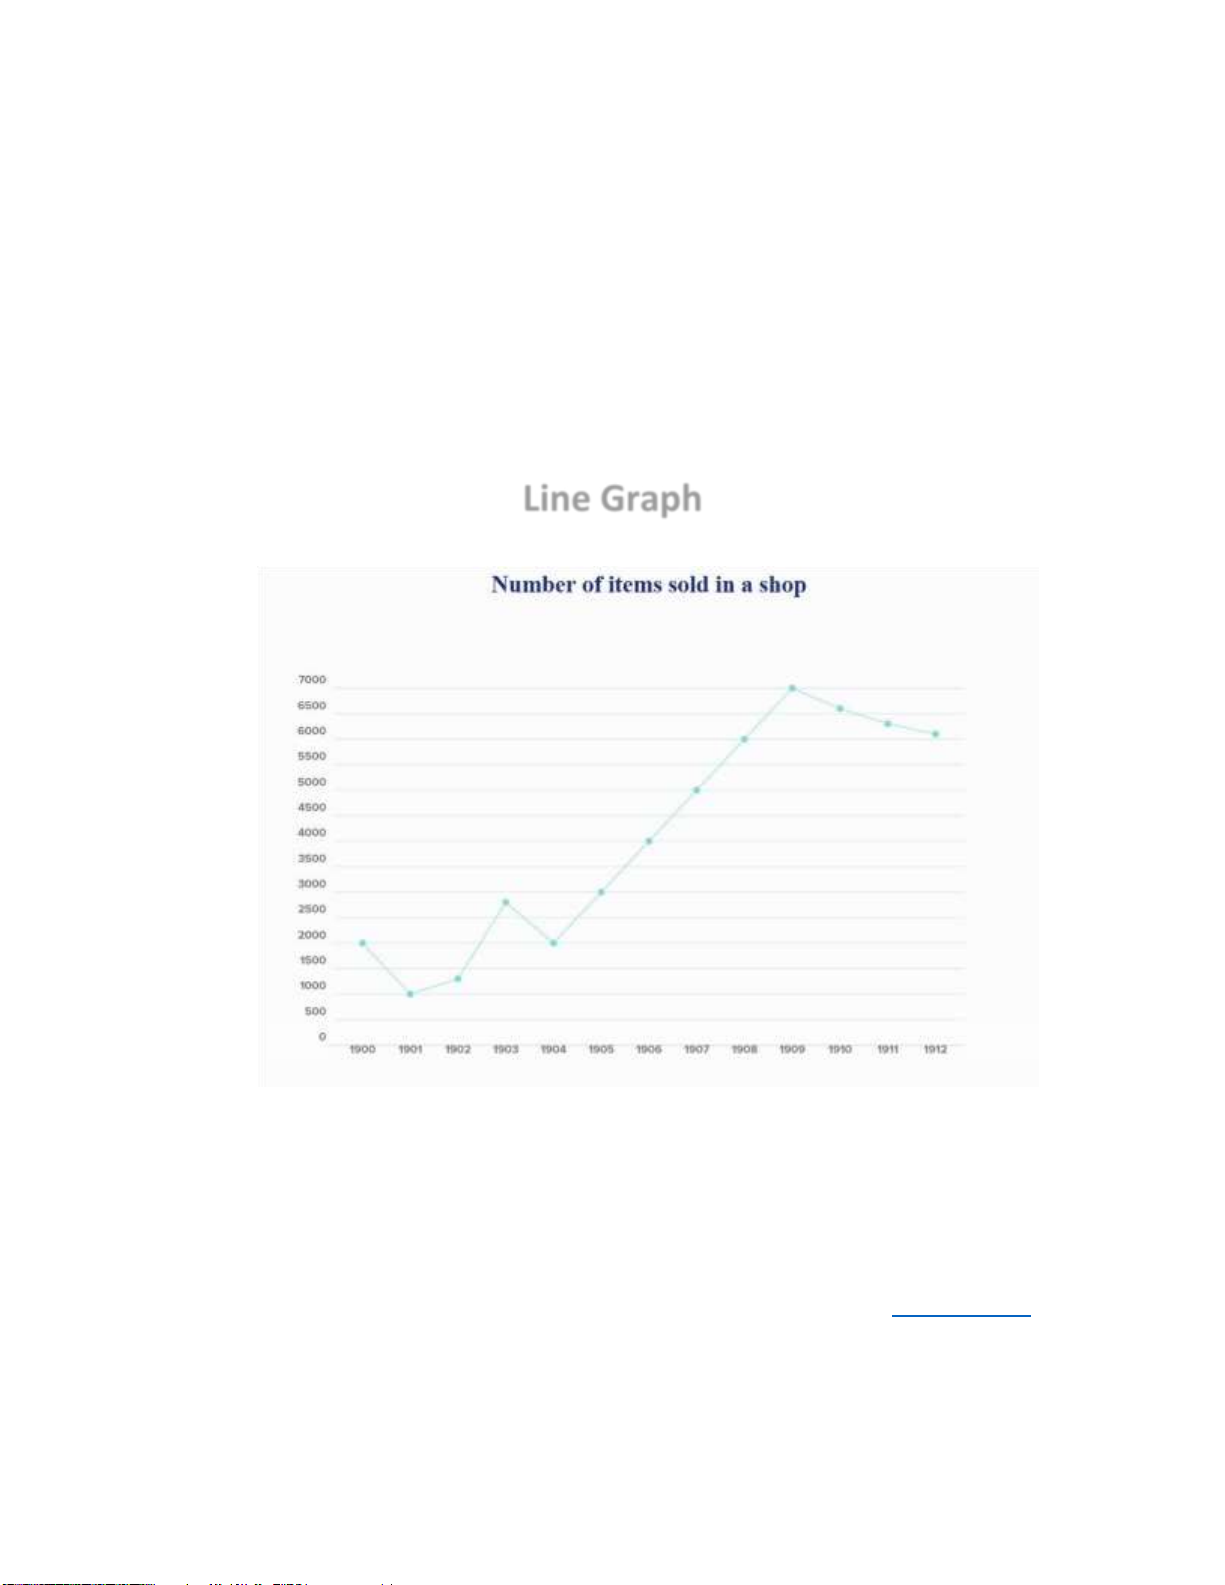
In the year 1901, the number of items sold halved from the initial figure of 2,000.
A year later, the volume of items sold declined by 50%. From 1901 to 1902:
There was an insignificant increase in the sales volume from the year 1901 to 1902.
The shop saw a fractional improvement in its sales figures from the year 1901 to 1902. From 1902 to 1903:
Over the next twelve months, the figures almost doubled.
Over the next twelve months, the figures climbed from approximately 1,500 to a little under 3,000.
From 1902 to 1903, the numbers saw a rapid increase and stood at well over 2,500. From 1903 to 1904:
The figures declined by almost 1,000 units from the year 1903 to 1904. From 1904 to 1909:
Sales boomed within the next five years, and the figures reached their highest level at 7,000.
The business then went into a booming period of five years, and the numbers
reached a peak of 7,000. From 1909 to 1912: 6 lOMoAR cPSD| 59994889
There was a downturn in the figures from the year 1909 to 1912, but they finally
settled at just over 6,000.
There was a moderate decrease in the sales volume over the subsequent years.
Vocabulary Definitions:
Halve : to reduce something by a half
Fractional: very small in amount
Well: a lot, or to a great degree
Boom: a quick increase of business activity
Peak (n): the time when something is greatest, highest, most successful, etc.
Peak (v): to reach the highest point or level
Stand at: to be at a particular level or amount 7 lOMoAR cPSD| 59994889
Settle: to move to a lower level and stay there
Downturn: a period or process in which business activity, production, etc. is reduced and
conditions become worse OPP upturn From 1900 to 1901:
The sales figures increased dramatically and peaked at 20,000 in the year 1901.
The sales figures saw a dramatic increase within the first twelve months and reached a peak of 20,000.
The sales volume experienced a significant rise from 1900 to 1901.
The The number of items sold experienced a sharp rise from 1900 to 1901.
The figures soared from the initial 2000 to 20,000 from the year 1900 to 1901. 8 lOMoAR cPSD| 59994889
The figures increased steeply and reached a peak of 20,000 in the year 1901. From 1901 to 1902:
The sales numbers decreased dramatically from 20,000 in 1901 to 4,000 in 1902.
The number of items sold saw a dramatic decrease from 20,000 to 4,000 between the years 1901 and 1902.
The shop saw a marked decrease in its sales volume from 20,000 to 4,000 between the years 1901 and 1902.
The sales figures plummeted/plunged from 20,000 in 1901 to 4,000 in 1902.
The sales numbers decreased sharply from 20,000 to 4,000 between the years 1901 and 1902.
The sales figures experienced a significant decrease from 20,000 to 4,000 within the next twelve months. From 1902 to 1905:
Over the next three years, the figures increased steadily to 10,000. 9 lOMoAR cPSD| 59994889
The sales figures recovered to some extent from the previous fall to 10,000 in the year 1905.
Over the next three years, the figures managed a steady recovery and stood at/reached 10,000.
Over the subsequent three years, the figures saw a steady increase and reached 10,000. From 1905 to 1907:
The sales volume reached a plateau of 10,000 in the year 1905 and remained
unchanged for the next two years.
The sales figures then plateaued at 10,000 from 1905 to 1907.
The figures leveled out at 10,000 for the next two years.
The sales volume remained static from 1905 to 1907. From 1907 to 1912:
The figures then went into a period of upward fluctuation and stood at just under
16,000 at the end of the period.
Over the subsequent years, the figures fluctuated, but the trend was upward.
Over the subsequent years, the figures experienced a period of instability but finally
stood at a little under 16,000.
Vocabulary Definitions:
Soar: to increase quickly to a high level 10 lOMoAR cPSD| 59994889
Steeply: by a very large or sudden amount
Marked: very easy to notice SYN noticeable
Plummet: to suddenly and quickly decrease in value or amount
Plunge: to suddenly decrease by a large amount
Steadily: gradually and continually
Recover: to increase or improve after falling in value or getting worse
Plateau (n): a period during which the level of something does not change
Plateau (v): if something plateaus, it reaches and then stays at a particular level.
Level out: to stop rising or falling and become steady
Static: not moving, changing, or developing
Fluctuation: a situation in which prices, levels or interest rates go up and down
Instability: the condition of being likely to change, especially unexpectedly
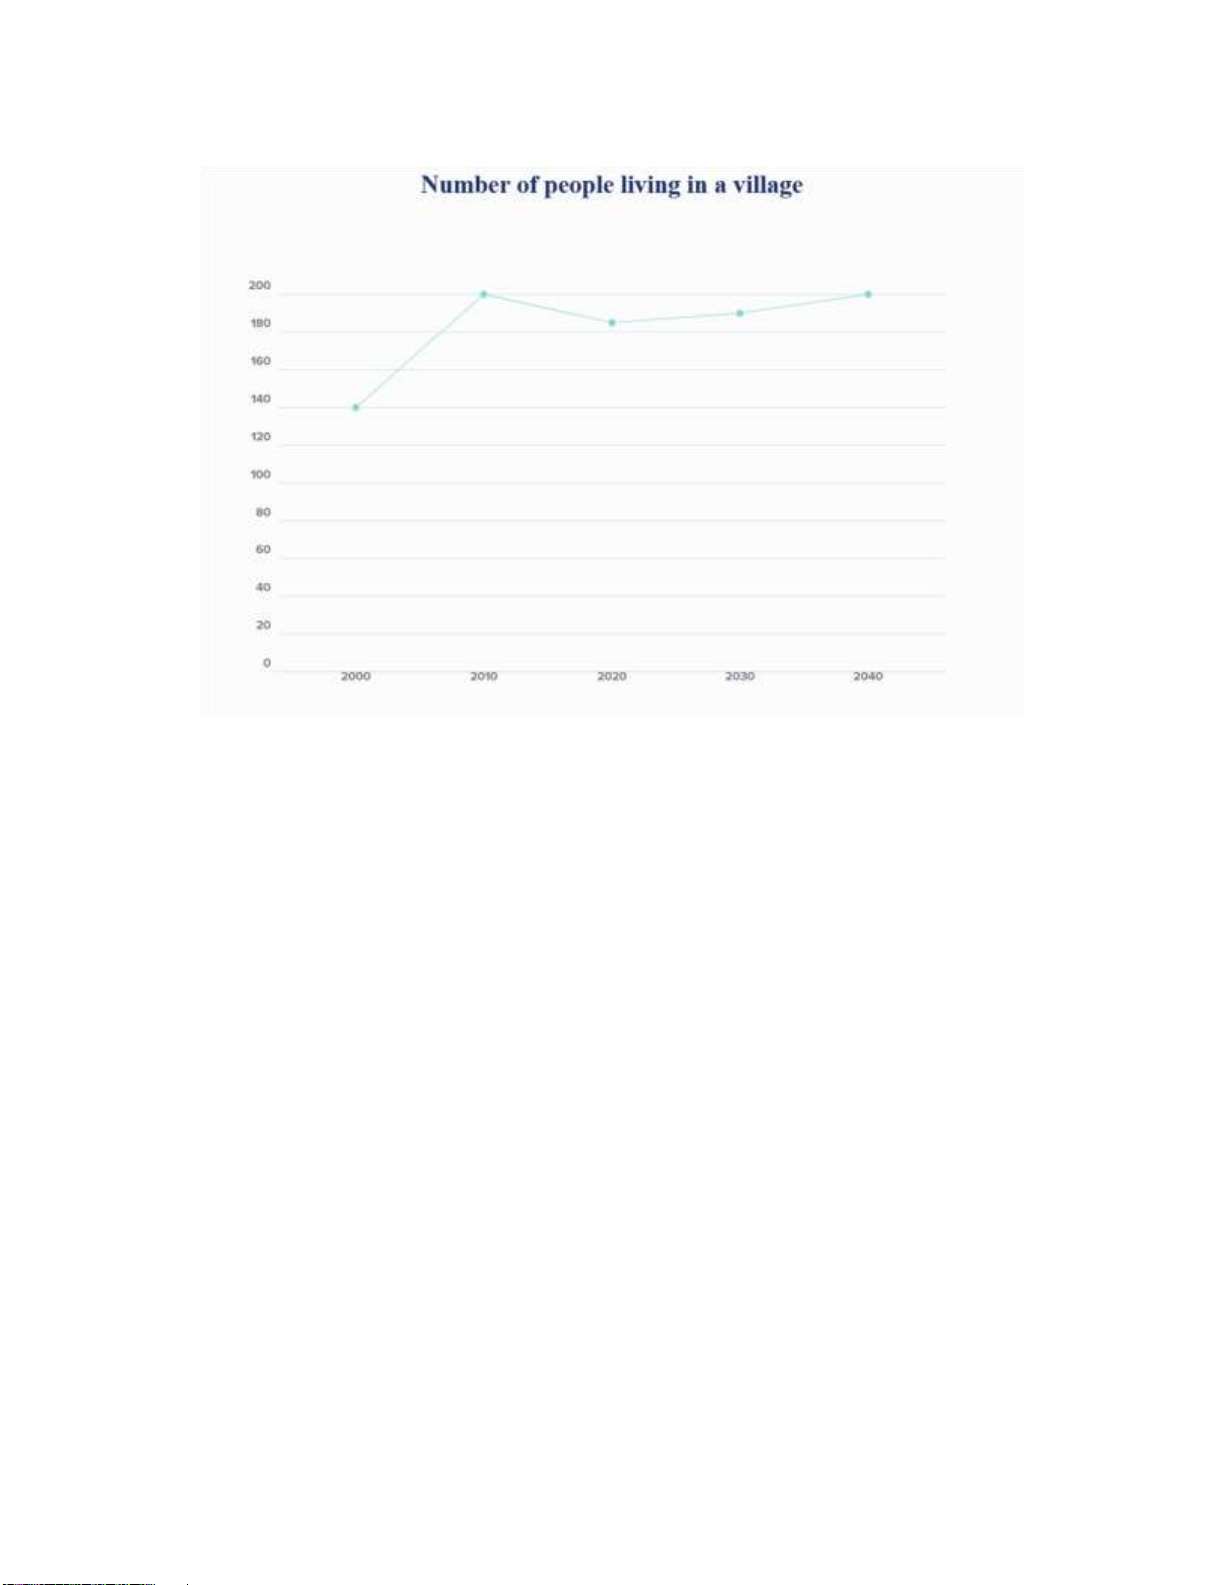
Dip: If an amount or level dips, it becomes less, usually for just a short time. 11 lOMoAR cPSD| 59994889 From 2000 to 2010:
The number of people residing in the village experienced a steady increase over the first decade.
We can see that 140 people lived in the village in the year 2000, but this figure
climbed gradually over the next ten years and stood at 200. From 2010 to 2020:
The figures then experienced a dip in 2020.
The number of residents declined a little in 2020.
The figures decreased gradually over the next decade. From 2020 to 2040:
The figures are expected to recover for the next 20 years and reach the same level as they were in 2010.
The numbers are predicted to go into a period of steady increase and stand at 200 once again in the year 2040. 12 lOMoAR cPSD| 59994889 Pie Chart
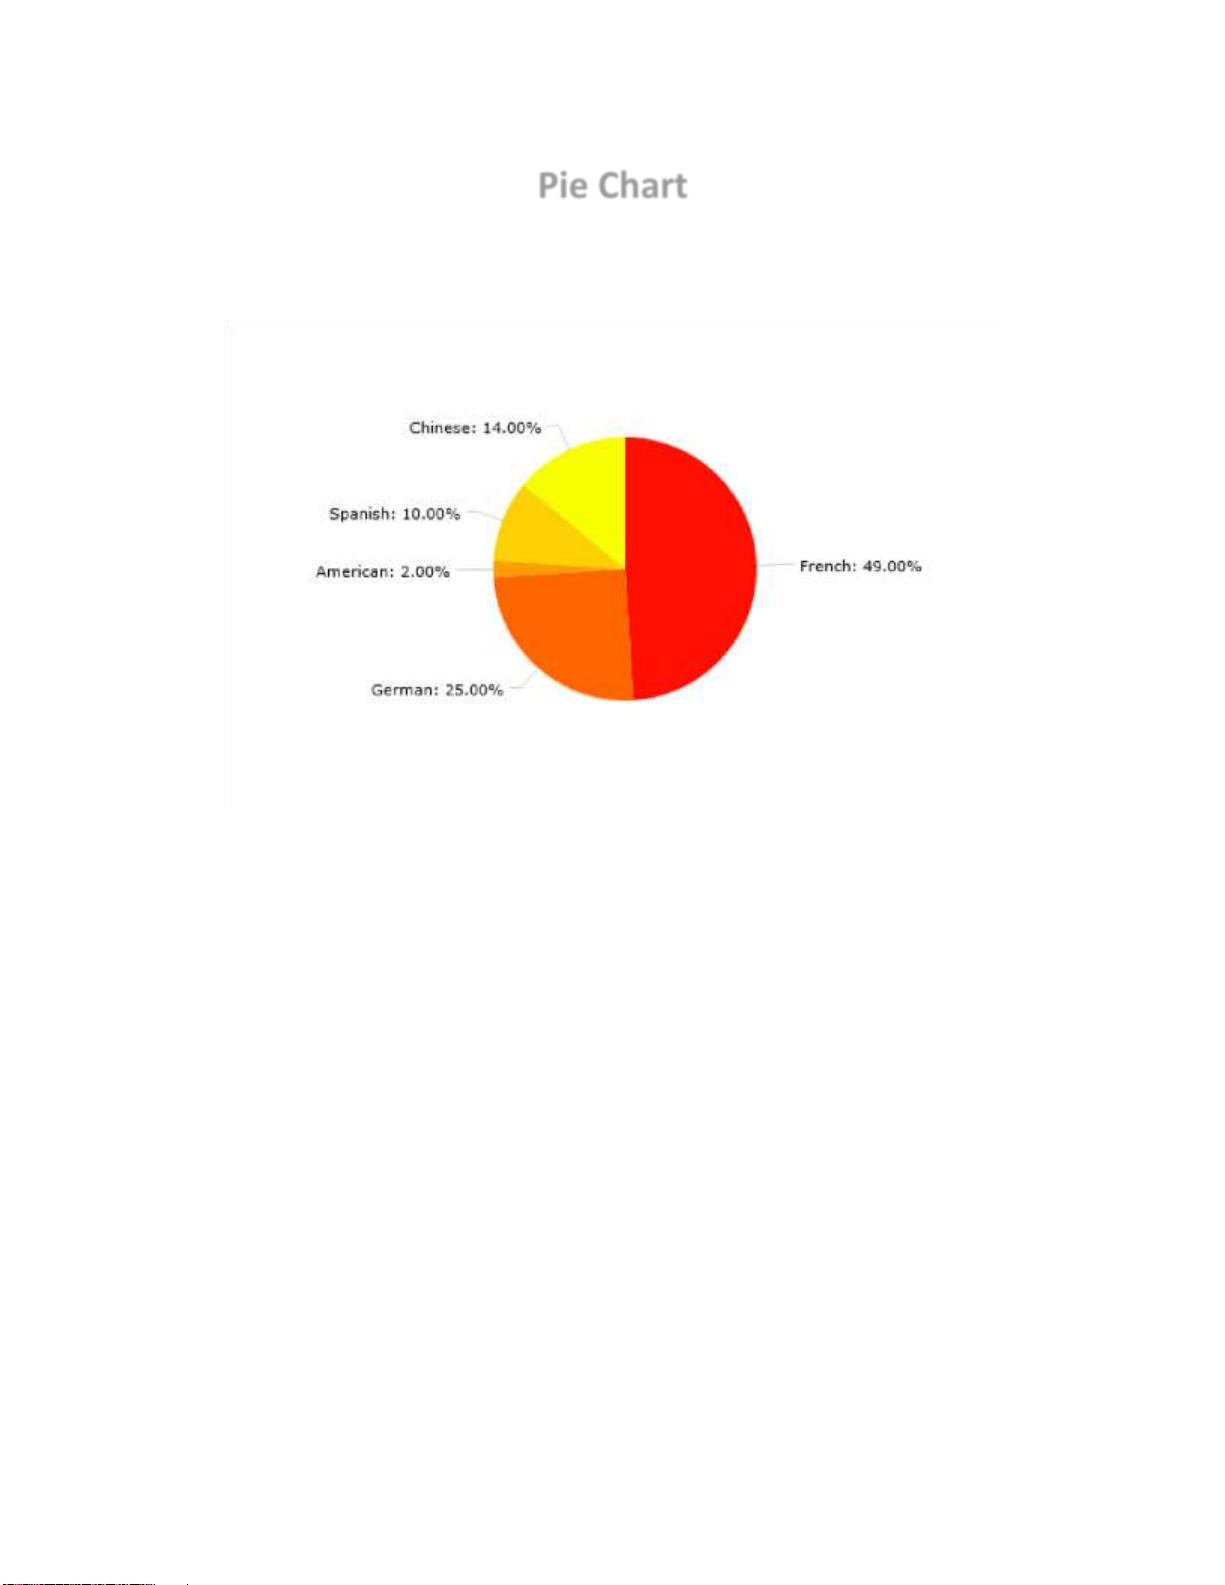
Percentages of students at a school based on their nationalities
The majority of students come from Europe.
Nearly half of the students at the school are French.
Just under 50% of the students are French.
Exactly a quarter of students are from Germany.
An insignificant minority is from the U.S.A.
American students account for an insignificant proportion.
Only a tiny fraction of the students are US citizens.
One-tenth of the students are Spanish.
Chinese students account for only 14% of the learners at the school.
Almost three in twenty students are Chinese. 13 lOMoAR cPSD| 59994889
Warning: While using the structure in the last sentence is good for variety, you should not go overboard with it.
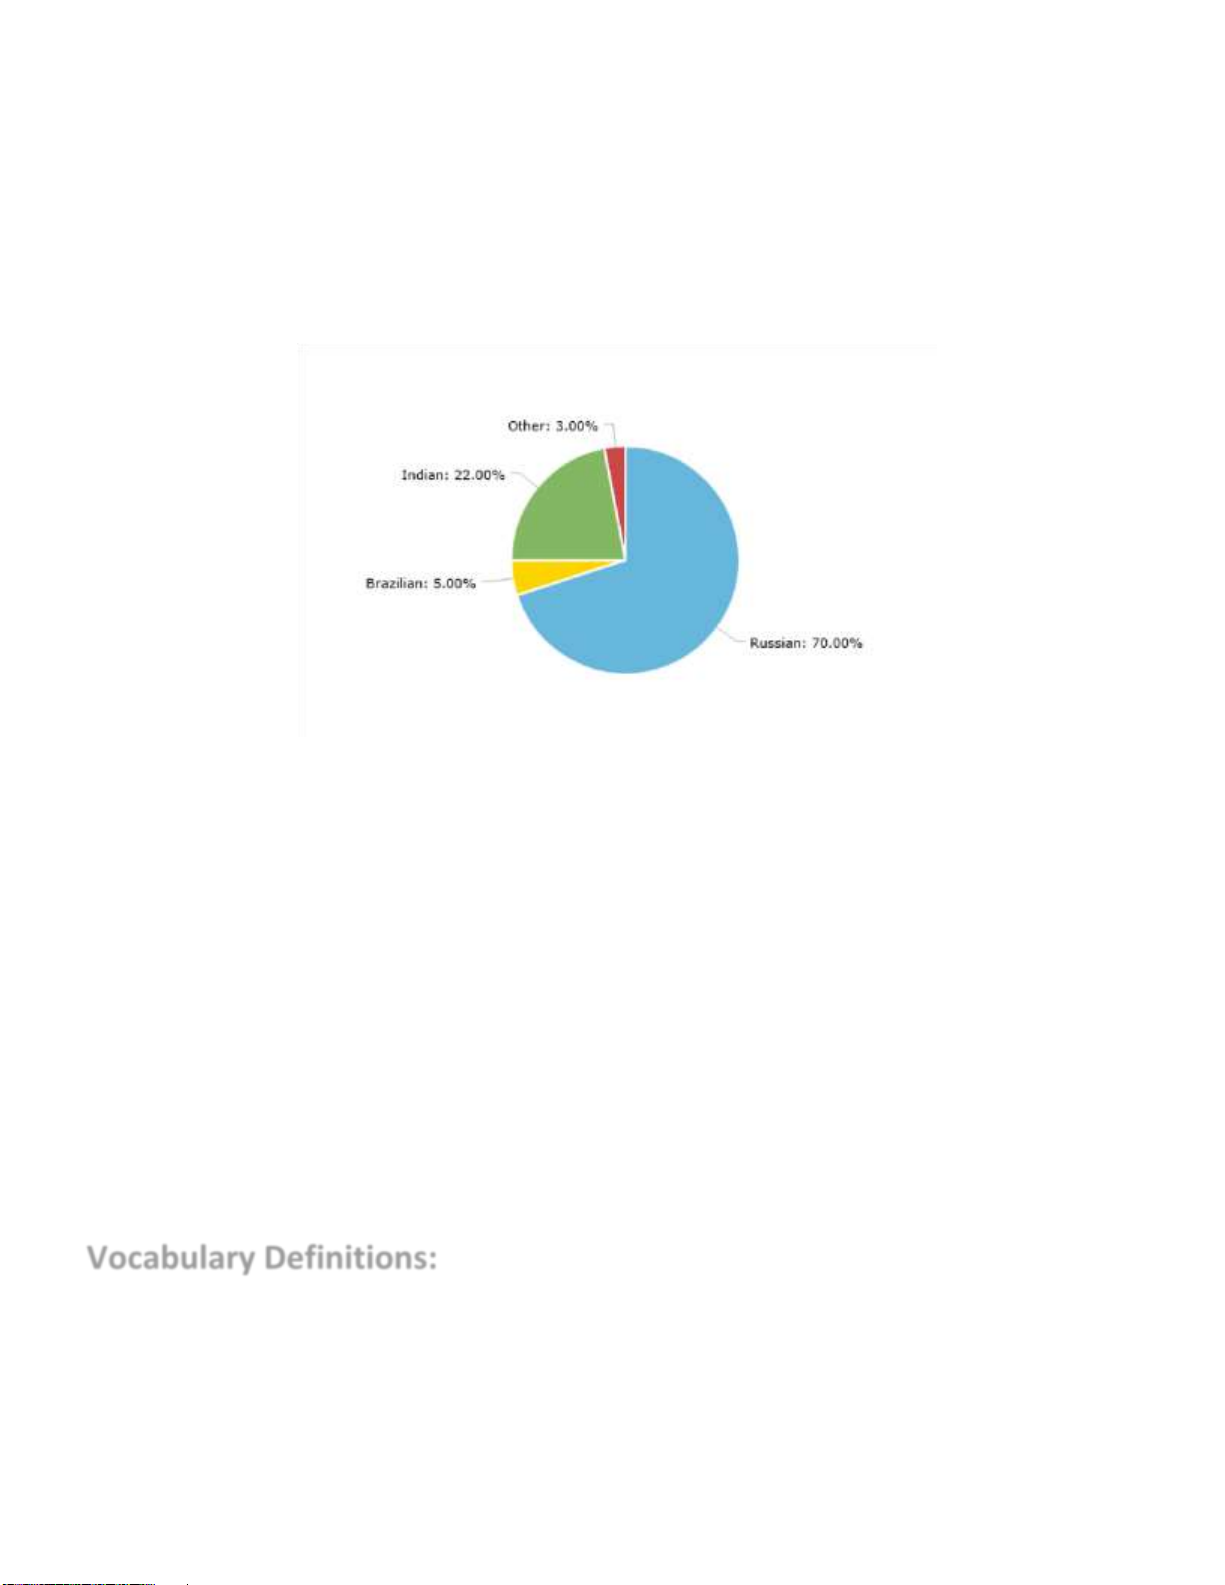
Proportions of students at a school based on their nationalities in the year 2010
An overwhelming majority of the students were Russian.
An overwhelming majority came from Russia.
Over two-thirds of the students were Russian citizens.
Roughly one in five students came from India.
The figure for Indian students came second at 22%.
Only a modest 5% of the learners were Brazilian.
Only a mere 5% of the students came from Brazil.
Only 3% of the students came from other nations.
Vocabulary Definitions:
An overwhelming majority: Percentages around 70% or more. 14 lOMoAR cPSD| 59994889 Roughly: approximately
Modest: not large in size or amount
Mere: used to emphasize how small or unimportant something or someone is Proportions
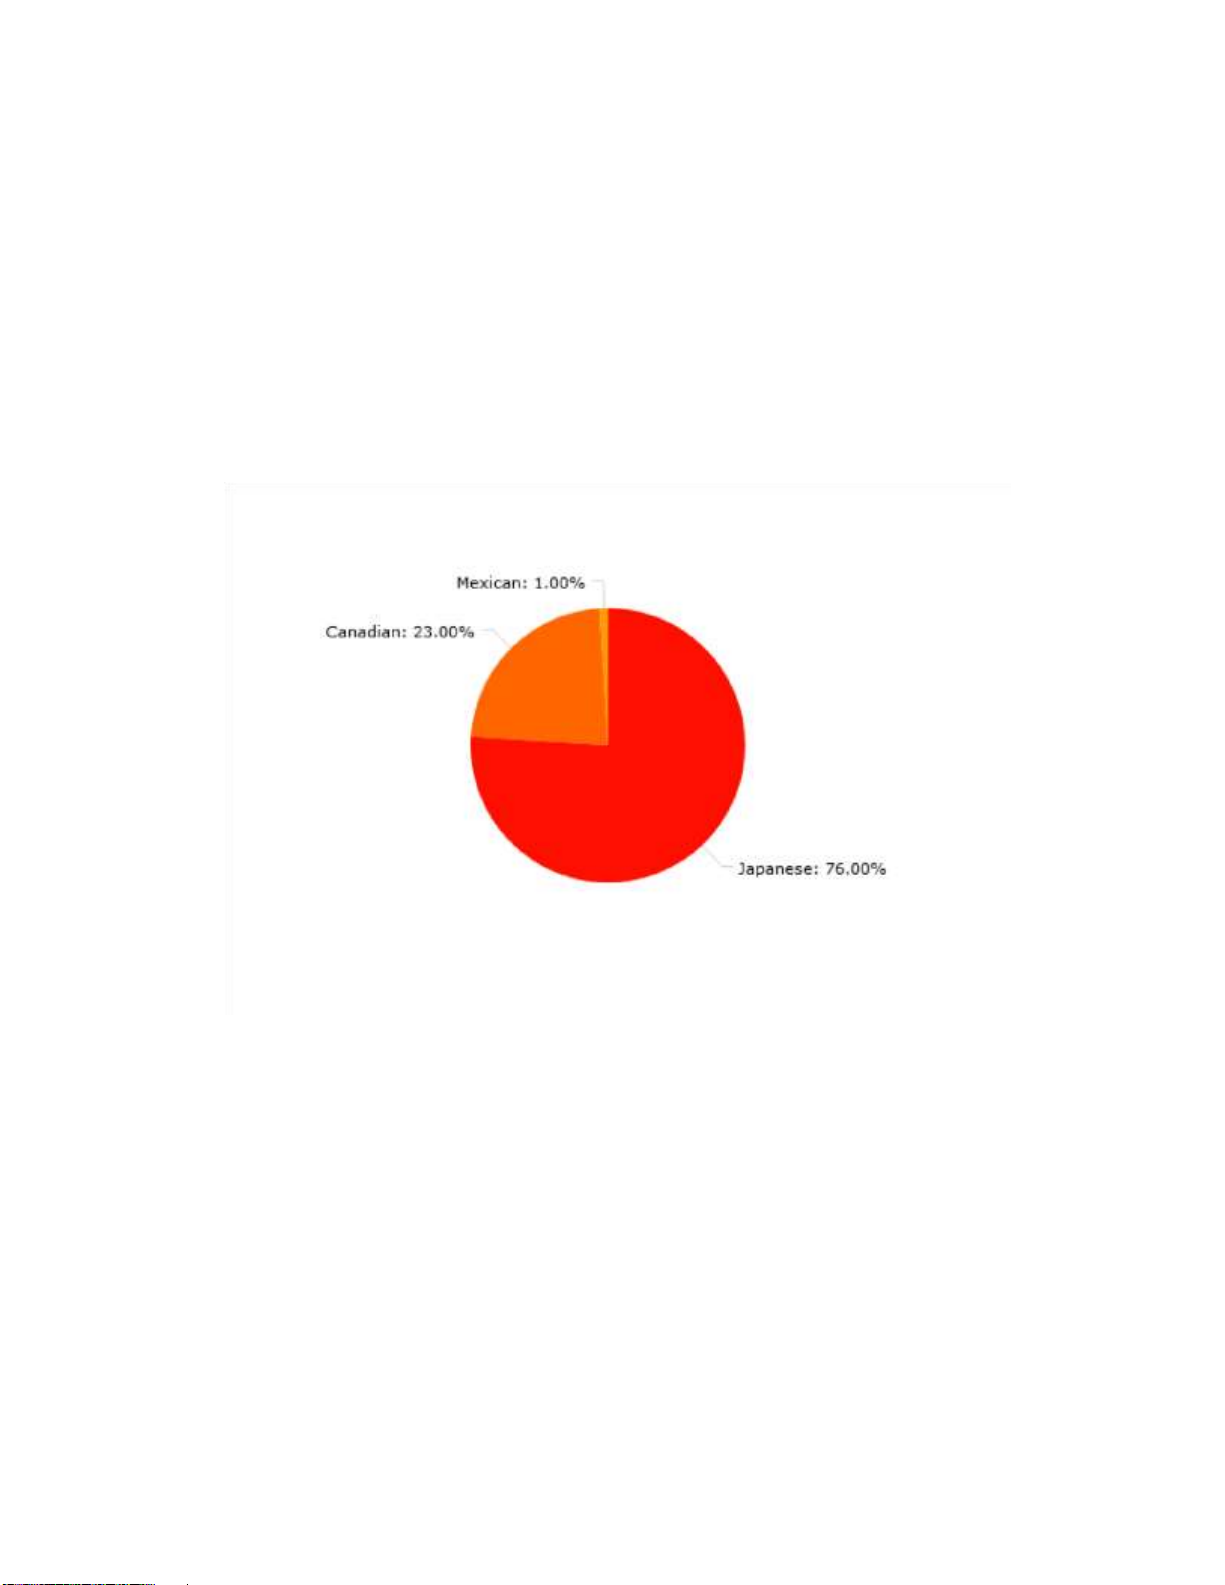
of students at a school based on their nationalities in the year 2010
Just over three-quarters of the students came from Japan.
Canadian students accounted for almost a quarter of all the students.
The figure for Mexican students was negligible.
The figure for Mexican students, who accounted for a mere 1% of all the learners, came last. 15 lOMoAR cPSD| 59994889
A tiny fraction of the students came from Mexico.
Vocabulary Definitions:
Account for: to form a particular amount or part of something
Negligible: too slight or small in amount to be of importance Prediction
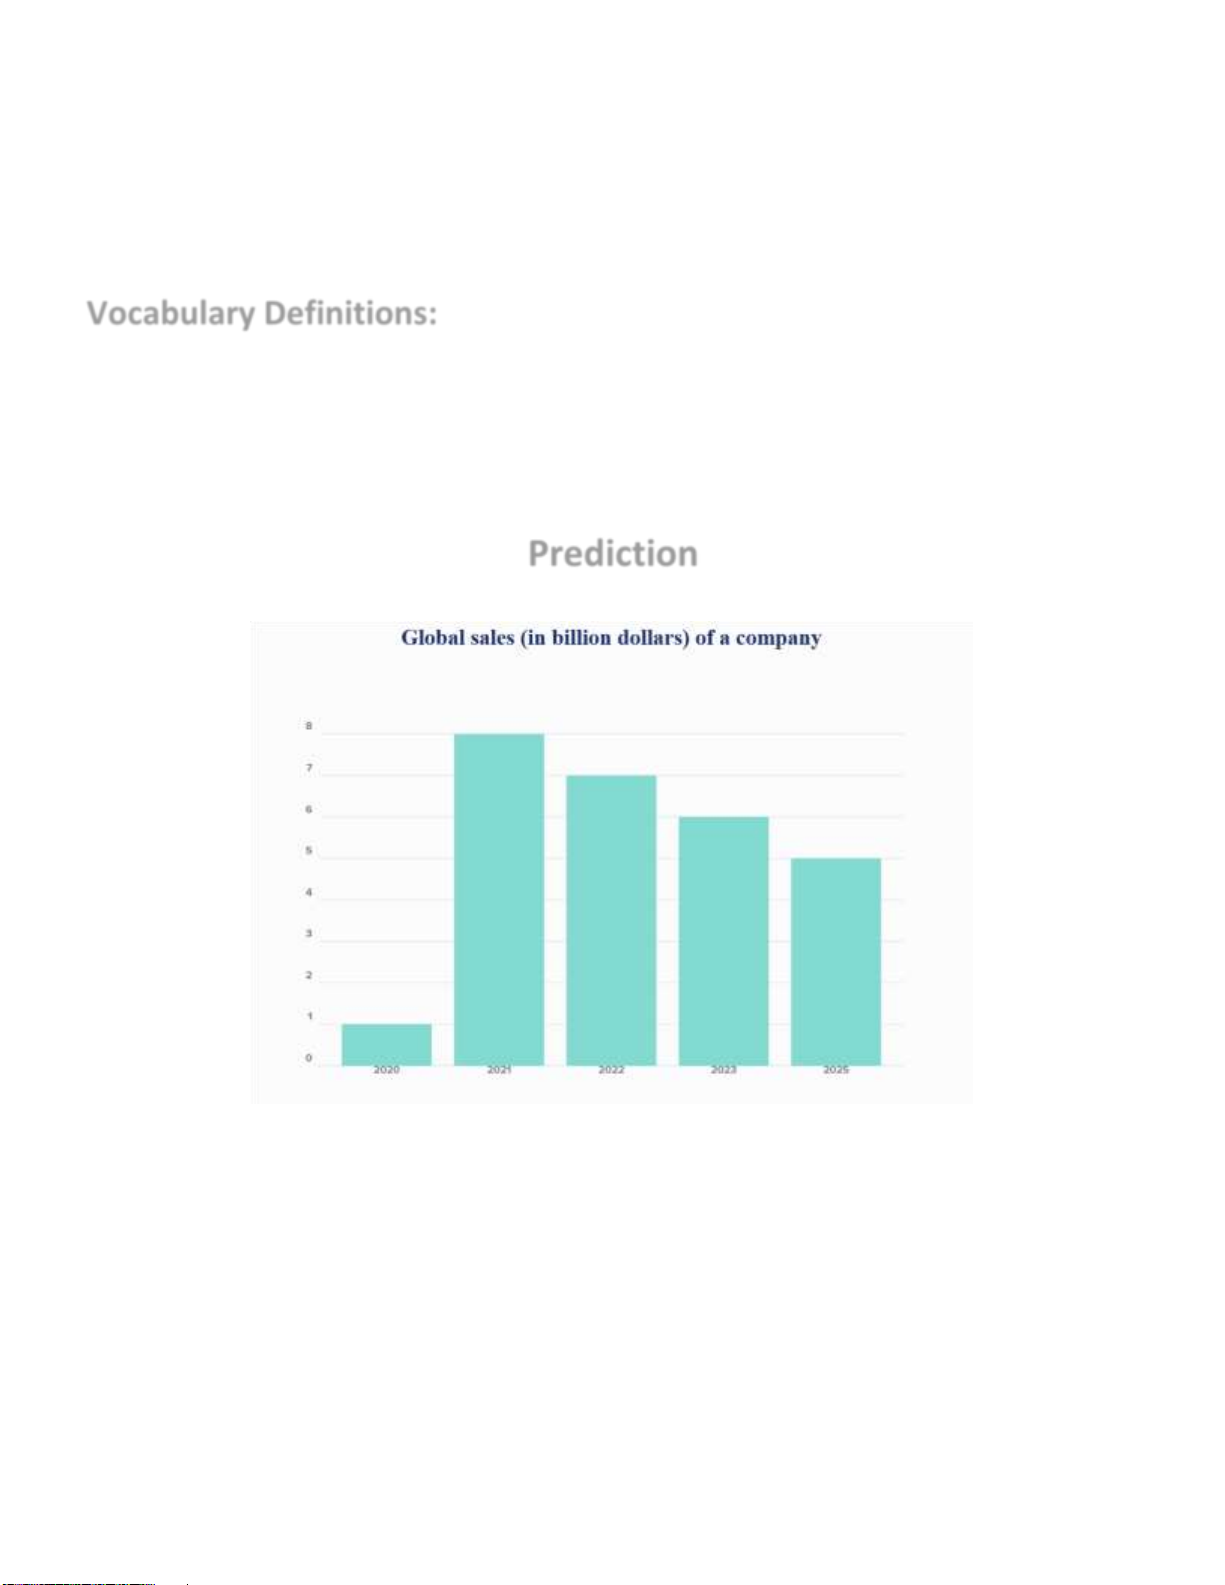
The sales figures were at their lowest level ($1 billion) in the year 2020.
The company experienced a boom in the business and sold $6 billion worth of goods in 2021.
The company is projected to experience a gradual decrease in its figures for the foreseeable future. 16 lOMoAR cPSD| 59994889
It is estimated that the figures will begin to decrease gradually for the rest of the period.
It is predicted that the company will begin to see a continual decline in its turnover over the next three years.
The company is expected to see a gradual decline in its sales figures for the next three years.
Predictably, the figures will decrease each year for the foreseeable future.
It is likely that the figures will decrease
Vocabulary Definitions:
gradually for the foreseeable future.
The percentages are forecast to decline
steadily over the subsequent years until 2025. have now
Project (v): to calculate what it exactly
something will be in the future, using
Predict : to say that something is likely to happen .
the information you Estimate (v): to try
Expect: to think that something will happen
to judge the value, size, speed, or cost of something without calculating 17 lOMoAR cPSD| 59994889
* Expect is usually more certain than predict.
Likely: something that is likely will probably happen
For the foreseeable future: for as long as it is possible to know what is likely to happen
Forecast (v): to make a statement saying what is likely to happen in the future, based on the
information that you have now SYN predict Comparison
The questionaire was done in the year 2018
The commute mode choice based on gender in a city Mode of commute Women Men 18 lOMoAR cPSD| 59994889 Walking 500 60 Car 800 1750 Public transportation 555 545 Bicycle 1600 550 Other 45 595 Total 3500 3500
Significantly more men than women preferred using cars over other means of transportation.
The figure for men who preferred cars to commute to work was at 1750, which was
even more than twice as high as that of women.
Half of the men chose cars as their preferred mode of transportation. By contrast,
most of the women weren’t that keen on using them, as only 800 out of 3500 female
respondents chose that option.
In the questionnaire, the car was chosen by more men than women.
Based on this questionnaire, we understand that women are more likely than men to ride a bicycle to work.
Almost 600 men chose other means of transportation as their answer, while the
corresponding figure for women was considerably lower at 45. 19 lOMoAR cPSD| 59994889
Based on the questionnaire, we understand that men are less likely than women to
commute to work on foot because only 60 men chose walking, while the number for women was at 500.
The figures for public transportation were in the vicinity of 550 for both women and men.
Almost as many women as men (around 550) preferred public transportation to commute to work.
Bicycles were a lot more popular among women than men, as the figure for the
former was at 1600 and for the latter 550.
Approximately three times more women than men chose bicycles as their preferred commute mode.
Women liked to commute to work by bicycle more than men did. 20
Tài liệu liên quan:
-

Sách Grammar Practice for Elementary Students with key môn English | Trường Đại học Khoa học tự nhiên, Đại học Quốc gia Thành phố Hồ Chí Minh
38 19 -
Grade 3 Adverbs HW Worksheet: Exploring How Adverbs Work môn English | Trường Đại học Khoa học Tự nhiên, Đại học Quốc gia Thành phố Hồ Chí Minh
125 63 -
Grade 3 Verb Worksheets: Understanding and Identifying Verbs môn English | Trường Đại học Khoa học Tự nhiên, Đại học Quốc gia Thành phố Hồ Chí Minh
136 68 -
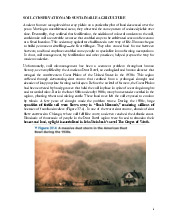
Soil Conservation & Sustainable Agriculture: Classwork July 1st môn English | Trường Đại học Khoa học Tự nhiên, Đại học Quốc gia Thành phố Hồ Chí Minh
115 58 -
SPEAKING 5 - Midterm Video Clip Review & Discussion môn English | Trường Đại học Khoa học Tự nhiên, Đại học Quốc gia Thành phố Hồ Chí Minh
138 69