Method of analysis for determination of The chromium (cr) species in water samples by Spectrophotometry with diphenylcarbazide | Tài liệu Tiếng Anh
Method of analysis for determination of The chromium (cr) species in water samples by Spectrophotometry with diphenylcarbazide | Tài liệu Tiếng Anh. Tài liệu giúp bạn tham khảo, ôn tập và đạt kết quả cao. Mời đọc đón xem!
Môn: Tiếng Anh chuyên ngành 332 tài liệu
Trường: Tài liệu Tiếng Anh chuyên ngành, Tiếng Anh cho người đi làm 432 tài liệu
Tác giả:


Preview text:
Journal of Environmental Engineering & Sustainable Technology JEEST
Vol. 05 No. 01, July 2018, Pages 37-46 http://jeest.ub.ac.id
METHOD OF ANALYSIS FOR DETERMINATION OF
THE CHROMIUM (Cr) SPECIES IN WATER SAMPLES BY
SPECTROPHOTOMETRY WITH DIPHENYLCARBAZIDE
Adam Wiryawan1), Rurini Retnowati1), R.Y. Perry Burhan2), Syekhfani3)
1) Department of Chemistry, Faculty of Sciences, Brawijaya University, Malang, East Java 65145 Indonesia. email: adammipa@ub.ac.id
2) Department of Chemistry, Institut Teknologi Sepuluh November (ITS), Surabaya, East Java 60122 Indonesia
3) Department of Soil Sciences, Faculty of Agriculture, Brawijaya University, Malang, East Java 65145 Indonesia
clinical, biology, agriculture and in controlling ABSTRACT
the quality of waste water, natural water, and
Speciation of Chromium (Cr) is very
drinking water because of the toxicity of these
important because of the toxicity of these
metals depending on the oxidation number.
metals depending on the oxidation number and
Chromium is one of the most frequently
its concentration is very low in the water
detected contaminants in groundwater (Lan, et
system. Chromium occurs in the environment al., 2005).
primarily in two valence states, trivalent
Toxic chromium enter into the water
Cr(III) and hexavalent Cr(VI). Chromium (III)
system, derived from nature and from waste or
is an essential micro-nutrients for the human
industrial waste such as metal industrial waste
body, while the Cr(VI) is highly toxic and
water, electroplating, wood preservation,
carcinogenic. Chromium(VI) in the water can fertilizers, leather preservation industry
be analyzed by spectrophotometry with
(Capeans, et al., 2005). In the marine
diphenylcarbazide as the reagent on pH=1 at
environment, species Cr(VI) are in the form of
the maximum wavelength of 540 nm. The CrO 2-
4 or HCrO4-. While Cr(III) is in the form
experimental result showed that Cr(VI) could
of hydroxide compounds as Cr(OH) (3-n)+ n . The
be analyzed using diphenylcarbazide in the
average concentration of total chromium in the
concentration of 0.0015% and H3PO4 solution
sea water and rain water row by 0.2 to 1 gL-1
as acidic in 0.03 mol/L. The absorbance was
and 0.04 to 0.5 mgL-1. Total chromium
measured at minutes 5 after preparation. There
concentrations in surface water of 0.5 to 2 gL-1,
was interference from ion Fe(III) at least 6.0
where the dissolved chromium in the form of
ppm and this interference could be overcome
0.02 to 0.3 mgL-1 (Motomizu, et al., 2015 ;
by 0.3 % NaF solution. The limit of detection Gomez & Callao, 2006).
of this method was the samples, the mix of
Chromium is an element that is abundant
Cr(III) and Cr(VI), could be analyzed by this
on the order of 21 in the earth's crust at an
method without oxidated by KMnO4 solution.
average concentration of 100 ppm (Emsley,
While Cr(III) in the artificial samples, the mix
2001). Chromium compounds found in the
of Cr(III) and Cr(VI), could be analyzed by
environment, because of the erosion of rocks
this method via oxidation by KMnO4 solution
containing chromium and may come from
in the acidic media (H2SO4), the result of this
volcanic eruptions.The range of concen-tration
analysis was the total concentration of
in the soil is between 1 - 3000 mg kg-1, and in
Chromium. The concentration of Cr(III) could
rivers and lakes 26 µg L-1 to 5.2 mg L-1 (Kotaś
be calculated via subtracting the total of Cr and Stasicka, 2000).
concentration by the concentration of Cr(VI).
Chromium speciation analysis methods
developed rapidly not only because of the
Keywords : speciation, Cr(III), Cr(VI),
impact of its toxicity but because its spectropho-tometry,
concentration is very low in the water system. diphenylcarbazide, Fe(III),
Chromium(III) is an essential micro-nutrients interference.
for the human body, and play an important role
in the metabolism of glucose and some fat. 1. INTRODUCTION
While the Cr(VI) is highly toxic and
Speciation of Chromium (Cr) is very
carcinogenic (Cornelis, et al., 2005).
important in the field of environmental study,
P-ISSN:2356-3109 E-ISSN: 2356-3117 37
Journal of Environmental Engineering & Sustainable Technology (JEEST)
Vol. 05 No. 01, July 2018, Pages 37-46
Chromium occurs in the environment
2. MATERIAL AND METHODS
primarily in two valence states, trivalent
2.1. Reagent and Standard Solution.
Cr(III) and hexa-valent Cr(VI). Chromium(III)
is much less toxic than Cr(VI) and occurs
Stock solution of Cr(III) 1000 mgL-1 was
naturally in the environment and is the most
prepared by dissolving Chromium nitrate
stable in nature and in biological systems
nonahidrat, Cr(NO3)3.9H2O in a nitric acid
(Rakhunde, et al., 2012).
solution of 0.01 mol L-1. Stock solution of
The Government of Indonesia through
Cr(VI) 1000 mgL-1 was prepared by dissolving
govern-ment regulation no.20 of 1990, has Sodium chromate tetrahydrate
determined that the threshold of chromium(VI)
(Na2CrO4.4H2O) in a solution of nitric acid of
is allowed in drinking water, raw materials of 0.01 mol L-1. A solution of 1,5-
drinking water, water for fisheries and animal
diphenylcarbazide (DPC) 0.05% dissolved in
husbandry, the maximum is 0.05 mgL-1
acetone. Phosphoric acid solution (H3PO4) 1
(Pemerintah Republik Indonesia, 1990). While
M. A series of standard solutions of Cr(III) and
Cr(III) and Cr(VI) can be transformed to one
Cr(VI) with a small concentration, prepared
another in the environment and during storage.
daily by diluting accurately from stock
Chromium(VI) in the water can be solutions.
analyzed with methods diphenylcarbazide
2.2. Instruments and glassware :
[Papassiopi, et al., 2009]. Iron(III) can interfere
to the analysis of Cr(VI) due to Fe(III) can
Spectrophotometer UV-vis, Shimadzu, form complexes with diphenylcarbazide
UV-160 type: for measuring absorbance of Cr
[Harrington, et al., 2009; Nam and Kim, 2012].
(VI) to Cr (III). For all the glassware to be
By using magnesium sulfate/ phosphate buffer,
used soaked with a solution of 0.1 M HNO3
interference of the metal can be deposited for 24 hours.
primarily of Fe(III) (Ku and Eidi, 2006).
2.3. Procedure for chromium(VI) :
Spectrophotometric methods can be used
for selective determination of the different 1. Optimum concentration of
chromium species using reagents to form diphenylcarbazide (DPC).
absorbing species that present selectivity in the
Prepared 5 (five) series each solution:
response. The most common method for
0.5 mL solution of Cr(VI) 100 ppm in a 100
determining Cr(VI) in aqueous solutions is
mL volumetric flask. Each plus 3 mL H3PO4 1
based on the reaction of diphenyl carbazide
M. Each solution coupled with a solution DPC
(DPC) with Cr(VI) at a pH of 1.0 (Andruch, et
with variations: 1.0; 2.0; 3.0; 4.0; 5.0 mL DPC
al., 2003; Pressman and Aladstadt, 2003; solution of 0.05%.
Scindia, et al., 2002 and 2004).
Each solution was diluted with distilled
Spectrophotometric analysis of the
water to 100 mL. Shaken and left for 5
magenta chromagen (λ max~540 nm) which is
minutes. Absorbance was measured at the
formed by the reaction of Cr(VI) with 1,5-
maximum λ of 540 nm with a UV-vis
diphenylcarbazide (DPC) in strongly acidic spectrophotometer.
solution (Ashley, et al., 2003).
2. Optimum volume solution of phosphoric acid (H3PO4).
Prepared 6 (six) series each solution: 2.0
mL solution of Cr(VI) 100 ppm in a 100 mL
volumetric flask. Each plus 1 M H3PO4
solution with different volume: 0.0; 1.0; 3.0;
5.0; 7.0; 9.0 mL. Each solution was added with
a solution of 0.05% DPC as 3.0 mL.
Because of that, the development of
Each solution was with distilled water to
analytical methods for speciation of Cr(III) and
100 mL. Shaken and left for 5 minutes.
Cr(VI) is important compared to methods of
Absorbance was measured at the maximum λ
determining these metals in total.
of 540 nm with a UV-vis spectrophotometer. 38
P-ISSN:2356-3109 E-ISSN: 2356-3117
Wiryawan, Retnowati, Burhan, Syekhfani, Method of Analysis For Determination …
3.0 mL of 1 M H3PO4 solution and the solution 3. The influence of the absorbance
DPC as much as 3.0 mL of 0.05%.
measurement time after preparation.
Each solution was diluted with distilled
Prepared 2.0 ml of Cr(VI) 100 ppm in a
water to 100 mL. Shaken and left for 5
100 mL volumetric flask. Plus 3.0 mL of 1 M
minutes. Absorbance was measured at the H
maximum λ of 540 nm with a UV-vis
3PO4 and DPC solution plus as much as 3.0 mL of 0.05%. spectrophotometer.
Further diluted with distilled water to
7. Effect of Zn(II) interference.
100 ml and shaken. Then the absorbance was
Prepared 6 (six) series each solution: 2.0
measured at maximum λ of 540 nm with a UV-
mL solution of Cr(VI) 100 ppm in a 100 mL
vis spectrophotometer with variation of time:
volumetric flask. Each plus 100 ppm Zn(II)
5, 15, 45, 75, 105, 135 minutes after
solution with different volume: 0.0; 2.0; 4.0; preparation.
6.0; 10.0; 20.0 mL. Each solution was added
4. Effect of Fe(III) interference.
3.0 mL of 1 M H3PO4 solution and the solution
Prepared 8 (eight) series each solution: 2.0
DPC as much as 3.0 mL of 0.05%.
mL solution of Cr(VI) 100 ppm in a 100 mL
Each solution was diluted with distilled
volumetric flask. Each plus 1 M FeCl
water to 100 mL. Shaken and left for 5 3 solution
minutes. Absorbance was measured at the
with different volume: 0.0; 2.0; 4.0; 6.0; 10.0;
15.0; 20.0; 25.0 mL. Each mL of solution plus
maximum λ of 540 nm with a UV-vis 3.0 mL of 1 M H spectrophotometer.
3PO4 solution and the solution
DPC as much as 3.0 mL of 0.05%.
8. Effect of Mn(II) interference.
Each solution was diluted with distilled
water to 100 mL. Shaken and left for 5
Prepared 6 (six) series each solution: 2.0
minutes. Absorbance was measured at the
mL solution of Cr(VI) 100 ppm in a 100 mL
volumetric flask. Each plus 100 ppm Mn(II)
maximum λ of 540 nm with a UV-vis
solution with different volume: 0.0; 2.0; 4.0; spectrophotometer.
6.0; 10.0; 20.0 mL. Each mL of solution plus 5. Overcoming the Effects of Fe(III)
3.0 mL of 1 M H3PO4 solution and the solution interference.
DPC as much as 3.0 mL of 0.05%.
Prepared 6 (six) series each solution: 0.5
Each solution was diluted with distilled
mL solution of Cr(VI) 100 ppm in a 100 mL
water to 100 mL. Shaken and left for 5
minutes. Absorbance was measured at the
volumetric flask. Each plus 1 M FeCl3 solution
with a volume of 3.0 mL. Each solution plus
maximum λ of 540 nm with a UV-vis
5% NaF solution with varying volumes, spectrophotometer.
namely: 0.0; 4.0; 6.0; 10.0; 15.0 mL.
9. Selection of the range of concentrations of
Furthermore, each mixed solution plus 3.0 mL
Cr(VI) which meets the Beer Lambert law.
mL of 1 M H3PO4 solution and 0.05% solution DPC as much as 3.0 mL.
Prepared a series of solvent solution of
Each solution was diluted with distilled
Cr(VI) 100 ppm in a 100 mL volumetric flask,
water to 100 mL. Shaken and left for 5
namely: 0.0; 0.15; 0.30; 0.45; 0.60; 0.75; 0.90;
minutes. Absorbance was measured at the
1.05; 1.20; 1.35; 1.50 mL of Cr(VI) of 100 ppm. Each plus 3.0 mL of 1 M H
maximum λ of 540 nm with a UV-vis spectro- 3PO4 and 3.0 mL of 0.05% solution DPC. photometer.
Each solution was diluted with distilled
6. Effect of Cu(II) interference.
water to 100 mL. Shaken and left for 5
minutes. Absorbance was measured at the
Prepared 6 (six) series each solution: 2.0
mL solution of Cr(VI) 100 ppm in a 100 mL
maximum λ of 540 nm with a UV-vis
volumetric flask. Each plus 100 ppm Cu(II) spectrophotometer.
solution with different volume: 0.0; 2.0; 4.0;
10. Detection limit of method of determination
6.0; 10.0; 20.0 mL. Each solution was added of Cr(VI).
P-ISSN:2356-3109 E-ISSN: 2356-3117 39
Journal of Environmental Engineering & Sustainable Technology (JEEST)
Vol. 05 No. 01, July 2018, Pages 37-46
Prepared a series of solvent solution of A) Standard curve of Cr(VI.)
Cr(VI) 100 ppm in a 100 mL volumetric flask,
Prepared a series of solvent solution of
namely: 0.0; 0.15; 0.30; 0.45; 0.60; 0.75; 0.90
Cr(VI) 100 ppm in a 100 mL volumetric flask,
mL of Cr(VI) of 100 ppm. Each plus 3 mL of 1
namely: 0.0; 0.1; 0.2; 0.3; 0.4; 0.5 mL of
M H3PO4 and 3.0 mL of 0.05% solution DPC.
Cr(VI) of 100 ppm. Each plus 3 mL of 1 M
Each solution was diluted with distilled
H3PO4 and 3.0 mL of 0.05% solution DPC.
water to 100 mL. Shaken and left for 5
Each olution was diluted with distilled
minutes. Absorbance was measured at the
water to 100 mL. Shaken and left for 5
maximum λ of 540 nm with a UV-vis
minutes. Absorbance was measured at the spectrophotometer.
maximum λ of 540 nm with a UV-vis
11. Samples analysis of artificial (interference spectrophotometer.
of Fe3+) and overcome this interference
B) Selection of pH to oxidation Cr(III) to with NaF solution. Cr(VI). A. Standard curve Cr (VI).
Prepared five series of artificial sample
solution of 0.4 ppm Cr(III) in different test
Prepared a series of solvent solution of
tubes and added with 1 mL of distilled water.
Cr(VI) 100 ppm in a 100 mL volumetric flask,
Each test tube was acidified by adding a
namely: 0.0; 0.2; 0.4; 0.6; 0.60; 0.8 mL of solution of H
Cr(VI) of 100 ppm. Each plus 3 mL of 1 M
2SO4 (1:3) is different, namely:
0.05; 0.10; 0.15; 0.20; 0.25 mL. Each one is
H3PO4 and 3.0 mL of 0.05% solution of DPC. oxidized with KMnO
Each diluted with distilled water to 100
4 solution drop wise in a
test tube that is inserted in the beaker glass
mL. Shaken and left for 5 minutes.
containing water that is heated on a hot plate,
Absorbance was measured at the maximum λ
as in Figure 1. The addition of KMnO
of 540 nm with a UV-vis spectrophotometer. 4
solution is stopped when there is little excess
B. Artificial sample of Cr(VI).
KMnO4 solution which marked the formation of a permanent red color.
Prepared three rows artificial sample
When it is cold, each solution was added
solution of 0.5 ppm Cr(VI) with a volume of with 3 mL of 1 M H
100 mL, respectively coupled with NaF
3PO4 and 3.0 mL of 0.05% DPC.
solution by volume: 6.0; 4.0: 2.0 mL (Table
Each solution was diluted with distilled 1.).
water to 100 mL. Shaken and left for 5
minutes. Absorbance was measured at the
Tabel 1. Composition of the solution
maximum λ is 540 nm with a UV-vis
The solution is added to Cr(VI) No. spectrophotometer. before dilution
The absorbance of each solution were 1. 6 mL NaF + 3 mL Fe(III) + 3 mL H
extrapolated to the standard curve of Cr(VI) 3PO4 + 3 mL DPC 2. 4 mL NaF + 3 mL Fe(III) +
and concentration can be known.
3 mL H3PO4 + 3 mL DPC 3. 2 mL NaF + 3 mL Fe(III) + Test 3 mL H
3PO4 + 3 mL DPC tube Beaker glass
Each diluted with distilled water to 100
mL. Shaken and left for 5 minutes. Absorbance Cr(III) Water
was measured at the maximum λ of 540 nm
with a UV-vis spectrophotometer.
The absorbance of each solution were Hot Plate
extrapolated to the standard curve of Cr(VI)
Figure 1. Oxidation Cr(III) in the test tube.
and concentration can be known.
C. Procedure for chromium(III) :
C) Artificial samples of Cr(III).
1) Determination of Cr (III) via oxidation of
Prepared three rows of sample solution Cr(III) to Cr(VI).
of : 0.2; 0.3; 0.4 ppm Cr(III) in a test tube and 40
P-ISSN:2356-3109 E-ISSN: 2356-3117
Wiryawan, Retnowati, Burhan, Syekhfani, Method of Analysis For Determination …
added with 1 mL of distilled water. Each test
Tabel 2. The solution added to mix of Cr(III)
tube was acidified by adding 0.15 mL of a and Cr(VI)
solution of H2SO4 (1:3). Each one is oxidized No. Addition of Oxidation Cr
with KMnO4 solution drop wise in a test tube Fe(III) and with measured
that is inserted in the beaker glass containing NaF solution KMnO4 as 1. 0 mL Fe(III) Without Cr(VI) only
water that is heated on a hot plate, as Figure 1. and 0 mL NaF oxidation
The addition of KMnO4 solution is stopped 2. 3 mL Fe(III) Without Cr(VI) only
when there is little excess KMnO4 solution and 0 mL NaF oxidation
which marked the formation of a permanent 3. 3 mL Fe(III) Without Cr(VI) only pink color. and 6 mL NaF oxidation
When it is cold, each plussolution was 4. 0 mL Fe(III) Oxidation Cr(VI) and
added with 3 mL of 1 M H3PO4 and 3.0 mL of and 0 mL NaF by KMnO4 Cr(III) 0.05% DPC. 5. 3 mL Fe(III) Oxidation Cr(VI) and
Each solution was diluted with distilled and 0 mL NaF by KMnO4 Cr(III)
water to 100 mL. Shaken and left for 5 6. 3 mL Fe(III) Oxidation Cr(VI) and
minutes. Absorbance was measured at the and 6 mL NaF by KMnO4 Cr(III)
maximum λ of 540 nm with a UV-vis
spectrophotometer. The absorbance of each
No. 1, 2, 3 : each in a 100 mL volumetric flask,
solution were extrapolated to the standard
added 3 mL of 1 M H3PO4 and 3.0 mL of
curve of Cr(VI) and concentration can be 0.05% DPC. known.
No. 4, 5, 6: oxidation carried out in a test
tube and added with 1 mL of distilled water.
2) Determination of Cr(VI) to Cr(III) in an
Each test tube was acidified by adding 0.15 artificial of water sample.
mL of a solution of H2SO4 (1:3). Each one is
By using the optimum conditions (from
oxidized with KMnO4 solution drop wise in a
the experiment c.2. and c.3.), concentration of
test tube that is inserted in the glass beaker
Cr(VI) to Cr(III) in artificial samples were
containing water that is heated in a hot plate, as determined.
Figure 1. The addition of KMnO4 solution is
stopped when there is little excess KMnO4 A) Standard curve Cr (VI)
solution which marked the formation of a
Prepared a series of solution of Cr(VI) permanent pink color.
100 ppm in a 100 mL volumetric flask,
When it is cold, a solution of each test
namely: 0.0; 0.1; 0.2; 0.3; 0.4; 0.5 mL of
tube transferred to a different flask, added with
Cr(VI) of 100 ppm. Each plus 3 mL of 1 M
3 mL of 1 M H3PO4 and 3.0 mL of 0.05% H DPC.
3PO4 and 3.0 mL of 0.05% solution DPC.
Each solution was diluted with distilled
Each solution was diluted with distilled
water to 100 mL. Shaken and left for 5
water to 100 mL. Shaken and left for 5
minutes. Absorbance was measured at the
minutes. Absorbance was measured at the
maximum λ of 540 nm with a UV-vis
maximum λ is 540 nm with a UV-vis spectro- spectrophotometer. photometer.
The absorbance of each solution were
B) Mixing Cr(VI) and Cr(III) in a sample of
extrapolated to the standard curve of Cr(VI) artificial water.
and concentration can be known.
Prepared a series of artificial sample
solution, a mixture of 0.2 ppm Cr(III) and 0.2
3. RESULT AND DISCUSION
ppm Cr(VI), then treated as table 2 : 3.1. Diphenylcarbazide(DPC) optimum concentration.
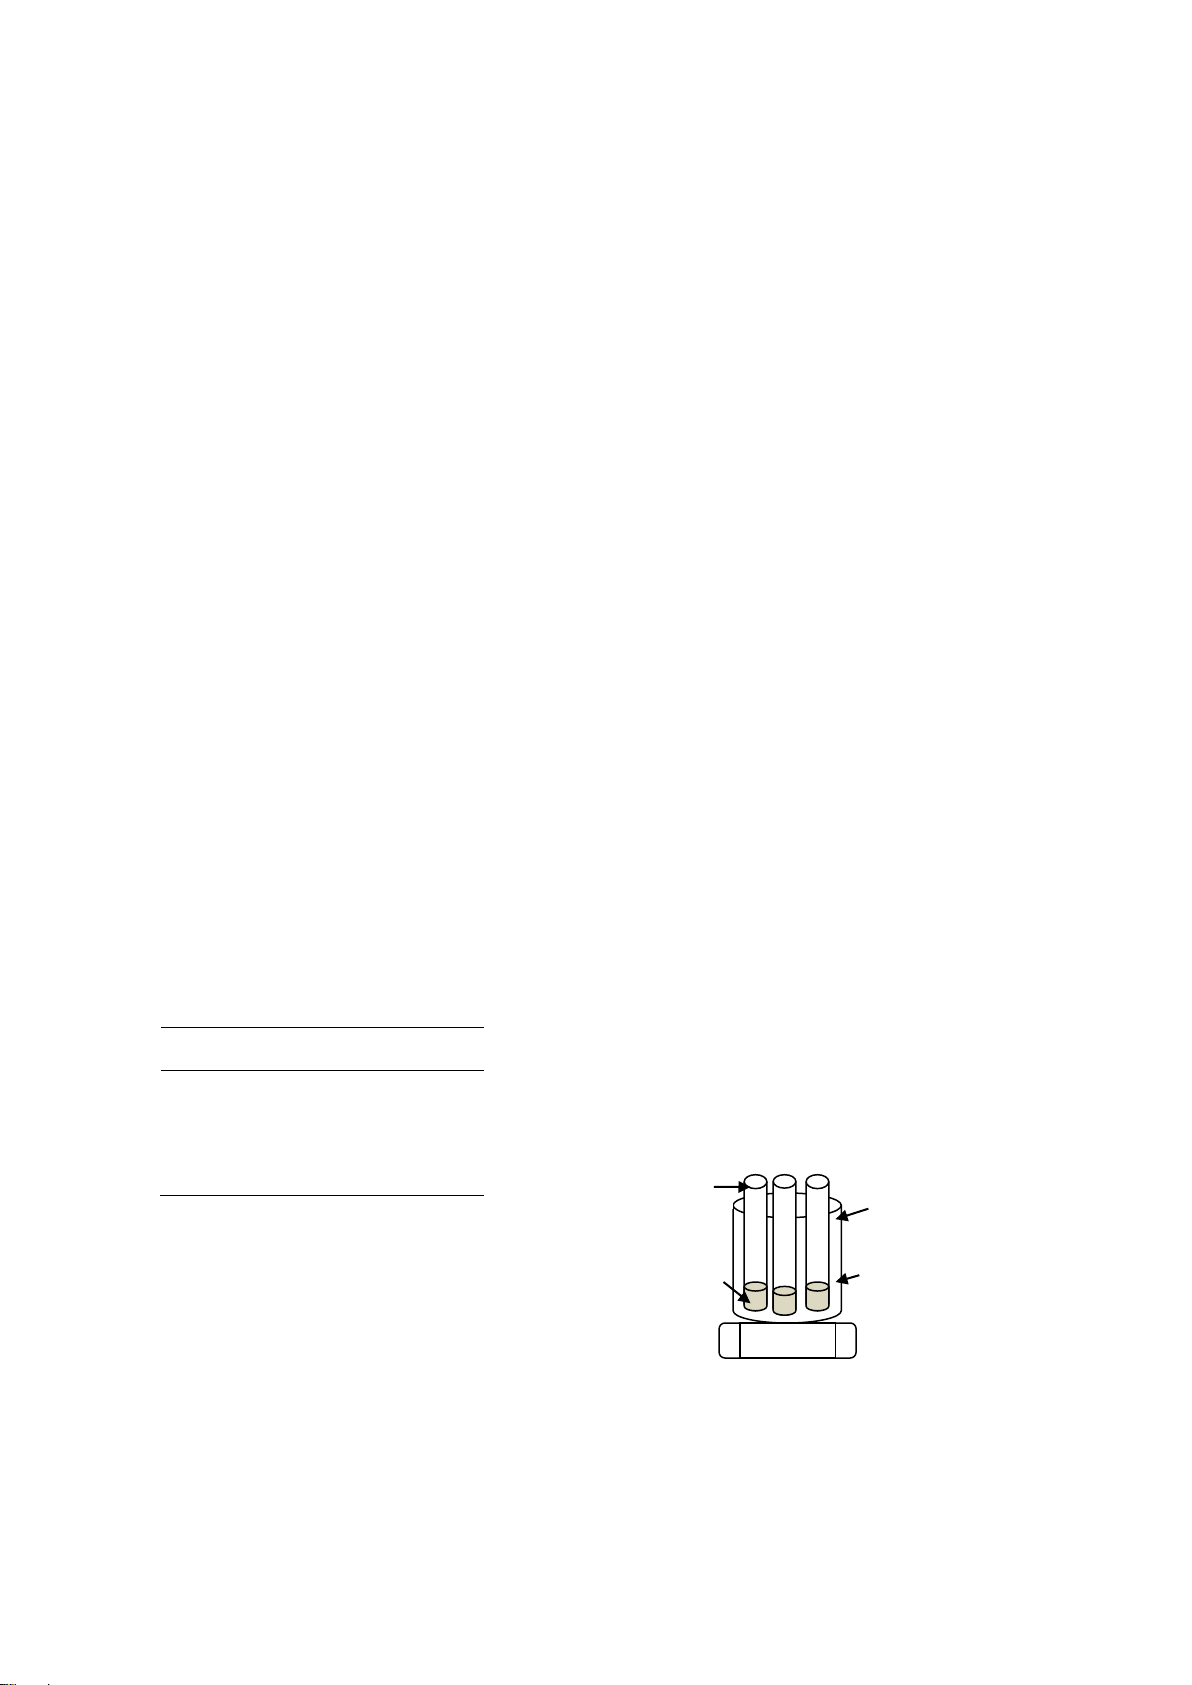
Absorbance was measured at the
maximum λ of 540 nm with a UV-vis
spectrophotometer. From Figure 2 taken
0.0015% DFC as the optimum concentration.
P-ISSN:2356-3109 E-ISSN: 2356-3117 41
Journal of Environmental Engineering & Sustainable Technology (JEEST)
Vol. 05 No. 01, July 2018, Pages 37-46
Figure 2. The effect of DPC concentration to the absorbance.
Figure 4. Measurement the absorbance in the
3.2. Selection the optimum concentration of
variation time after preparation H3PO4 solution
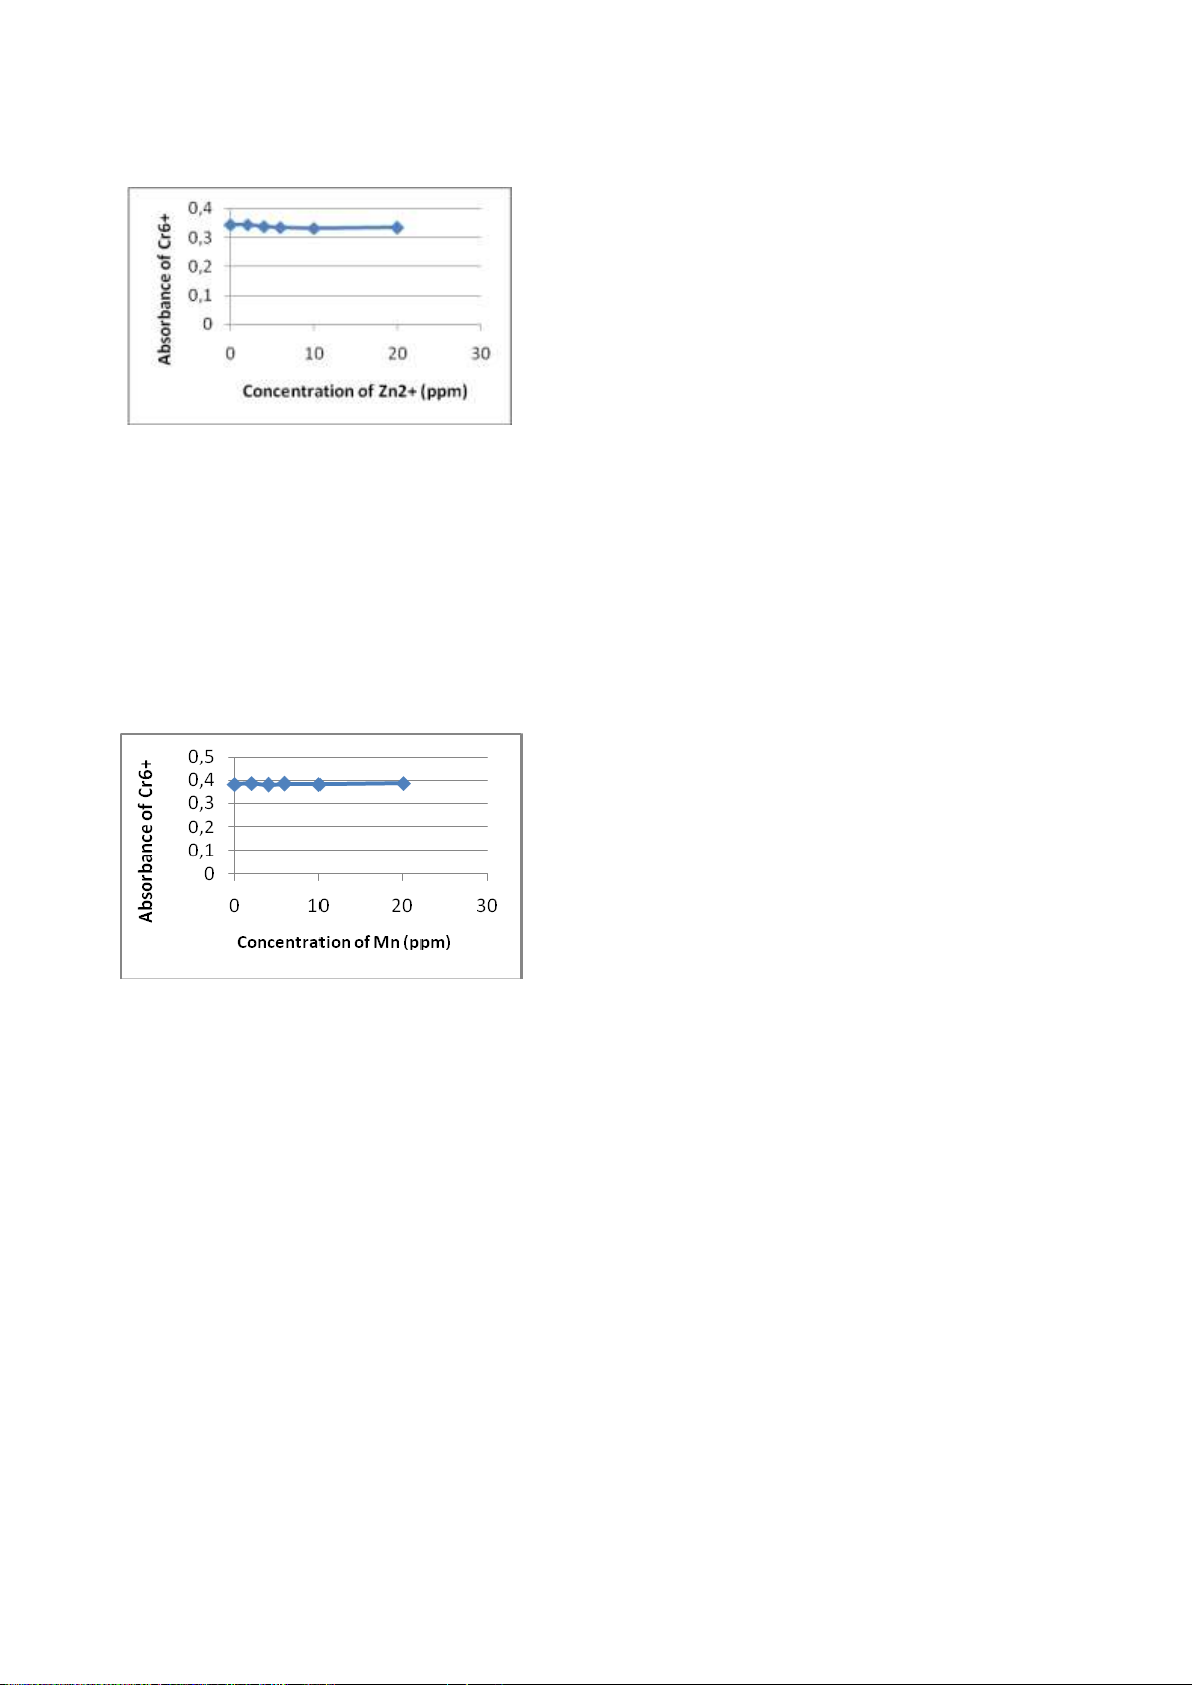
3.4. Effect of Fe(III) interference.
Absorbance was measured at the
maximum wavelength of 540 nm with a UV-
Absorbance was measured at the
vis spectrophotometer. From the Figure 3
maximum λ of 540 nm with a UV-vis taken 0.03 M H3PO4 as optimum
spectrophotometer. From Figure 5 chosen concentration.
concentration of 6.0 ppm Fe(III).
Figure 3. The effect of H3PO4 concentration to the
Figure 5. The effect of Fe(III) concentration to the absorbance. absorbance. 3.3. The influence of the absorbance
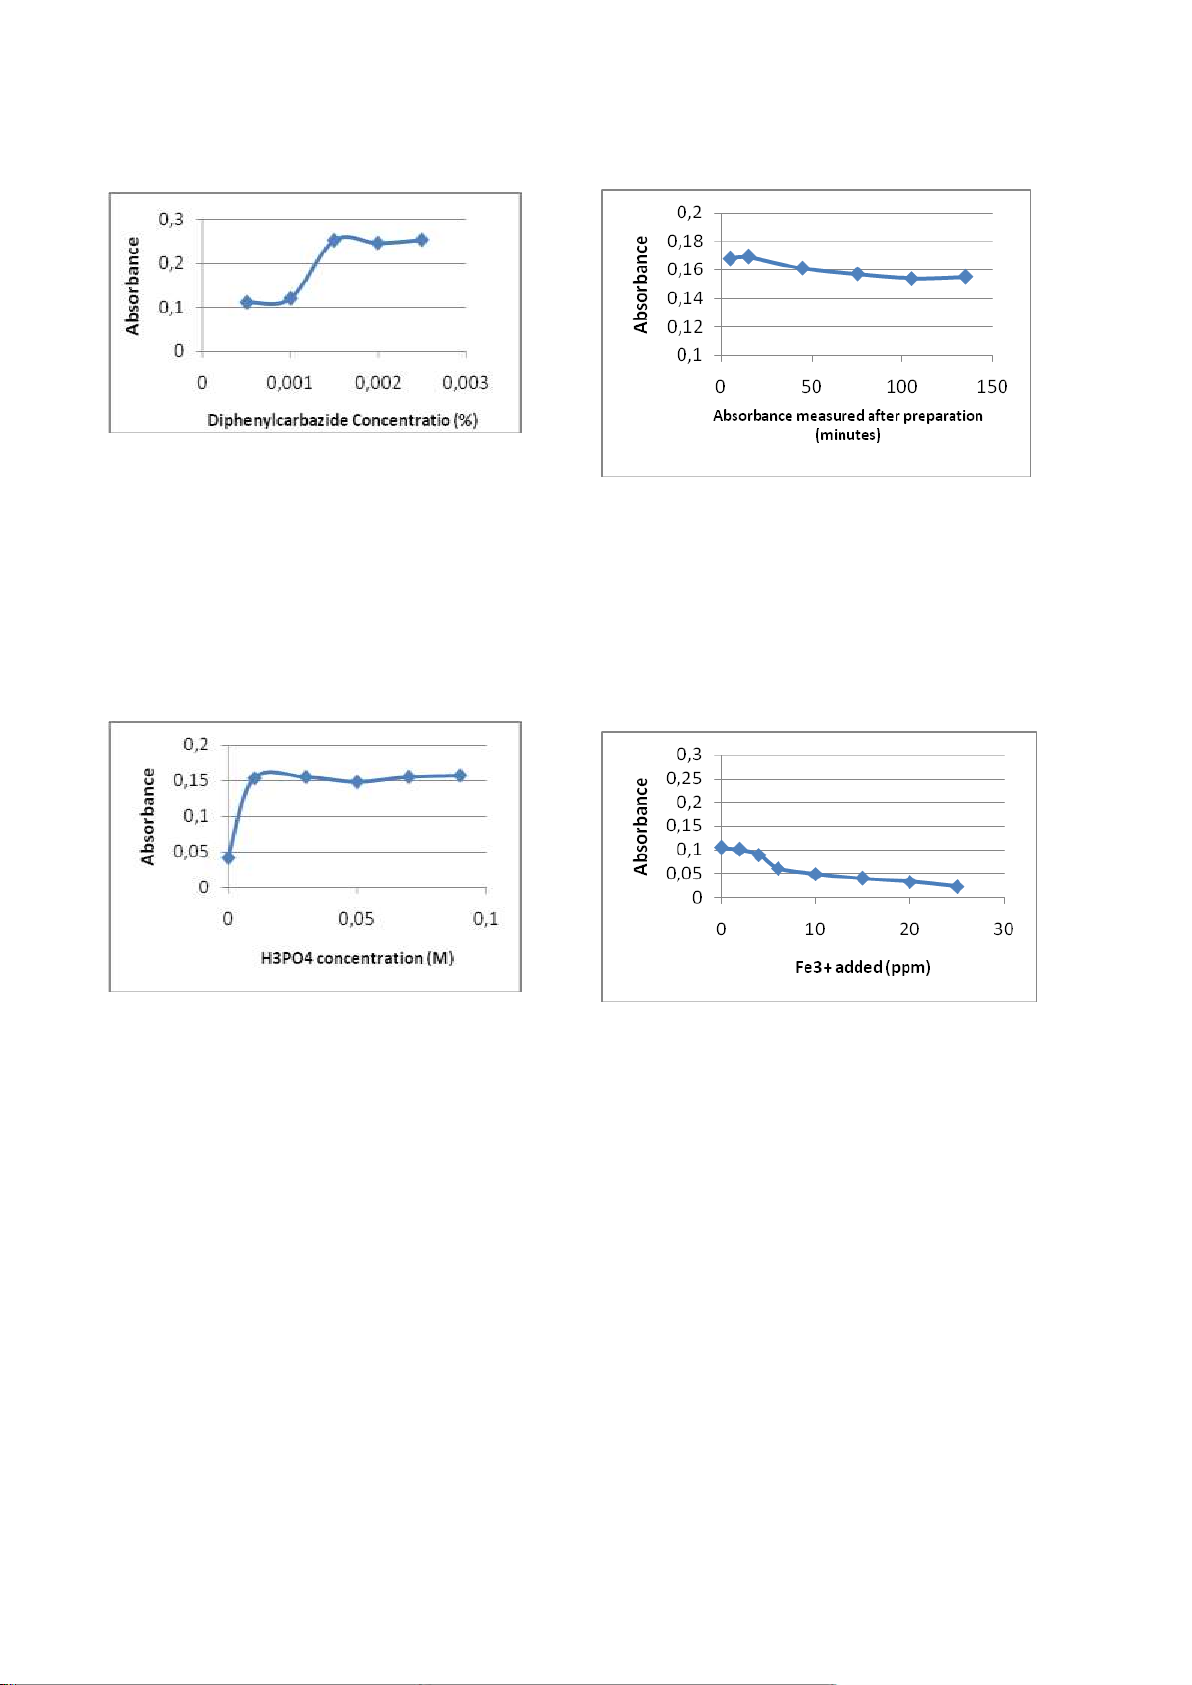
3.5. Overcome Fe(III) interference using NaF
measurement time after preparation. solution
Absorbance was measured at the
From this experiment as presented in
Figure 6, NaF optimum concentration is 0.3%.
maximum λ of 540 nm with a UV-vis
spektrofotometr with variation of time: 5, 15,
45, 75, 105, 135 minutes after preparation.
From the Figure 4, the optimum time is 5 minutes after preparation. 42
P-ISSN:2356-3109 E-ISSN: 2356-3117
Wiryawan, Retnowati, Burhan, Syekhfani, Method of Analysis For Determination …
Figure 8. Standard curve of Cr(VI)-DPC
Figure 6. The effect of NaF solution addition to
the absorbance with Fe(III) interference.
B. Making the curve for Determination Limit of detection.
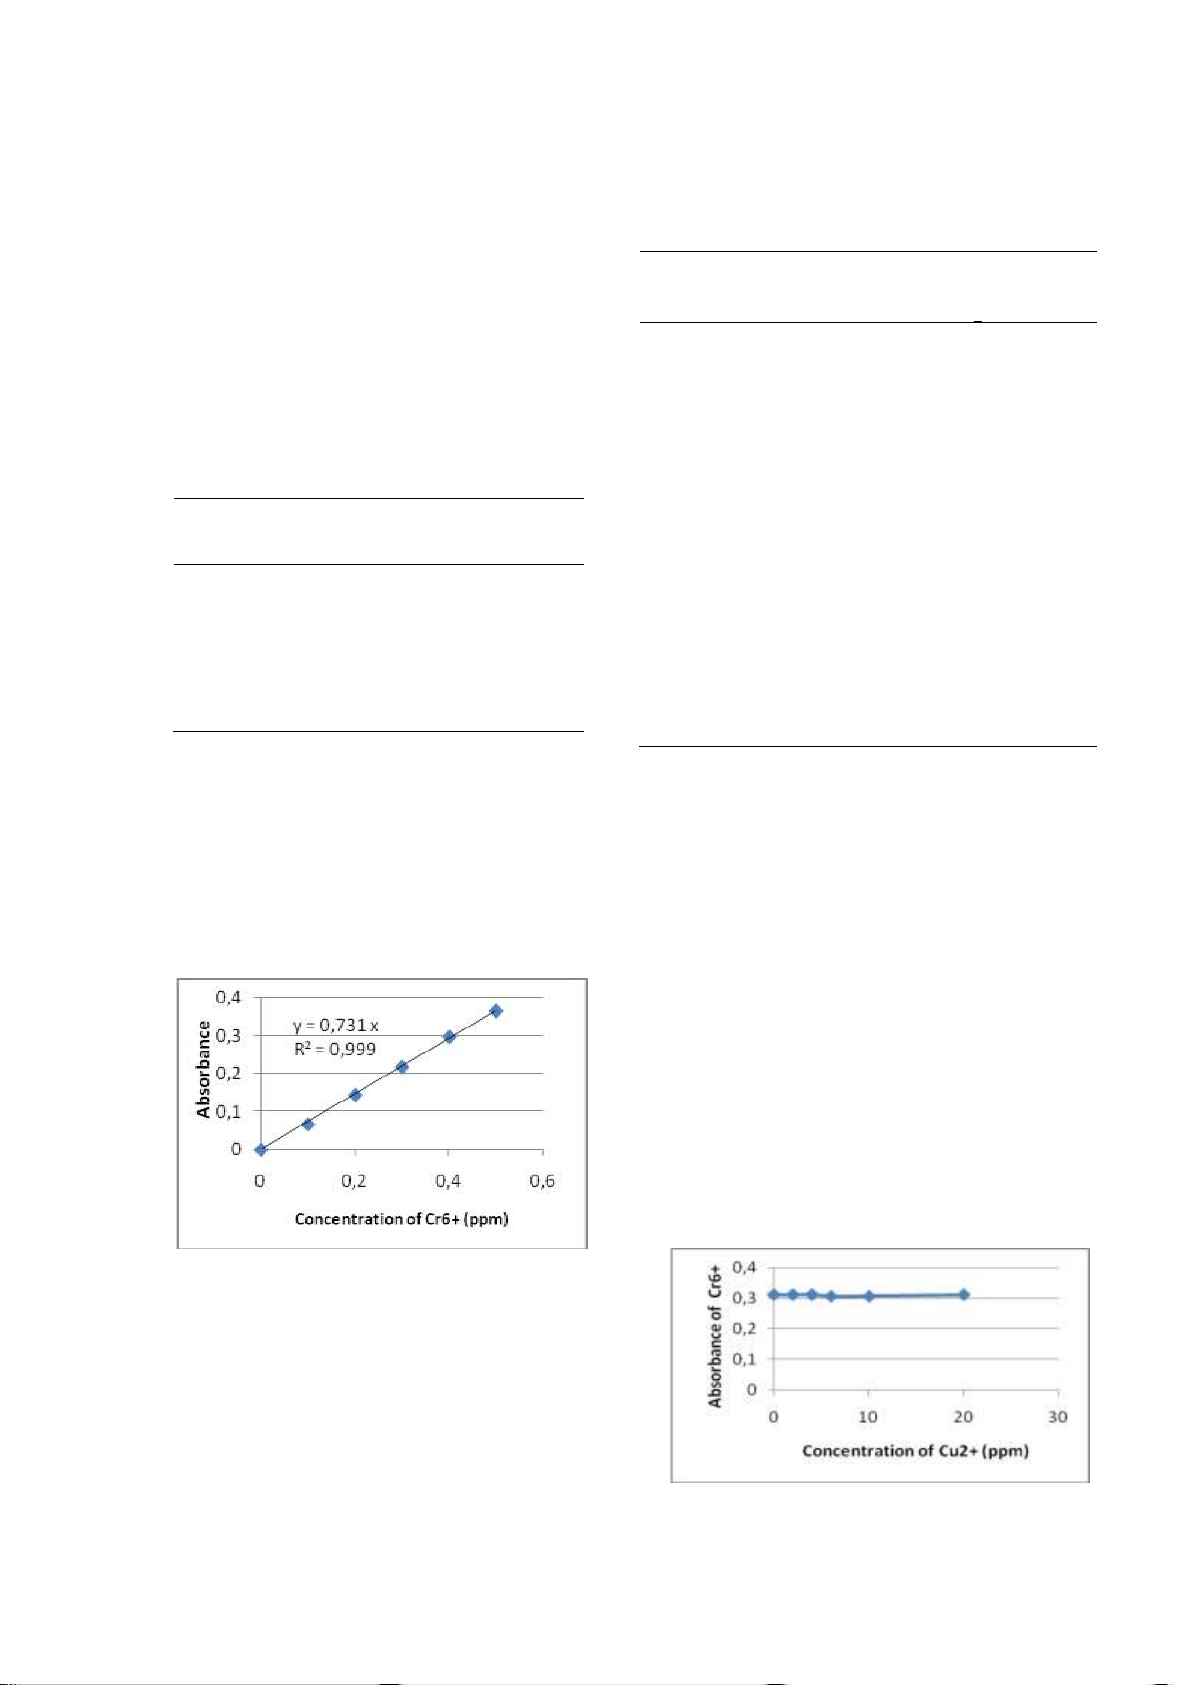
3.6. Selection of the range of concentrations
of Cr (VI) which meets the Beer Lambert law.
Absorbance was measured at the
maximum λ of 540 nm with a UV-vis spectrophotometer. So the range of
concentrations of Cr(VI) which meets the Beer
Lambert law is 0.1 to 0.9 ppm, because after
0.9 ppm not linier (Figure 7).
Figure 9. Standard curve of Cr(VI)-DPC for
determination of detection limit.
Regresion equation for calculate limit of detection (Figure 9) : Y = 0.632381 X + 0.006429 Equation f or calculate li mit of detection:
Figure 7. Standard curve of Cr(VI)-DPC for Y - Yb = 3 x SB knowing the linierity SB = Sy/x
3.7. Determination limit ditection (Miller and Miller, 2010).
SB = ∑(Yi - Y^)2 = 0.0085255384230025
A. Making the standard curve Cr6+ n-2 5 = 0.04129294957 Y - Yb = 3 x SB
P-ISSN:2356-3109 E-ISSN: 2356-3117 43
Journal of Environmental Engineering & Sustainable Technology (JEEST)
Vol. 05 No. 01, July 2018, Pages 37-46 Solution Repli Abs. Cr6+ Mean of SD added to -cates measured Cr6+ (%)
Y = 0.00632381 + (3 x 0.04129294957 ) = Cr(VI) (ppm) measured 0.1303088488 ± SD 2 mL NaF 3 mL Fe3+ 1 0.174 0.3096 0.3049
By insert value of Y = 0.1303088488 3 mL 0.172 0.3061 ± 1.78
to the equation of : Y = 0.632381 X + 0.006429 2 H 3PO4 0.0054 0.168 0.2989 3 mL DFC 3
so limit of detection (X) can be calculated as : From t his experi ment (table 3) known that 6
mL 5 % NaF solution can overcome the Fe(III)
0.1303088488 = 0.632381 X + 0.006429 Limit of detection (X)
interference comparing to 4 mL and 2 mL5%
= 0.1303088488 - 0.006429 = 0.1959086 NaF solution. 0.632381
So the limit of detection is 0.1959 ppm
C. Analysis of artificial samples (Fe3+ interference) and overcome the
interference (adding 5% NaF solution )
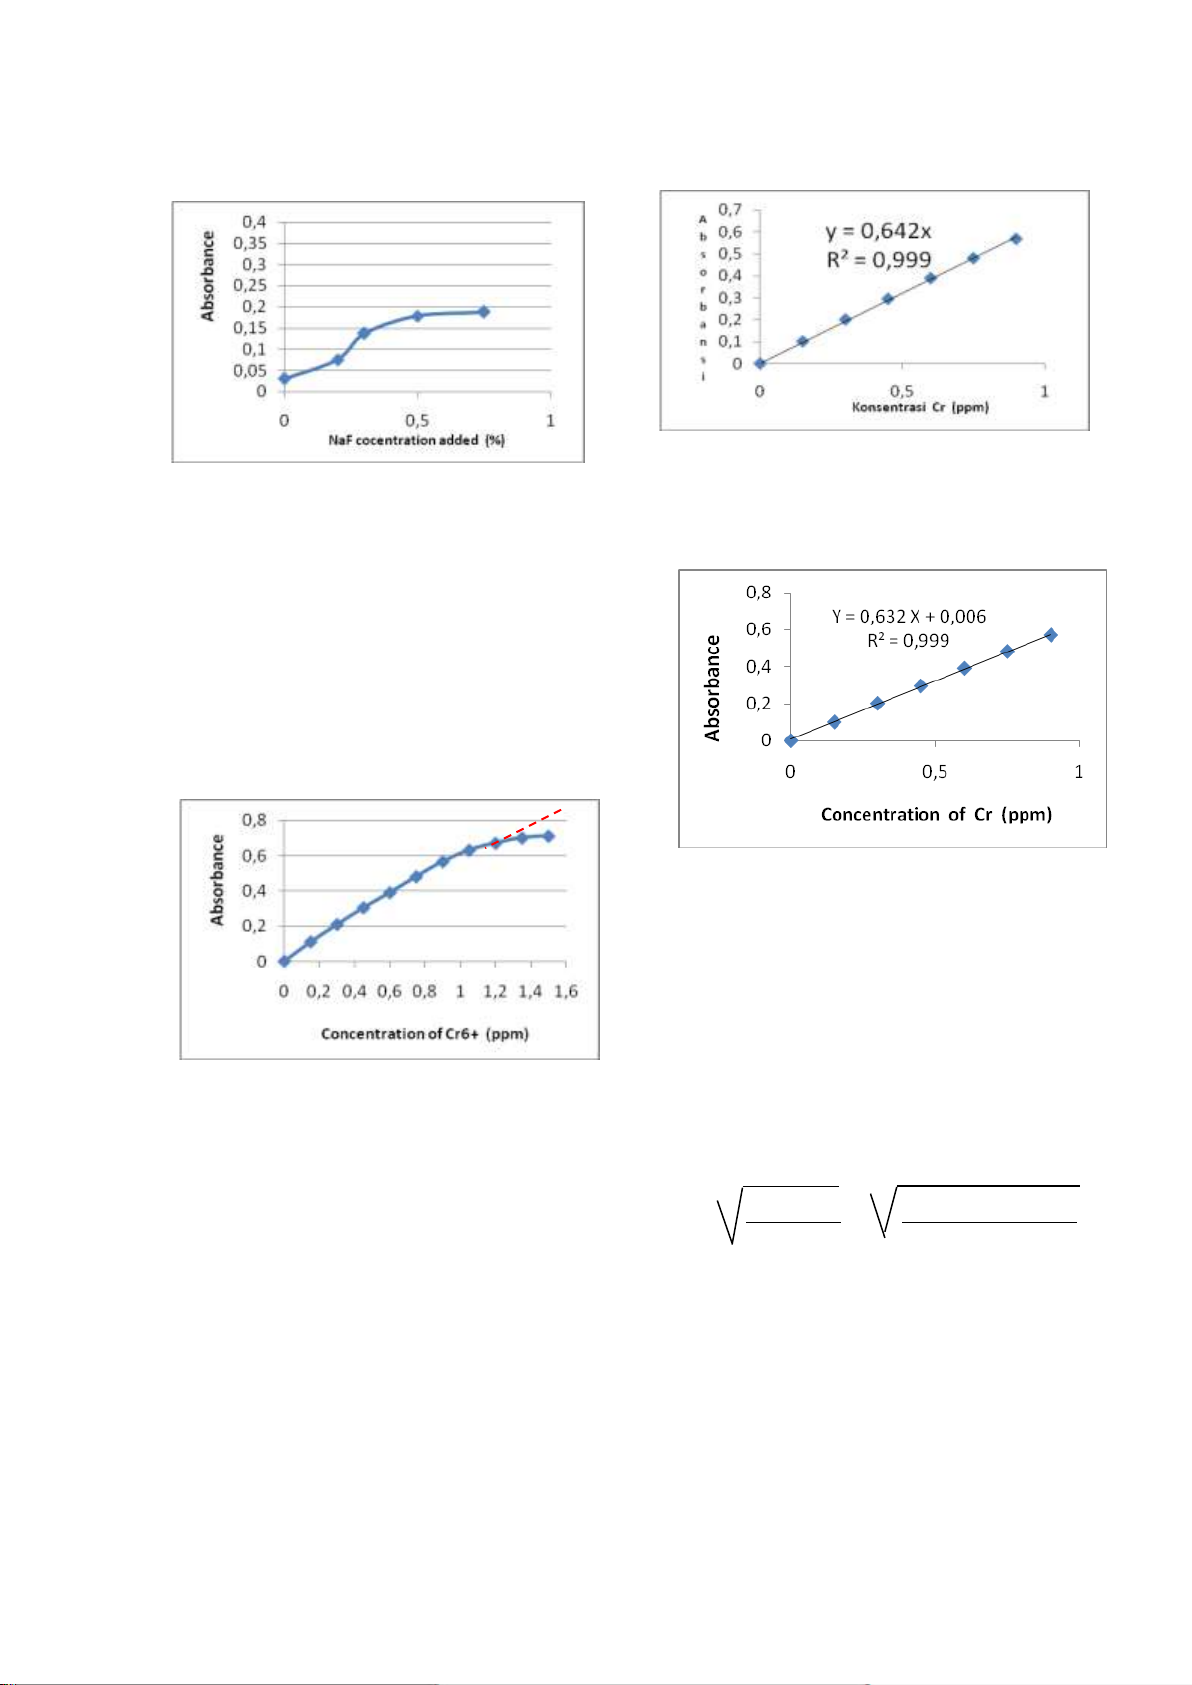
1. Making the Standar curve of Cr6+
Figure 11. Standard curve of Cr(VI)-DPC
D. Determination of Cr(III) via oxidation of Cr(III) to Cr(VI).
1. Making standard curve of Cr(VI)
Standard curve of Cr(VI)-DPC is presented
Figure 10. Standard curve of Cr(VI)-DPC in Figure 11.
2. Measuring Cr(VI) in the artificial sampel
2. Selection of H2SO4 solution as acid media 0.5 ppm Cr(VI).
for the oxidation of Cr(III) to Cr(VI). The absorbance of each solution
From the experimental results as
(column 3, Table 3) were extrapolated to the
presented in Figure 12, have been known that
standard curve of Cr(VI), Figure 10 and
volume of solution of H2SO4 (1: 3) optimum is
concentration Cr(VI) can be known (column 4, 0.15 mL. table 3).
Table 3. Measuring the artificial 0.50 ppm Cr(VI)
with Fe(III) interference and adding NaF solution. Solution Repli Abs. Cr6+ Mean of SD added to -cates measured Cr6+ (%) Cr(VI) (ppm) measured ± SD 6 mL NaF 3 mL Fe3+ 1 0.279 0.4964 0.4988 3 mL 2 0.280 0.4982 ± 0.54 H3PO4 0.0027 3 mL DFC 3 0.282 0,5018 4 mL NaF 3 mL Fe3+ 1 0.258 0.4591 0.4549 3 mL 2 0.255 0.4537 ± 0.81
Figure 12. The effect of H2SO4 solution as acid H3PO4 0.0037
media to the oxidation of Cr(III) to 3 mL DFC 3 0.254 0. 519 Cr(VI) 44
P-ISSN:2356-3109 E-ISSN: 2356-3117
Wiryawan, Retnowati, Burhan, Syekhfani, Method of Analysis For Determination …
3. Measurement of the sample (artificial)
Table 5. Measuring the artificial mixing solution of
Cr(III) which was oxidized to Cr(VI) by
0.20 ppm Cr(III) and 0.20 ppm Cr(VI) with Fe(III) KMnO
interference and adding NaF solution
4 in H2SO4 as acid media.
The absorbance of each solution (column No. Solution Cr6+ Mean of SD Added to Repli- Abs. measured Cr6+ (%)
3, Table 4) were extrapolated to the standard Cr cates (ppm) measured
curve of Cr(VI), Figure 11 and concentration solution + SD 1. None 1 0.146 0.1997 0.2020
Cr(III), as Cr(VI), can be known (column 4, 2 0.149 0.2038 ± 0.59 table 4). 3 0.148 0.2025 0.0012 2. 3 mL 1 0.117 0.1601 0.1596
Table 4. Measuring Cr(III) in the artificial solution Fe(III) 2 0.115 0.1573 ± 1.31 0.0021
of Cr(III) with Fe(III) interference and adding NaF 3 0.118 0.1614 solution. 3. 3 mL 1 0.143 0.1956 0.1965 Fe(III) + 2 0.146 0.1997 ± 1.45 6 mL 3 0.142 0.1943 0.0028 Mean of Cr3+ NaF ppm Repli Cr3+ SD Abs. measured Cr3+ -cates measured (%) 4. KMnO4 1 0.294 0.4022 0.4004 (ppm) ± SD 2 0.289 0.3953 ± 0.63 0.20 1 0.156 0.2069 0.2034 3 0.295 0.4036 0.0025 2 0.154 0.2042 ± 1.99 5. 3 mL 1 0.233 0.3187 0.3128 3 0,150 0.1989 0.0041 0.3119 ± Fe(III) + 2 0.229 1.02 0.30 1 0.258 0.3024 0.3059 1.09 KMnO 3 0.225 0.3078 0.0032 2 0.255 0.3064 ± 4 3 0.254 0.3090 0.0033 6. 3 mL 1 0.291 0.3981 0.3949 0.40 1 0.174 0.4005 0.4036 0.68 Fe(III) + 2 0.288 0.3940 ± 0.72 2 0.172 0.4058 0.3926 0.0028 ± KMnO4 3 0.287 3 0.168 0.4045 0.0028 + 6 mL NaF
From the the table 4, it can be seen that the
solution NaF can overcome the Fe(III)
From the table 5, show that : in solution no. 1,
2, 3 : only Cr(VI) were measured, because it interference.
does not use KMnO4 oxidation. Solution no.2
4. Measuring Cr in the artificial samples
less the 0.20 ppm because it was not added
solution containing of 0,2 ppm Cr(VI) and NaF solution. 0,2 ppm Cr(III).
In solution no. 4, 5, 6 : Cr(III) and
A. Making standard curve of Cr(VI).
Cr(VI) were measured, because they were
oxidized by KMnO4 solution. Solution no.5
less the 0.40 ppm because it was not added NaF solution.
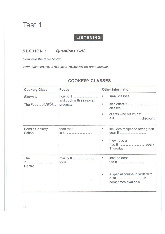
6. The influence of the Cu (II) and Zn (II).
Absorbance was measured at the
maximum λ is 540 nm with a UV-vis
spectrophotometer. From the results of this
experiment can be seen, Zn (II) and Cu (II)
does not affect the solution of Cr (VI)-DFC (Figures 13 and 14). Figure
12. Standard curve of Cr(VI)-DPC
5. Measurement Cr in the sample solution
(artificial) containing Cr(VI) and Cr(III), which was oxidized to Cr(VI)
The absorbance of each solution (column
4, Table 5) were extrapolated to the standard
curve of Cr(VI), Figure 12 and concentration
Cr(III) can be known (column 5, Table 5).
P-ISSN:2356-3109 E-ISSN: 2356-3117 45
Journal of Environmental Engineering & Sustainable Technology (JEEST)
Vol. 05 No. 01, July 2018, Pages 37-46
with KMnO4 solution in the acidic media
(H2SO4), the result of this analysis is the total
concentration of chromium. The concentration
of Cr(III) can be calculated via subtracting the
total of Cr concentration by concentration of Cr(VI). 5. REFERENCES
Andruch, V., Telepcakov´a, M., Balogh, I.S.,
Figure 14. The effect of adding of Zn(II) to
and Urbanov´a, N. 2003. Investigation of absorbance of Cr(VI)
2-[2-(4-methoxy-phenylamino)-vinyl]-
1,3,3-trimethyl-3H-indolium chloride as
a new reagent for the determination of
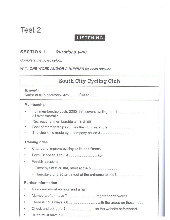
7. The influence of the Mn (II).
chromium(VI). Microchim. Acta : 142,
Absorbance was measured at the 109–113.
maximum λ is 540 nm with a UV-vis
Ashley, K., Howe, A.M., Demangec, M. and
spectrophotometer. From the experimental
Nygren, O. 2003. Sampling and analysis
results in Figure 15, can be seen Mn (II) does
considerations for the determination of
not affect the absorbance of solution of Cr
hexavalent chromium in workplace air. (VI)-DPC.
J. Environ. Monit.: 5, 707–71
Capeans, P.P., Alonso, M.C.B., Barrera, A.B.,
Barrera, P.B. 2005. Chromium available
fraction in aurosa sediments using a
modified microve BCR protocol based on microwave assisted extraction.
Talanta : 65(3), 678-685
Cornelis, R. H., Caruso, .J. and Heumann, K.G. (eds.). 2005. Handbook
ofElemental Speciation II: Species in the Environment, Food, Medicine &
Figure 15. The effect of adding of Mn(II) to
Occupational Health. John Wiley & absorbance of Cr(VI)
Sons, Ltd. pp. 120-124.
Emsley, J. 2001. Chromium. Nature's 4. CONCLUSION
Building Blocks: An A-Z Guide to the
The experimental result show that
Elements. Oxford University Press.
Cr(VI) can be analyzed using 0.0015%
Oxford. p. 495-498. ISBN 0198503407.
diphenylcarbazide as reagent and H3PO4
Gomez, V and Callao, M.P. 2006. Chromium
solution as acidic media in 0.03 mol/L. The
determination and speciation since 2000.
absorbance was measured at 5 minutes after
Trends in Anal. Chem., Vol. 25, No. 10,
preparation. There is interference from ion 1006-1015.
Fe(III) at least 6.0 ppm and this interference
can be overcome by using 0.3 % NaF solution.
Harrington, C.F.; Clough, R.; Hansen, H.R.;
The limit of detection of this method is 0.1959
Hill, S.J.; Pergantis, S.A. 2009. Atomic
ppm. Chromium(VI) in the artificial samples, Spectrometry Update. Elemental
mix of Cr(III) and Cr(VI), can be analyzed by
speciation. J. Anal. Atomic Spectrom.:
using this method without oxidation by 24, 999-1025.
KMnO4 solution. While Cr(III) in the artificial
Kotaś, J. and Stasicka, Z. 2000. Chromium
samples, mix of Cr(III) and Cr(VI), can be
occurrence in the environment and
analyzed by using this method via oxidation 46
P-ISSN:2356-3109 E-ISSN: 2356-3117
Wiryawan, Retnowati, Burhan, Syekhfani, Method of Analysis For Determination …
methods of its speciation. Environmental
Rakhunde, R., Deshpande, L. and Juneja, H.D.
Pollution : 107(3), 263 –283.
2012. Chemical Speciation of Chromium
in Water: A Review. Critical Rev. in
Ku, J.C. and Eide, M. 2006. Hexavalent
Environ. Sci. and Tech.: 42, 776–810.
Chromium. Methods Development Team,
Industrial Hygiene Chemistry Division,
Scindia, Y.M., Pandey, A.K., Reddy, A.V.R.,
OSHA Salt Lake Technical Center,
and Manohar, S.B. 2002. Selective Sandy UT 84070-6406
preconcentration and determination of
chromium(VI) using a flat sheet polymer
Lan, Y., Deng, B., Kim, C., Thornton, E.C.,
inclusion sorbent: Potential application for
and Xu, H. 2005. Catalysis of Elemental
Cr(VI) determination in real samples.
Sulfur Nanoparticles on Chromium(VI)
Anal. Chem.: 74, 4204–4212.
Reduction by Sulfide under Anaerobic
Conditions. Environ. Sci. Technol.: 39,
Scindia, Y.M., Pandey, A.K., Reddy, A.V.R., 2087-2094.
and Manohar, S.B. 2004. Chemically
selective membrane optode for Cr(VI)
Miller, J.N. and J. C. Miller. 2010. Statistics
determination in aqueous samples. Anal. and Chemometrics for Analytical
Chim. Acta : 515, 311–321.
Chemistry. Sixth Ed. Ellis Horwood. Harlow. pp.124-127.
Motomizu, S., Jitmanee, K., Oshima, M. 2003.
Online collection/ concentration of trace
metals spectroscopy detection via use of
small-sized thin solid phase (STSP)
column resin reactors. Application to
speciation of Cr(III) and Cr(VI). Anal.
Chim. Acta : 499, 149-155.
Nam, Sang-Ho and Kim, Yu-Na. 2012. An
Investigation on the Extraction and
Quantitation of a Hexavalent Chromium in Acrylonitrile Butadiene Styrene
Copolymer (ABS) and Printed Circuit
Board (PCB) by Ion Chromatography
Coupled with ICP-AES. Bull. Korean
Chem. Soc.: 33(6), 1967-1971.
Papassiopi, N., Kontoyianni, A., Vaxevanidou,
K., Xenidis, A. 2009. Assessment of chromium biostabilization in contaminated soils using standard leaching and sequential extraction techniques. Science of the Total
Environ.: 407, 925–936. Pemerintah Republik Indonesia. 1990.
Peraturan Pemerintah R.I. No. 20 Tahun
1990 Tentang : Pengendalian Pencemaran Air.
Pressman, M.A.S., and Aldstadt, J.H. 2003. A
comparative study of diffusion samplers
for the determination of hexavalent chromium by sequential injection
spectrophotometry. Microchem. J. : 74, 47–57
P-ISSN:2356-3109 E-ISSN: 2356-3117 47
Tài liệu liên quan:
-
Cambridge IELTS 13 Test-1 Overview and Practice Review | Tài liệu Tiếng Anh
6 3 -
IELTS Test 2 Review - Cambridge 13 Preparation Guide | Tài liệu Tiếng Anh
9 5 -

Litfocus Litreading Survey: Student Reading Interests & Habits Questionnaire | Tài liệu Tiếng Anh
8 4 -

Sách Pre-intermediate Market leader - Business English Course Book
24 12 -

Exam booster for B1 preliminary and B1 preliminary for schools with answer key
10 5