Analysing and simulating pam modulation-demodulation and asynchronoustransmission | Môn Cấu trúc dữ liệu và thuật toán - Đại học Sư phạm Kỹ thuật Thành phố Hồ Chí Minh
Analysing and simulating pam modulation-demodulation and asynchronoustransmission Môn Cấu trúc dữ liệu và thuật toán. Tài liệu được sưu tầm gồm 30 trang, giúp bạn ôn tập tốt hơn. Mời các bạn đón xem.
Môn: Cấu trúc dữ liệu và thuật toán (DSAL220229) 11 tài liệu
Trường: Trường Đại học Sư phạm Kỹ thuật Thành phố Hồ Chí Minh 4.4 K tài liệu
Tác giả:


Preview text:
lOMoAR cPSD| 58583460
MINISTRY OF EDUCATION AND TRAINING
HO CHI MINH CITY UNIVERSITY OF TECHNOLOGY AND EDUCATION
FACULTY OF INTERNATIONAL EDUCATION PROJECT
ANALYSING AND SIMULATING PAM MODULATION -
DEMODULATION AND ASYNCHRONOUS TRANSMISSION
Major: ELECTRONIC AND COMMUNICATION ENGINEERING TECHNOLOGY
Advisor: Nguyễn Ngô Lâm No Student’s name Student’s ID 1
Đống An Thịnh 22161077 2
Trần Vĩnh Kha 22161054 3
Trần Ngọc Phú 22161063 4
Trần Hoàng Anh Tú 22119034 Ho Chi Minh City, April 2025
MINISTRY OF EDUCATION AND TRAINING lOMoAR cPSD| 58583460
HO CHI MINH CITY UNIVERSITY OF TECHNOLOGY AND EDUCATION
FACULTY OF INTERNATIONAL EDUCATION PROJECT
ANALYSING AND SIMULATING PAM MODULATION -
DEMODULATION AND ASYNCHRONOUS TRANSMISSION
Major: ELECTRONIC AND COMMUNICATION ENGINEERING TECHNOLOGY
Advisor: Nguyễn Ngô Lâm No Student’s name Student’s ID 1 Đống An Thịnh 22161077 2 Trần Vĩnh Kha 22161054 3 Trần Ngọc Phú 22161063 4 Trần Hoàng Anh Tú 22119034 Ho Chi Minh City, April 2025 TABLE OF CONTENT S 1.1. Summary 2
1.2. Functions and devices and how to adjust basic parameters and features 2
1.2.1. Simulate oscilloscope 2
1.2.2. How to adjust basic parameters and features 4
1.3. Block diagram of a system 6
1.4. Describe the operation of the system 6
CHAPTER 2: Analysing and simulating the pulse amplitude modulation and 10 lOMoAR cPSD| 58583460
demodulation (PAM) as required 10 2.1. Summary theory 10 2.2. Block diagram 11
2.3. Summary of truth table (Digital IC) and function of components 11
2.4. Describe the operation of the circuit 15 2.4.1. PAM Modulator 15 2.4.2. PAM Demodulator 19
Chapter 3: Analysing and simulating the asynchronous transmission 20
3.1. Summary of relevant theories 20
3.2. Characteristics of unipolar and NRZ signals 20
3.3. Block diagram of the system 21
3.4. Summary of status/functional/truth table of components and its function 22
3.5. Describe the operation of the circuit 24 1 lOMoAR cPSD| 58583460
CHAPTER 1: ANALYSING AND SIMULATING BASIC SIGNALS AND
DEVICES IN DATA TRANSMISSION AS REQUIRED Frequency of sine wave: 16kHz Amplitude of sinewave: 1.1V
Frequency of Digital signal: 16.2kHz
Amplitude of Digital signal: 3.2V 1.1.Summary Time Domain:
- Periodic Signal: Repeats its pattern at a fixed interval (period, T) in the time
domain. It can be visualized a repeating waveform.
- Sine Signal: A smooth, continuous wave that repeats in the time domain with period T.
- Periodic Digital Signal: A sequence of discrete values (samples) taken from a
periodic signal at regular time intervals. Imagine a discrete version of a repeating waveform. Frequency Domain:
- Periodic Signal: The frequency spectrum of a periodic signal in the frequency
domain consists of discrete frequency components, even for complex waveforms.
These components are multiples of the fundamental frequency (f = 1/T).
- Sine Signal: A sine signal has a single, pure frequency component in the
frequency domain at its fundamental frequency.
- Periodic Digital Signal: Due to the sampling process, a periodic digital signal's
frequency spectrum becomes replicated at multiples of the sampling frequency
(f_s) in the frequency domain. This phenomenon is called aliasing. However, the
original information about the periodic signal's fundamental frequency can often
be recovered from the replicated spectrum within certain limits.
1.2.Functions and devices and how to adjust basic parameters and features
1.2.1. Simulate oscilloscope 1.2.1.1. Concept
An oscilloscope is a laboratory instrument commonly used to display and
analyze the waveform of electronic signals. In effect, the device draws a graph of the
instantaneous signal voltage as a function of time.
1.2.1.2. Components in simulating oscilloscope
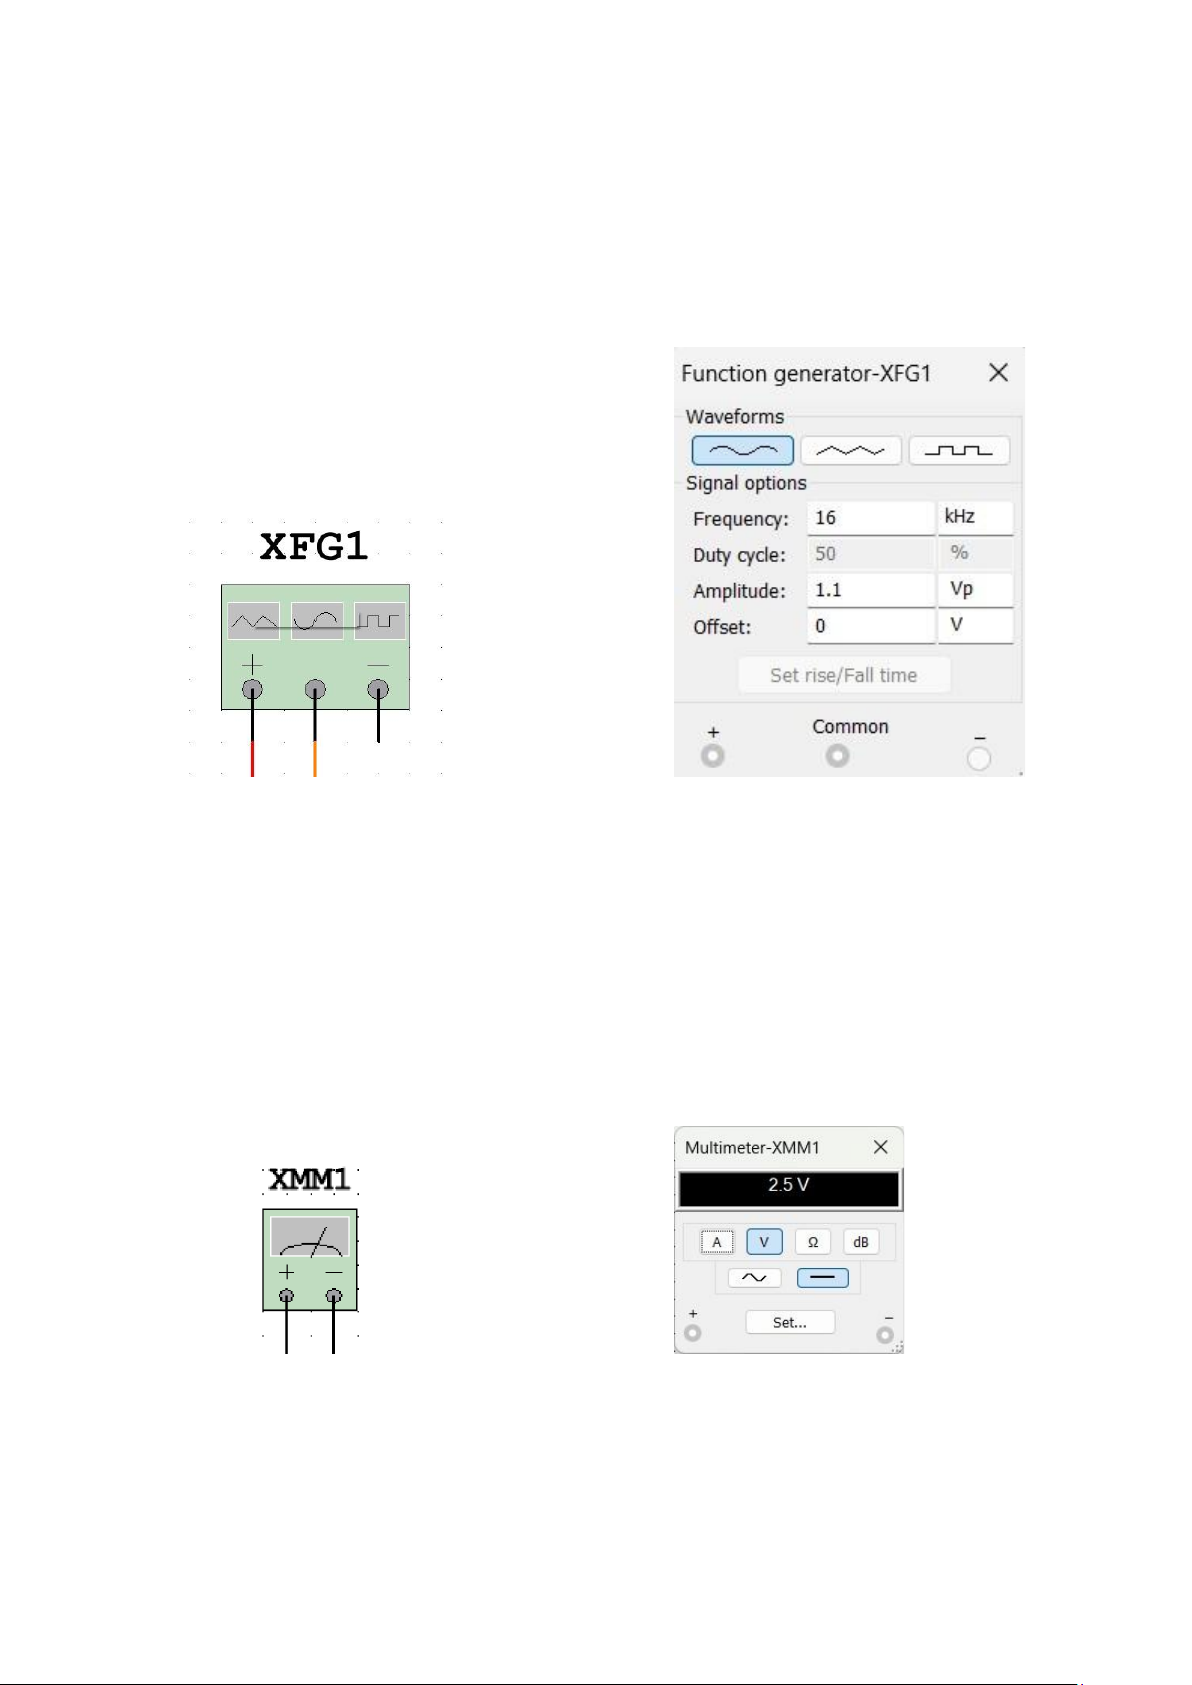
a) XFG - Function Generator
Function generator is usually a piece of electronic test equipment or software used
to generate different types of electrical waveforms over a wide range of frequencies. lOMoAR cPSD| 58583460
Some of the most common waveforms produced by the function generator are the
sine wave, square wave, triangular wave and sawtooth shapes. These waveforms can
be either repetitive or single-shot (which requires an internal or external trigger
source). Another feature included on many function generators is the ability to add a
DC offset. Integrated circuits used to generate waveforms may also be described as function generator ICs. Multisim display:
Displaying FG parameters on Multisim: b) Digital Multimeter
Digital Multimeter or Multimeter (MM) is an electronic measuring device used to
measure electrical parameters such as voltage, current, resistance, and capacitance.
MM uses electronic circuits to convert electrical signals into digital signals, which
are then displayed on an LCD or LED screen
The abbreviation for those devices will be XMM(x) (where x will act as serial
numbers to distinguish Multimeters) Multisim display: Parameter display: XMM parameter: lOMoAR cPSD| 58583460 -
: Buttons with symbols for current, ohm resistance,
etc. have the function of measuring the desired current or resistance parameters
and displaying them on the LED screen. -
: Adjust the waveform, sine wave or square pulse wave.
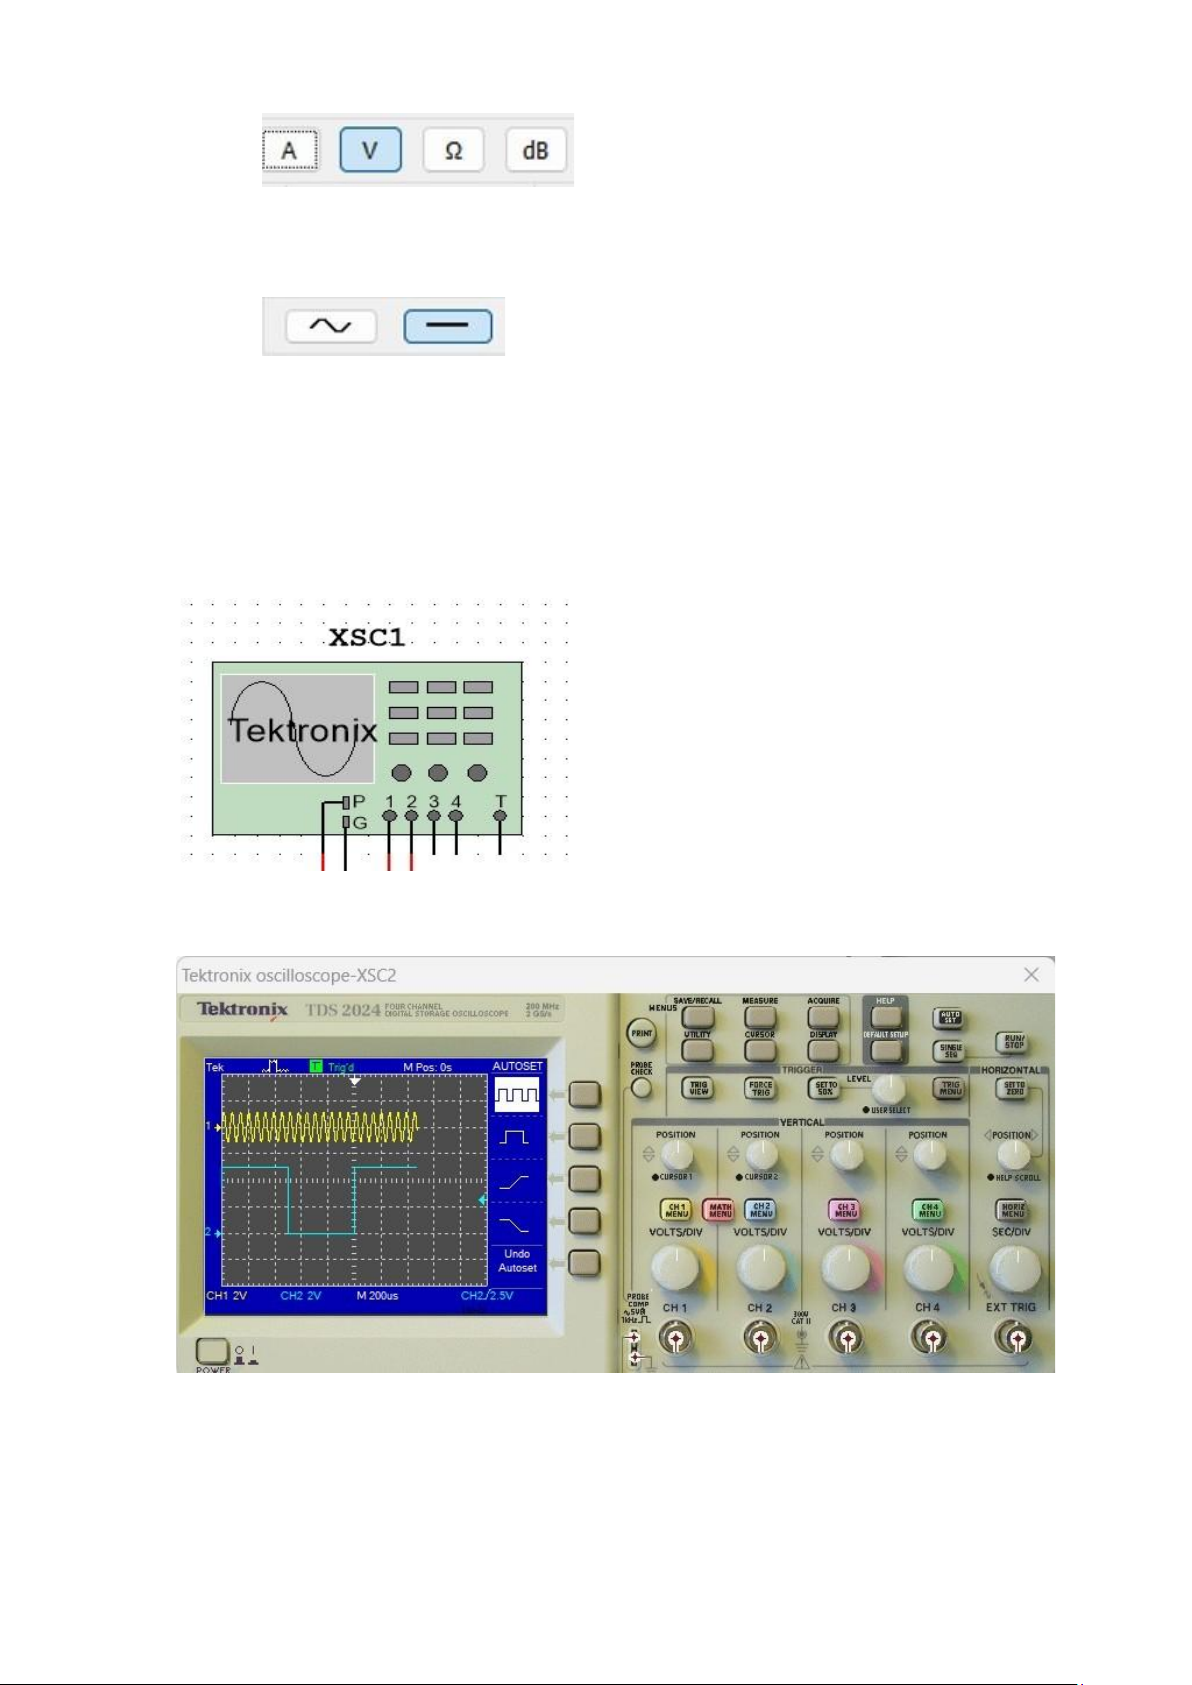
c) Oscilloscope or Channel Oscilloscope (XSC)
Uses: solve problems and some difficult electronic errors.
For example: Error in voltage stability, source filtering error, source noise; The
signal form is distorted and deformed (in this article, XSC has the role of
receiving and emitting signals) Multisim display: Tektronix display:
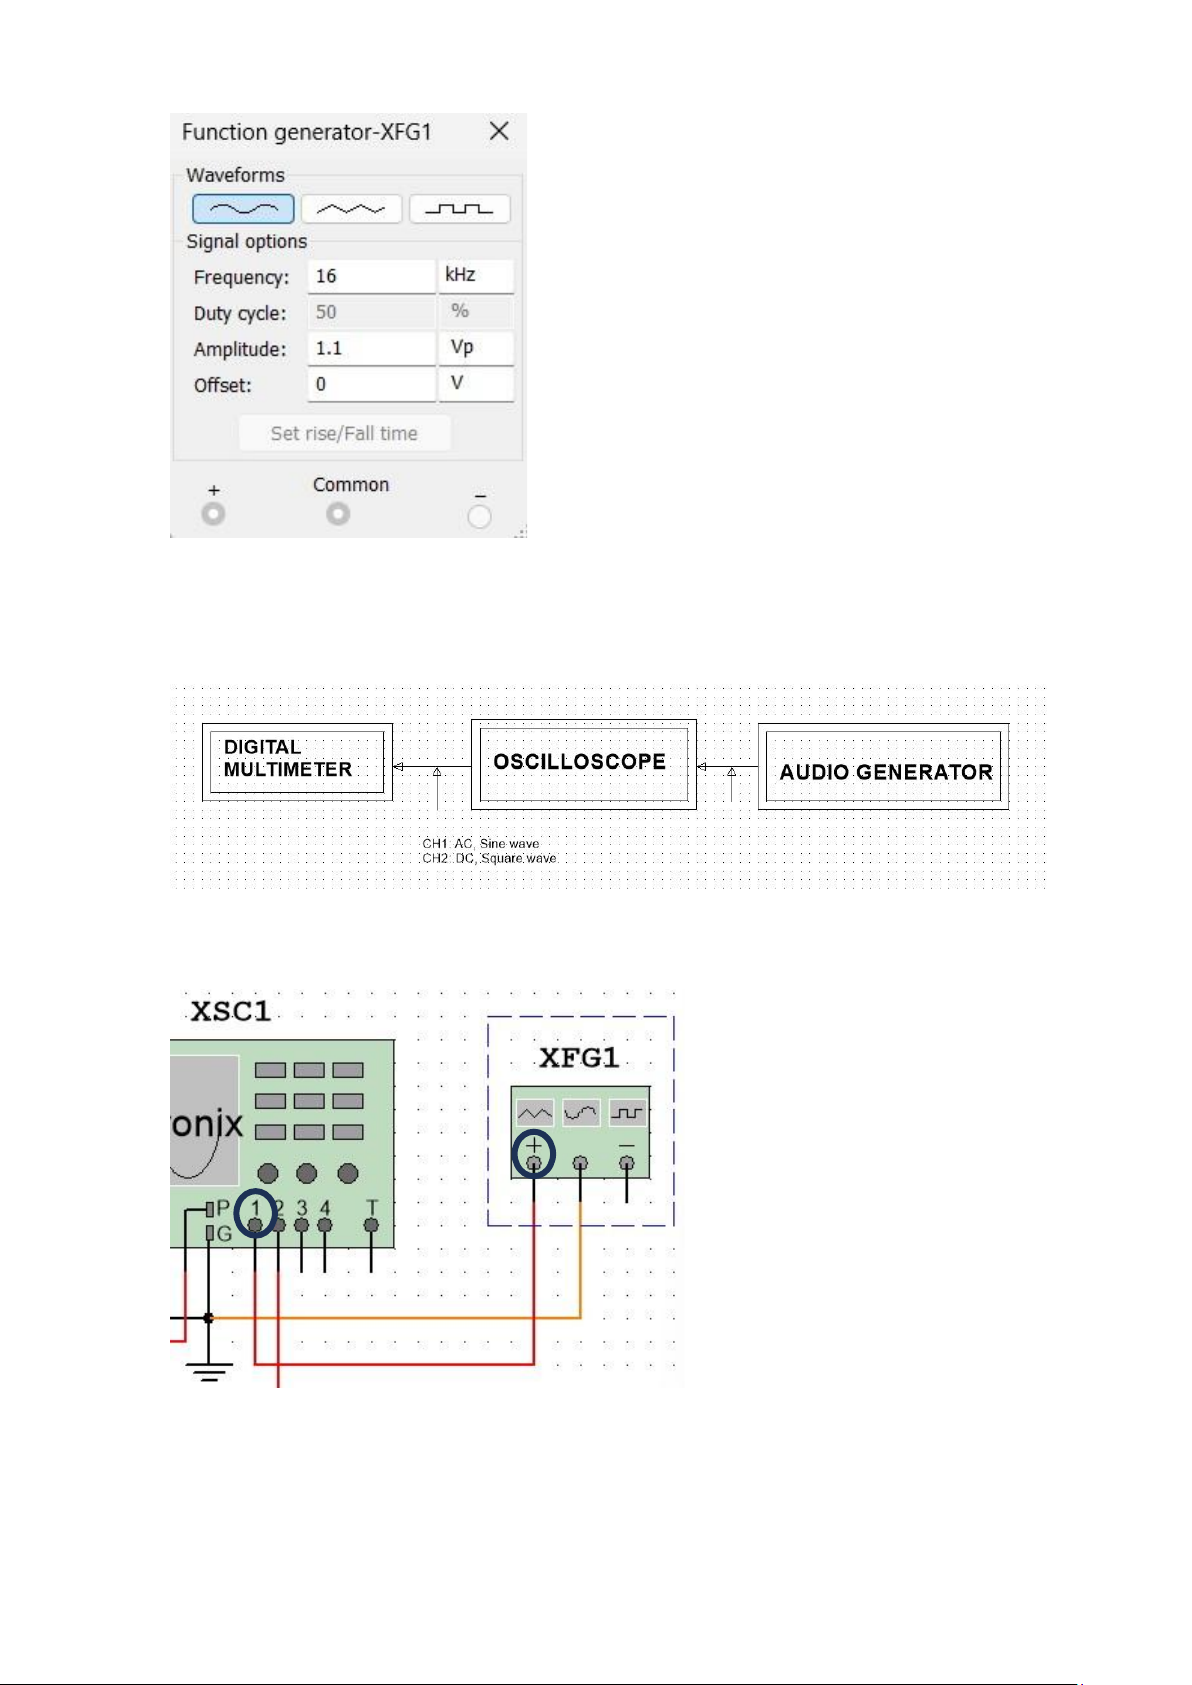
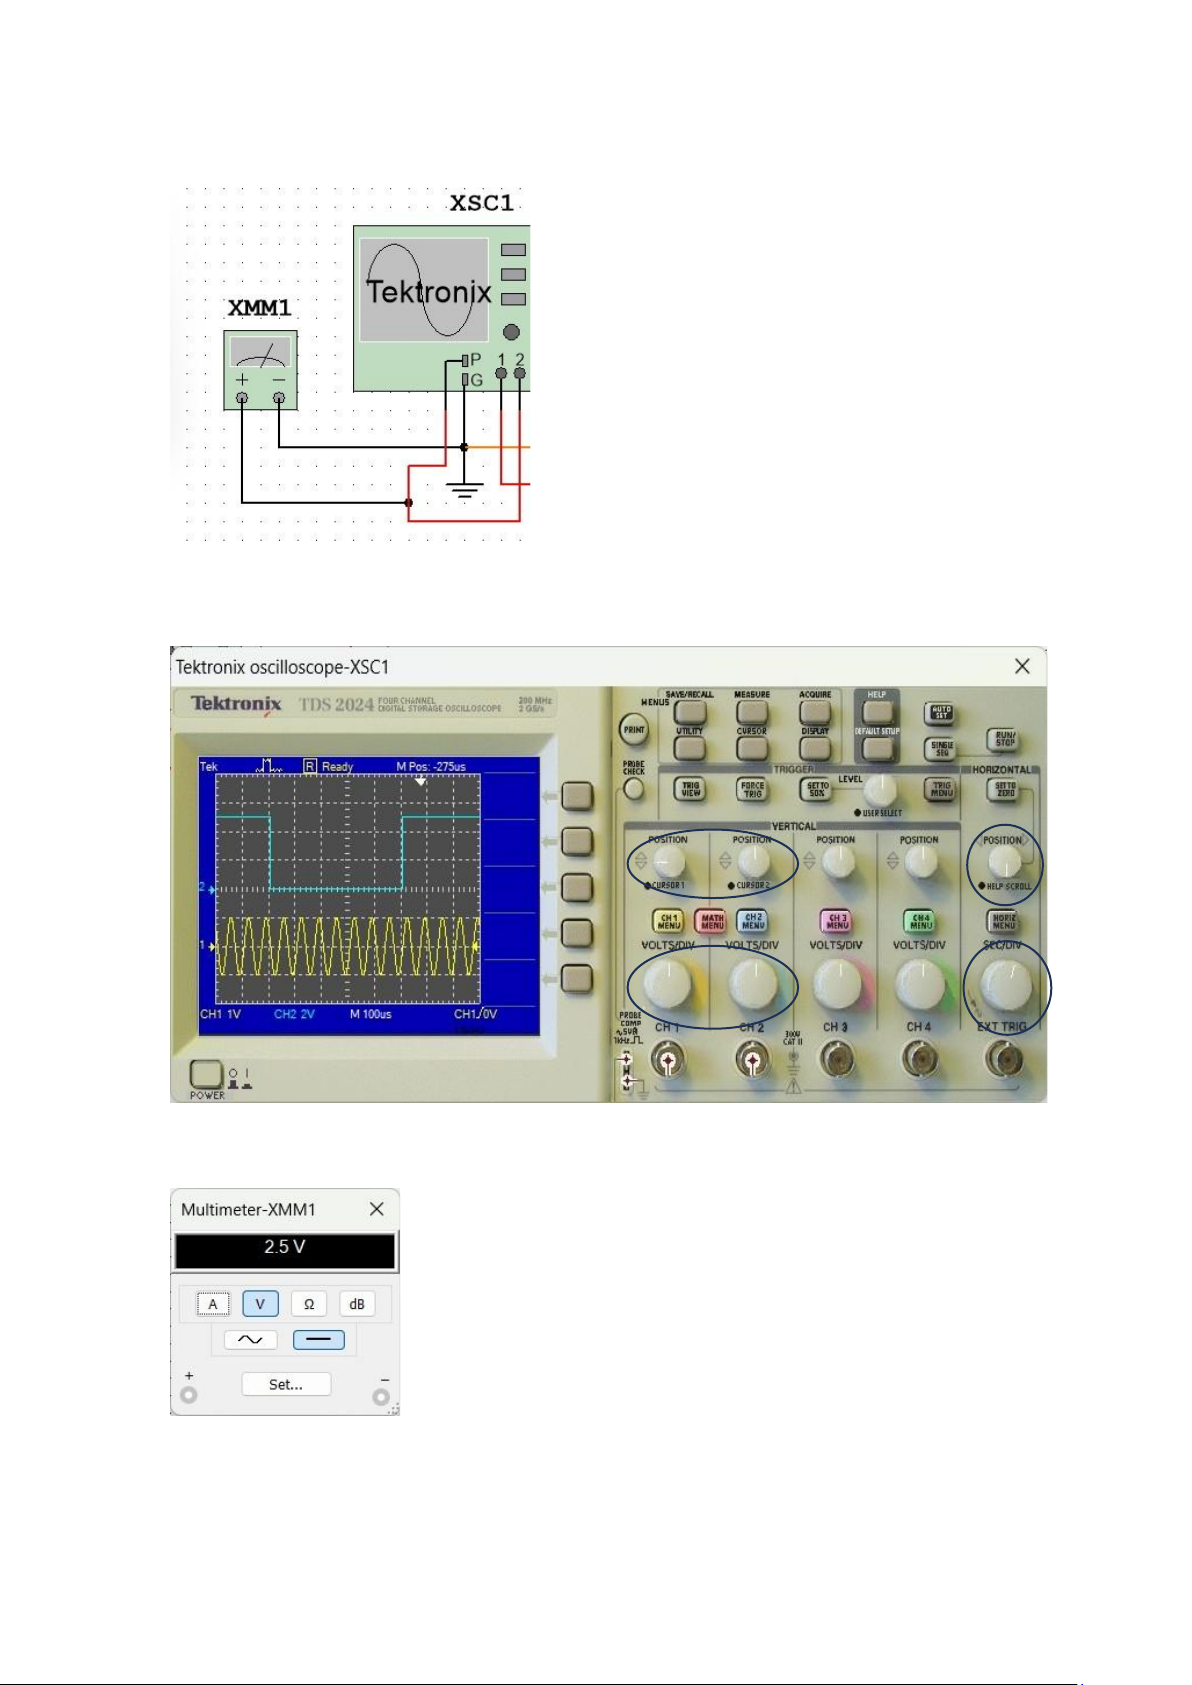
1.2.2. How to adjust basic parameters and features Figure 1: lOMoAR cPSD| 58583460 Figure 2:
Install and adjust the data in the XGF1 (Audio Generator) display board to create a
standard waveform to transmit to the XSC1 – Oscilloscope. Input equation of the
system: V1(t)= Vipsin(ωit) = 6sin(2π.16000t) V With the data: A=1.1(V),
fc=16000(Hz) and the waveform is sine wave Parameters to be adjusted: - Waveforms: sine waveform - Frequency: 16 kHz - Amplitude: 1.1 Vp lOMoAR cPSD| 58583460
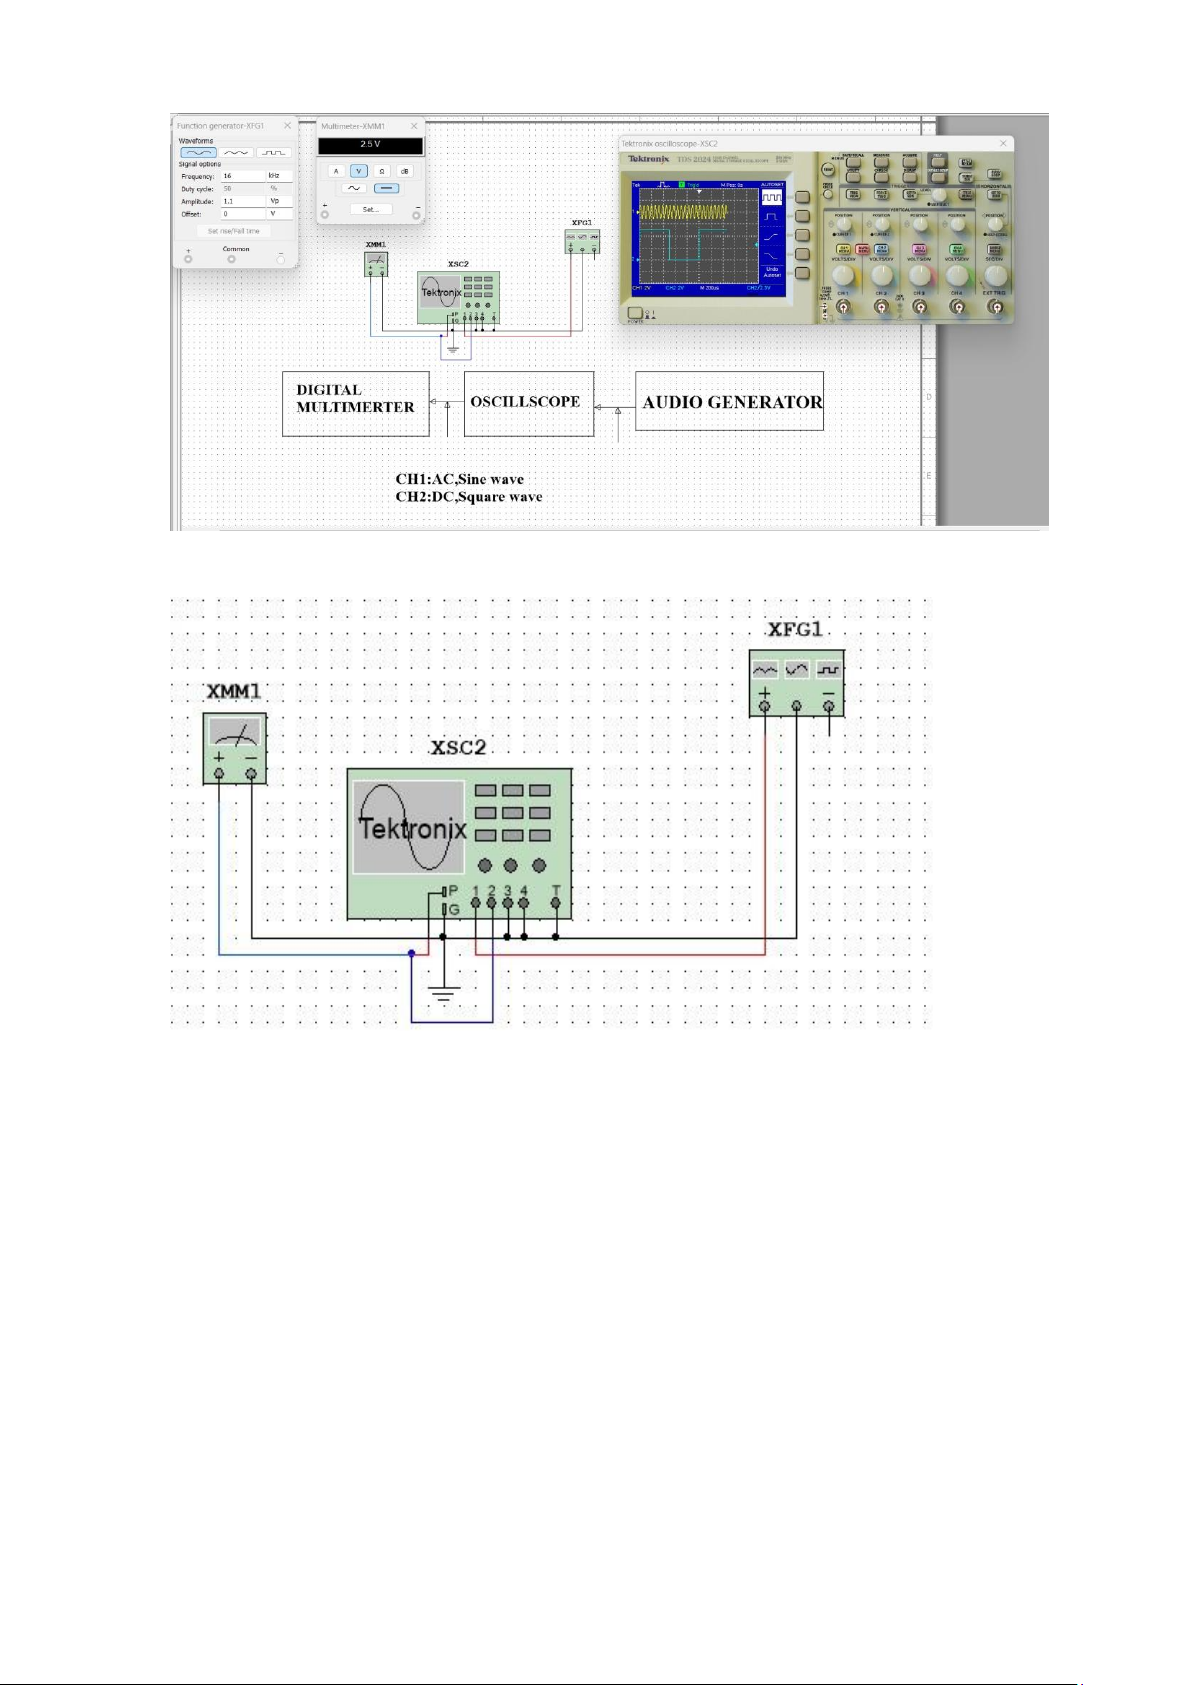
1.3.Block diagram of a system Basic block diagram:
1.4.Describe the operation of the system
XSC1 has 4 measure channels but we only need to measure 2 channels 1 and 2
Connect from XFG1 to channel number 1 (1) as shown, responsible for creating and
providing waves and transmitting to channel 1 of XSC1 lOMoAR cPSD| 58583460
XMM is used to measure the parameters of XSC1, which is measuring the actual V value of channel 2
Display XSC1: When run the simulation those will have the following results (Adjust the
knobs to display more accurate results)
Now the number displayed in XMM1 is 2.5 V, it’s meant the actual V value of channel 2 is 2.5 V.
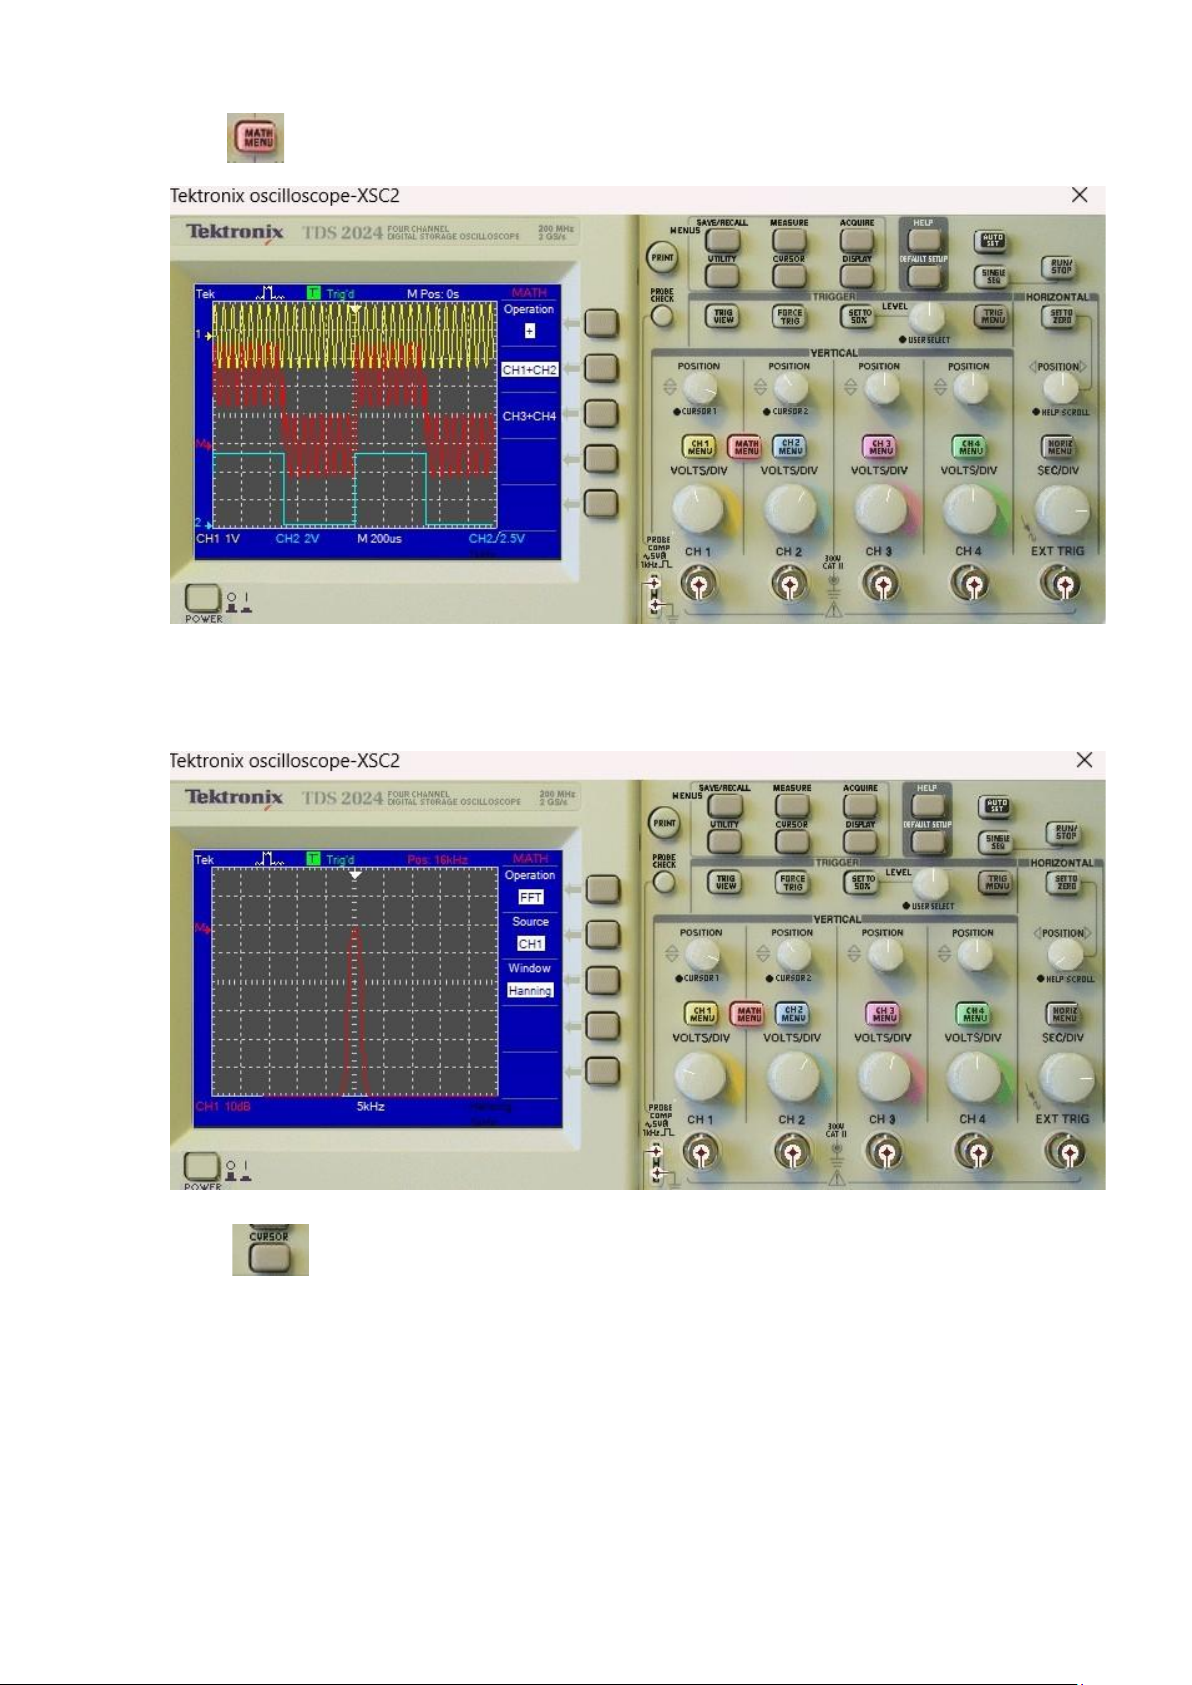
Figure 2 is the mathematical function of channel 1 lOMoAR cPSD| 58583460 Push button
The source is CH1 because we need to measure the mathematical function of channel 1
In the Window section, select Hanning
Click the button to the right of the Operation section and choose FFT Push button
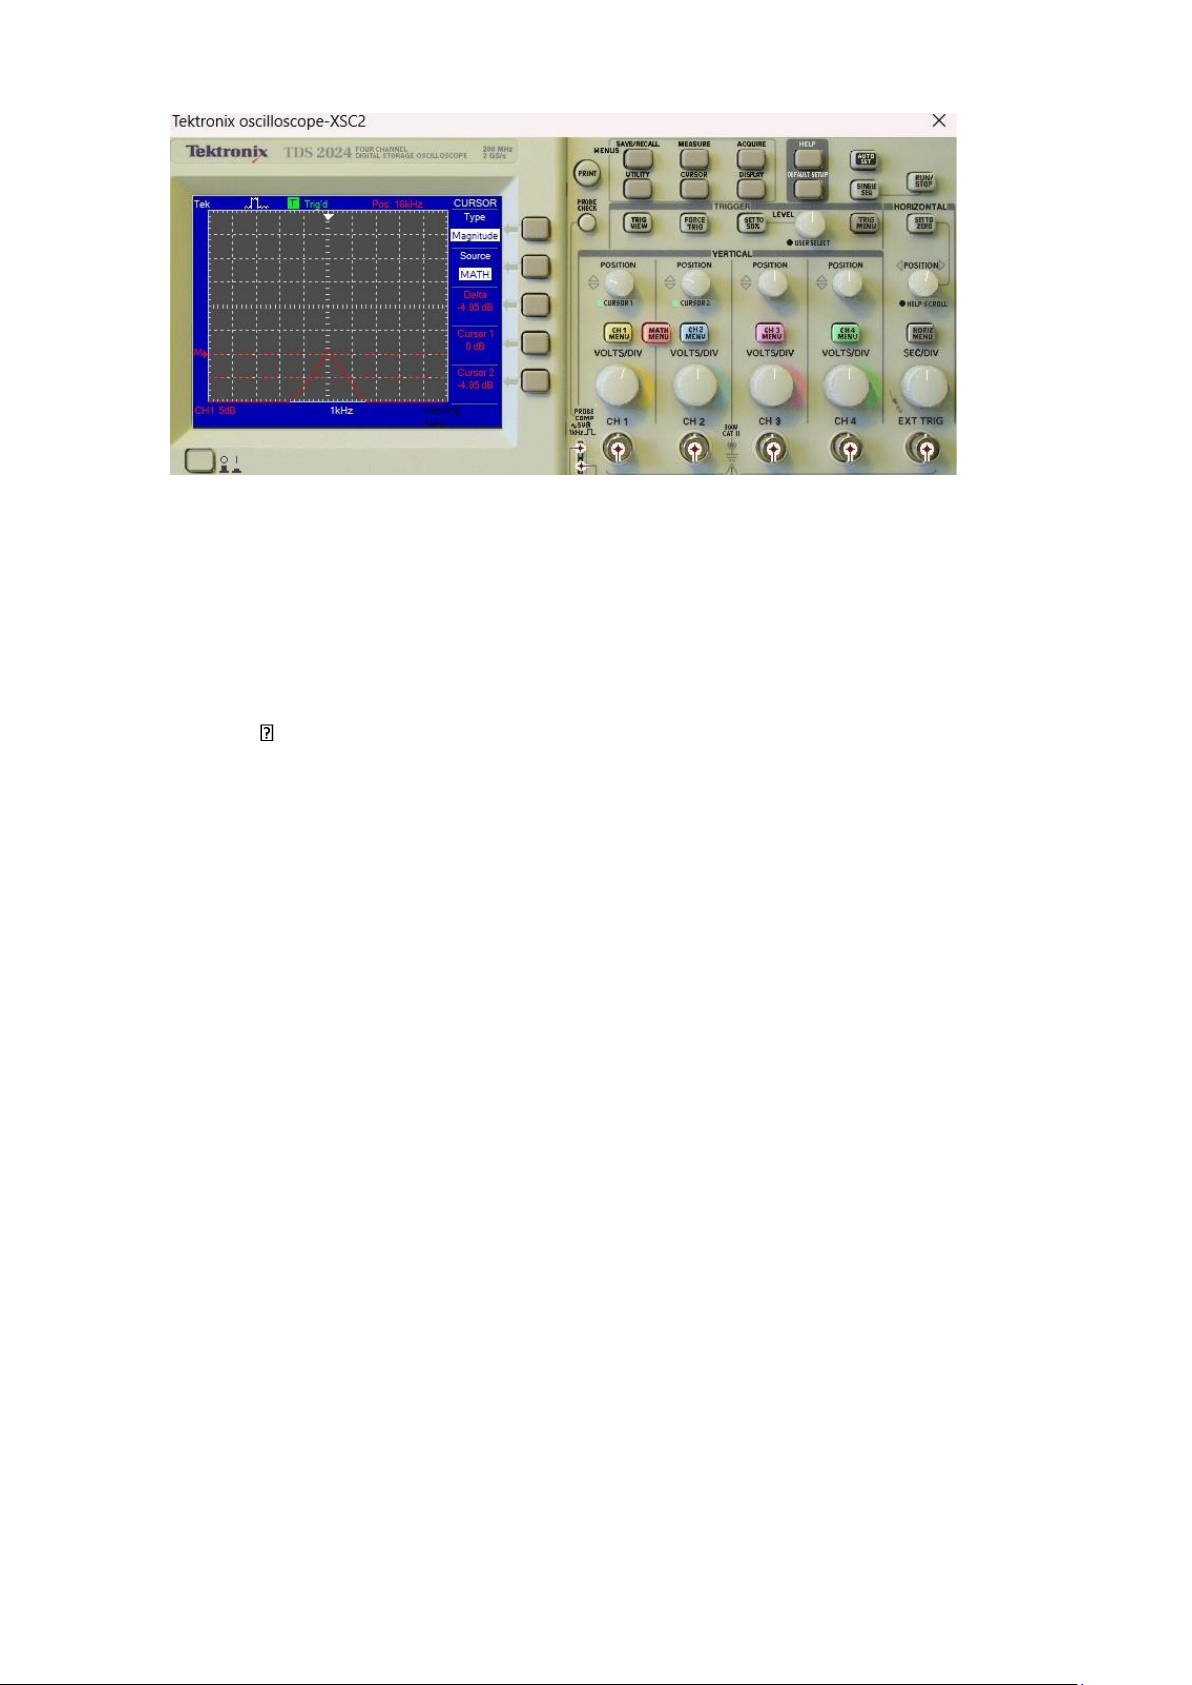
Adjust parameters as shown with the knobs then Type select Magnitude then Source is MATH and finally CH1 is 5dB
Run the simulation to get the results: lOMoAR cPSD| 58583460
Now on the display screen is the mathematical function of CH1
POS adjustment is the display frequency: 1kHz at the SEC/DIV knob
Adjust Cursor 1 and 2 to match the displayed image
- Cursor 1 is -0dB
- Cursor 2 is -4.95dB
Delta will be the result of Cursor 2 – Cursor 1 equals -4.95dB.
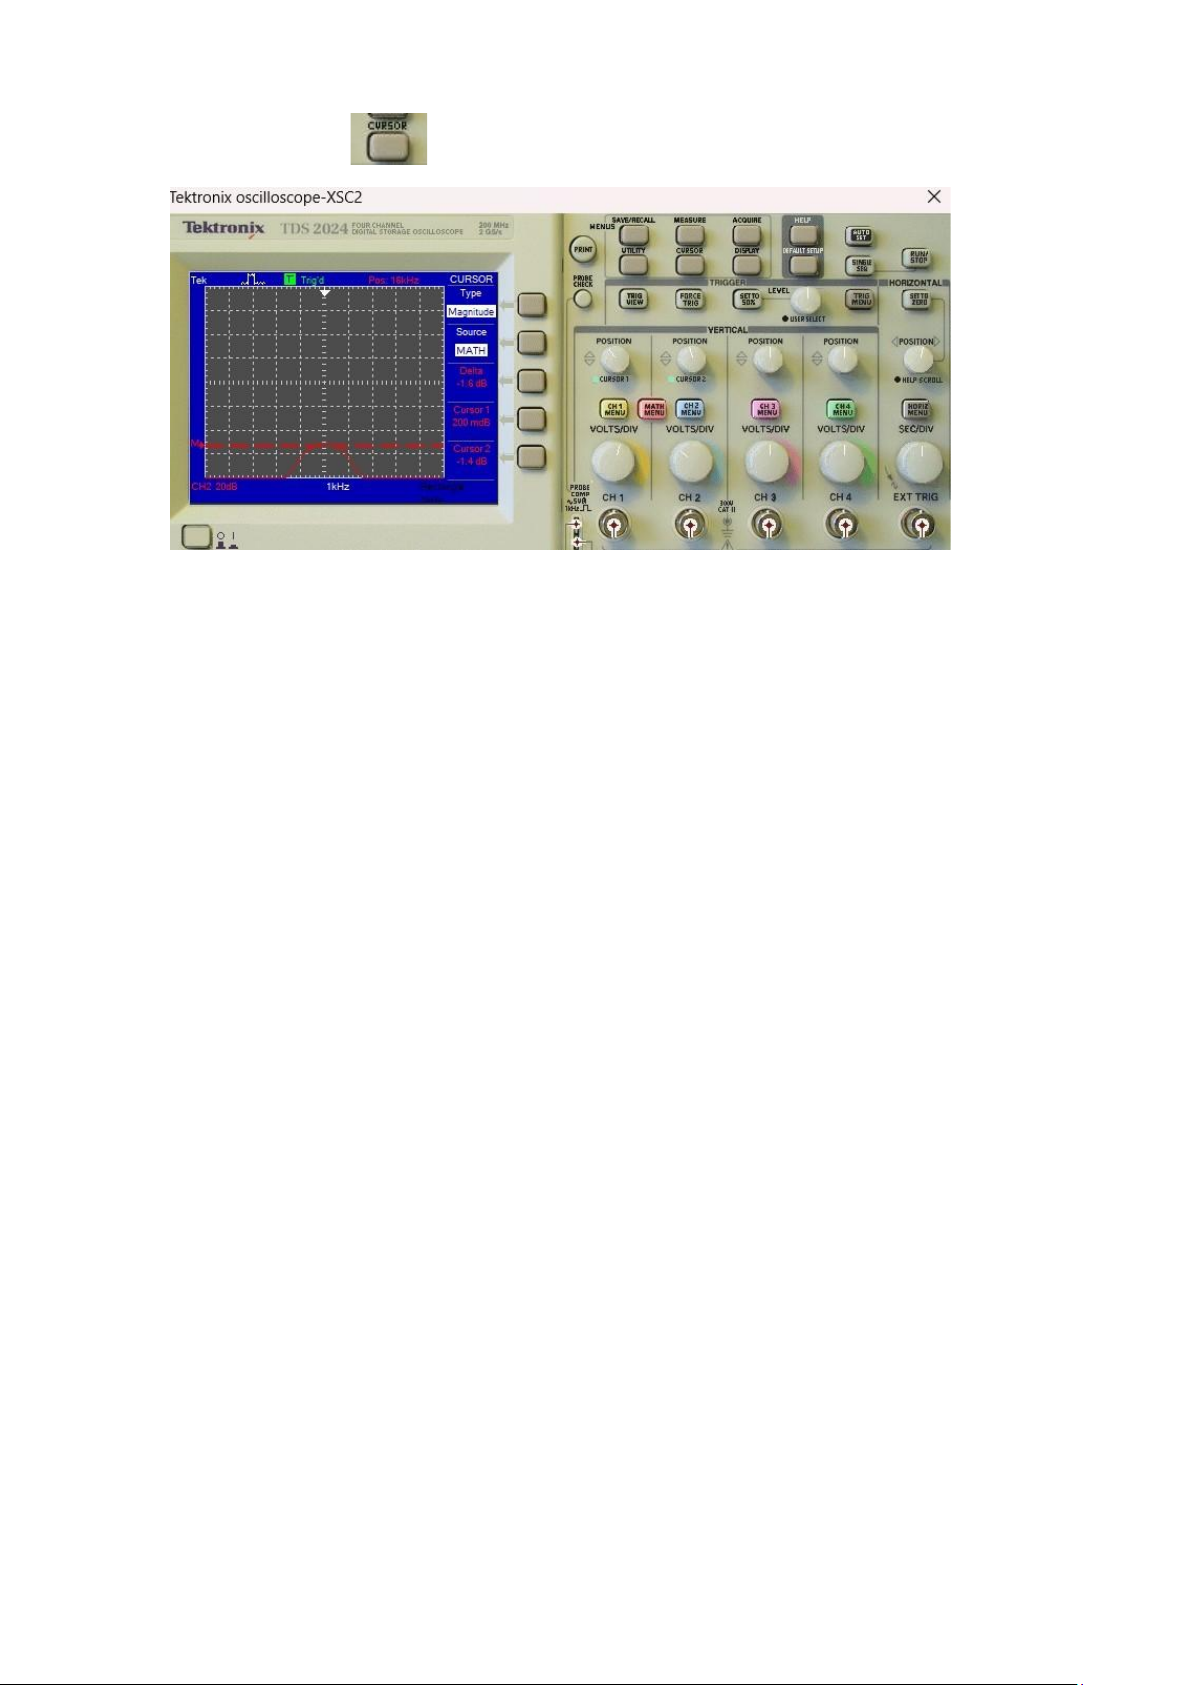
Figure 3 is the Mathematical Function of channel 2
Perform the same steps as Figure No. 2 - Select MATH MENU - Source is now CH2 - Window is Rectangle
- The part CH2 in the bottom left corner is 20dB
- Operation section is adjusted as shown in Figure 2 lOMoAR cPSD| 58583460 Select CURSOR
and run the simulation to get the results as shown below.
Now on the display screen is the mathematical function of CH2
POS adjustment is the display frequency: 1kHz at the SEC/DIV knob
Adjust Cursor 1 and 2 to match the displayed image - Cursor 1 is -200mdb - Cursor 2 is -1.4db
Delta will be the result of Cursor 2 – Cursor 1 is -1.6db
CHAPTER 2: Analysing and simulating the pulse amplitude modulation and
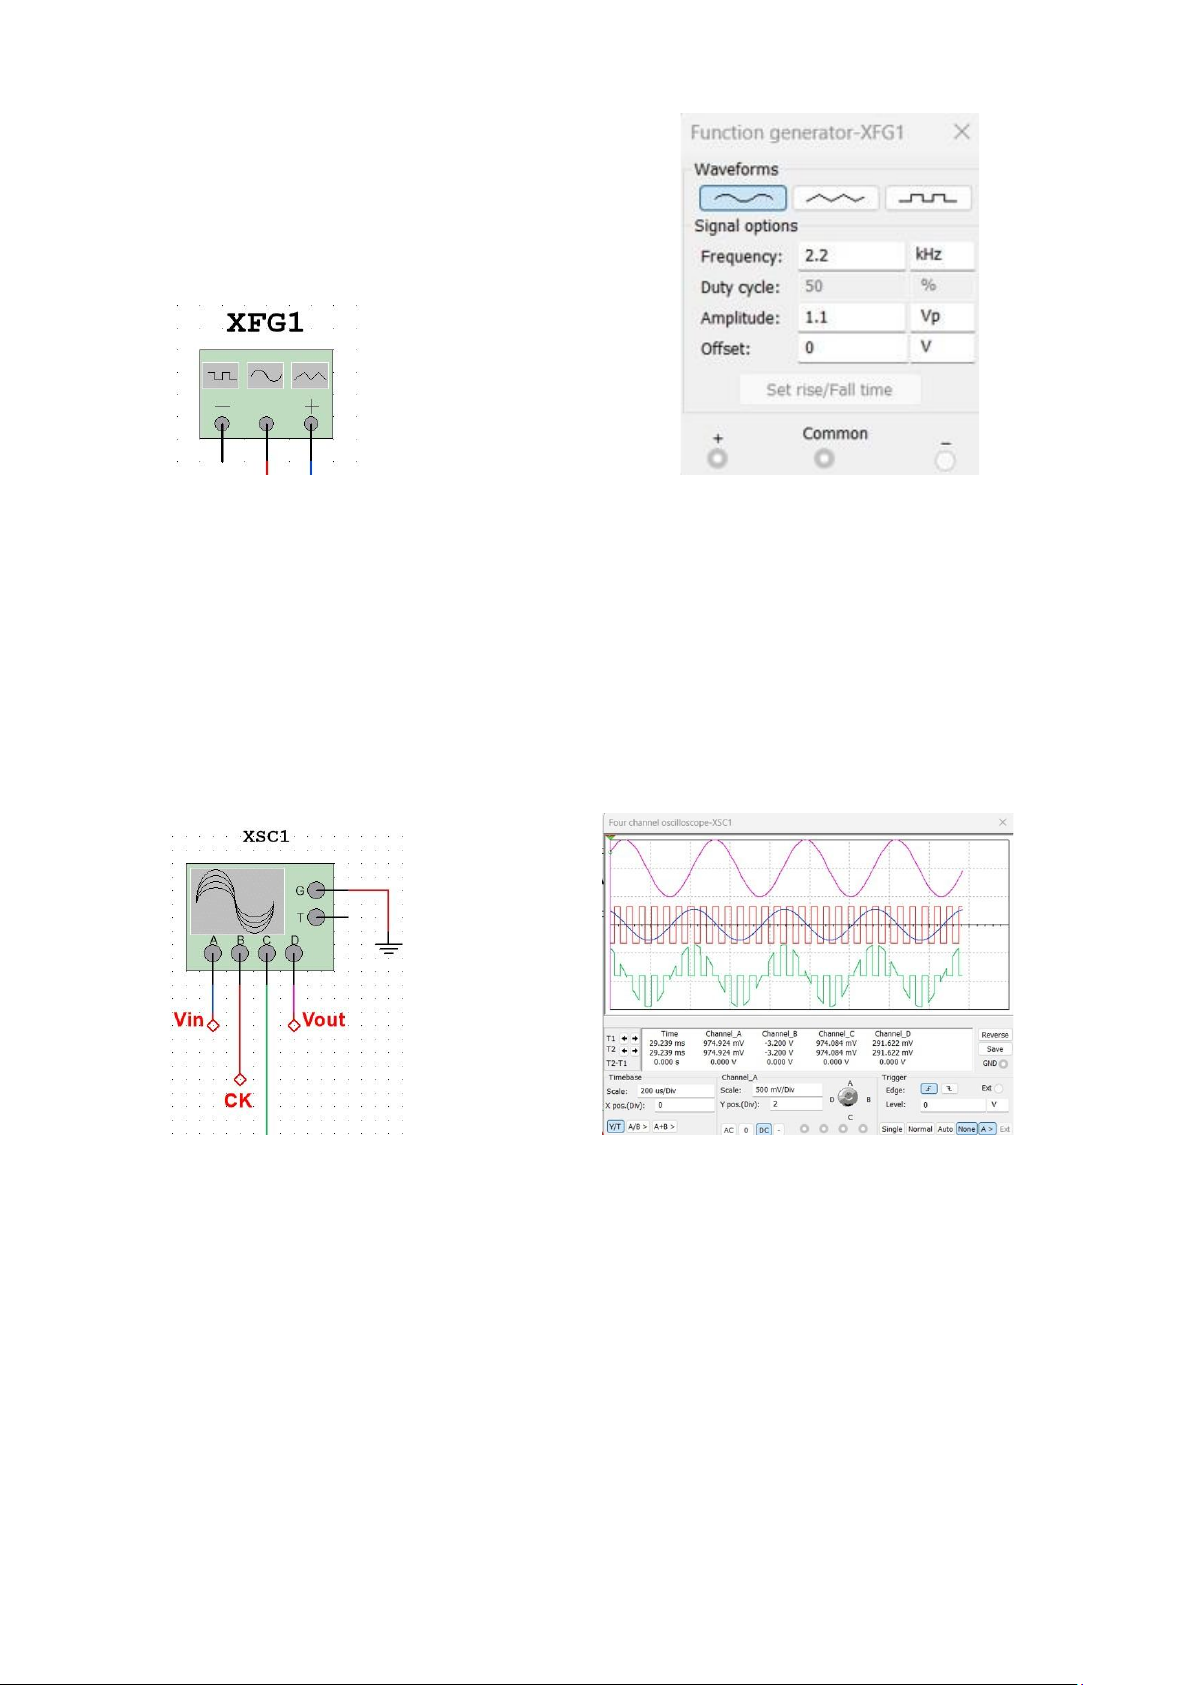
demodulation (PAM) as required Modulating frequency: 2.2kHz Modulating amplitude: 1V Sampling frequency: 16.2kHz
Amplitude of sampling signal: 3.2V 2. 2.1.Summary theory
Pulse-amplitude modulation (PAM) is a type of modulation in which the message
information is encoded in the amplitude of a series of pulses. When the sample value of
the message signal varies, the amplitudes of a train of carrier pulses are changed, resulting lOMoAR cPSD| 58583460
in an analogue pulse modulation method. Demodulation is accomplished by detecting the
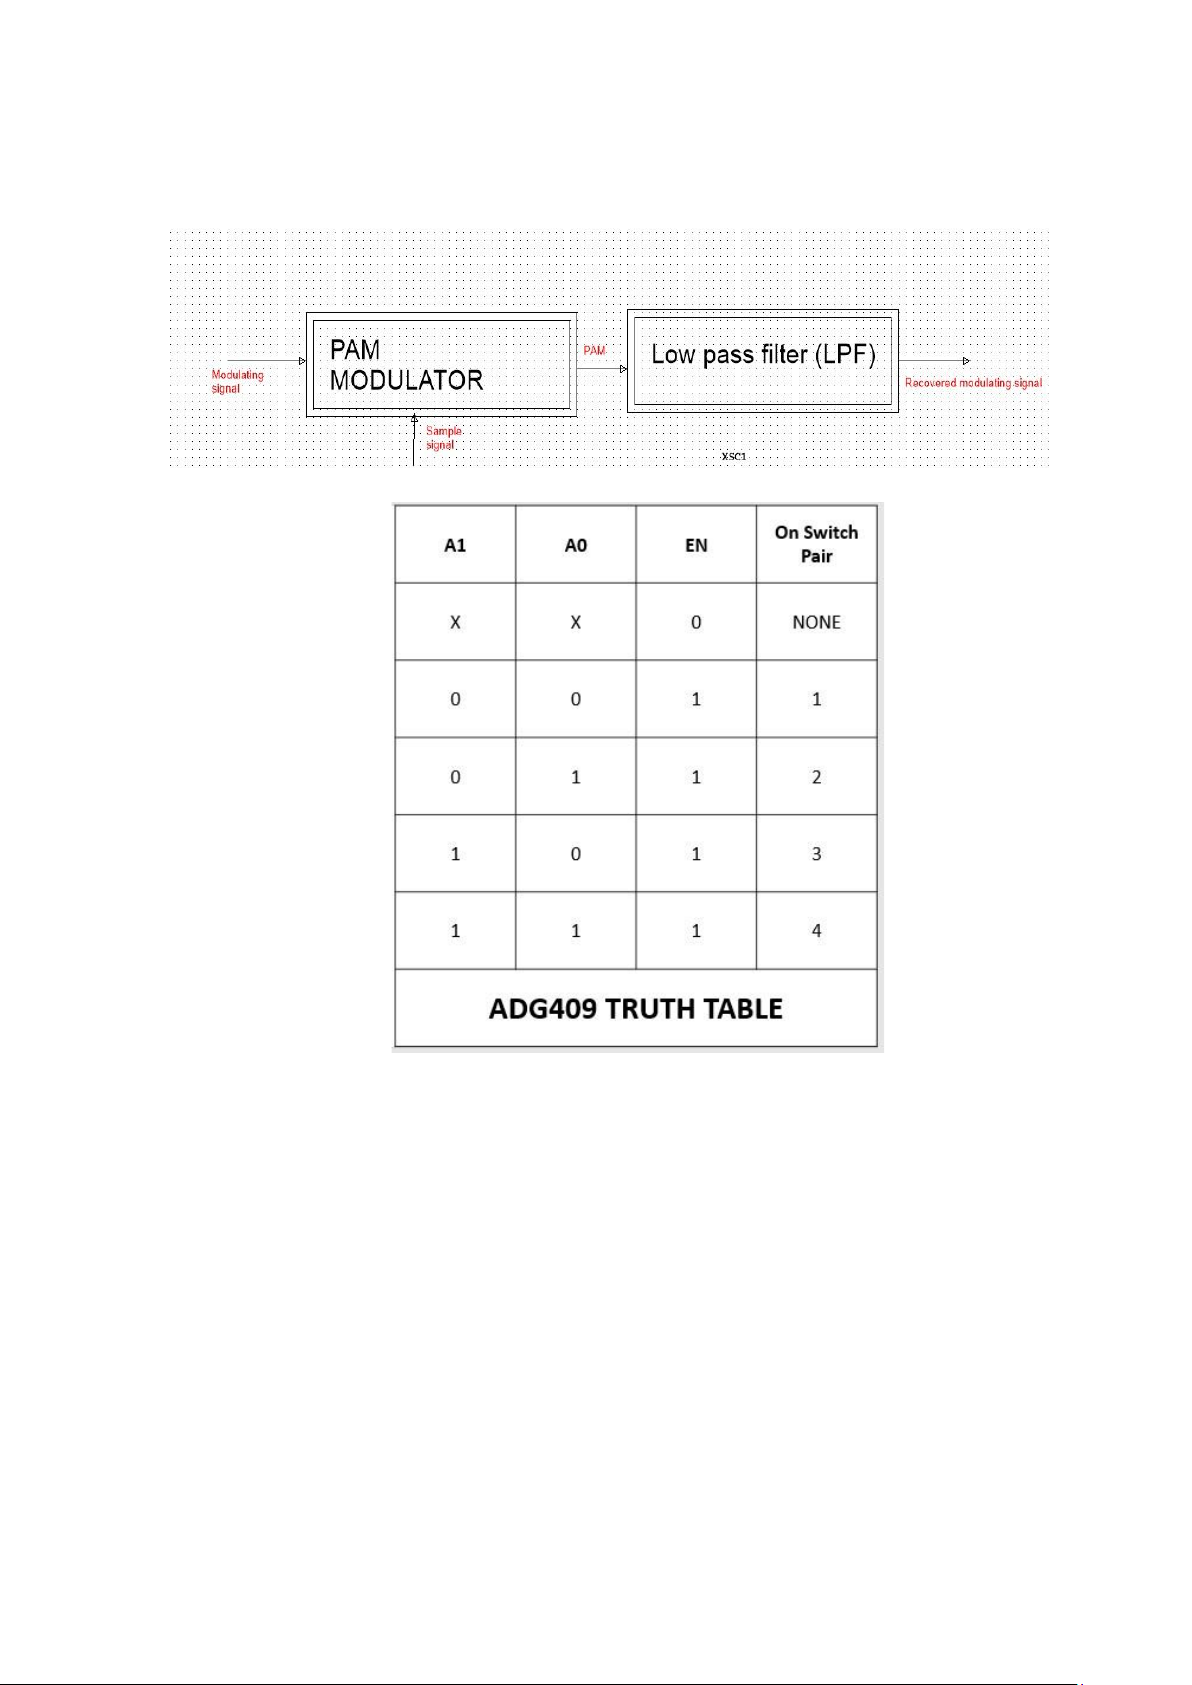
amplitude level of the carrier at each and every time period in the signal. 2.2.Block diagram
2.3.Summary of truth table (Digital IC) and function of components Function of components:
Function Generator (XFG) Show on Multisim: Parameter display: lOMoAR cPSD| 58583460 Functions:
Function generators are electronic testing equipment used to create and deliver
standard duplex form to a device being tested. (or so to speak, to try Experiment with other electronic devices
The abbreviation for those devices would be XFG(x) (where x would serve as
ordinal numbers to distinguish Function Generators) Oscilloscope (XSC) Functions:
- Uses: solve problems, some difficult errors of electronics.
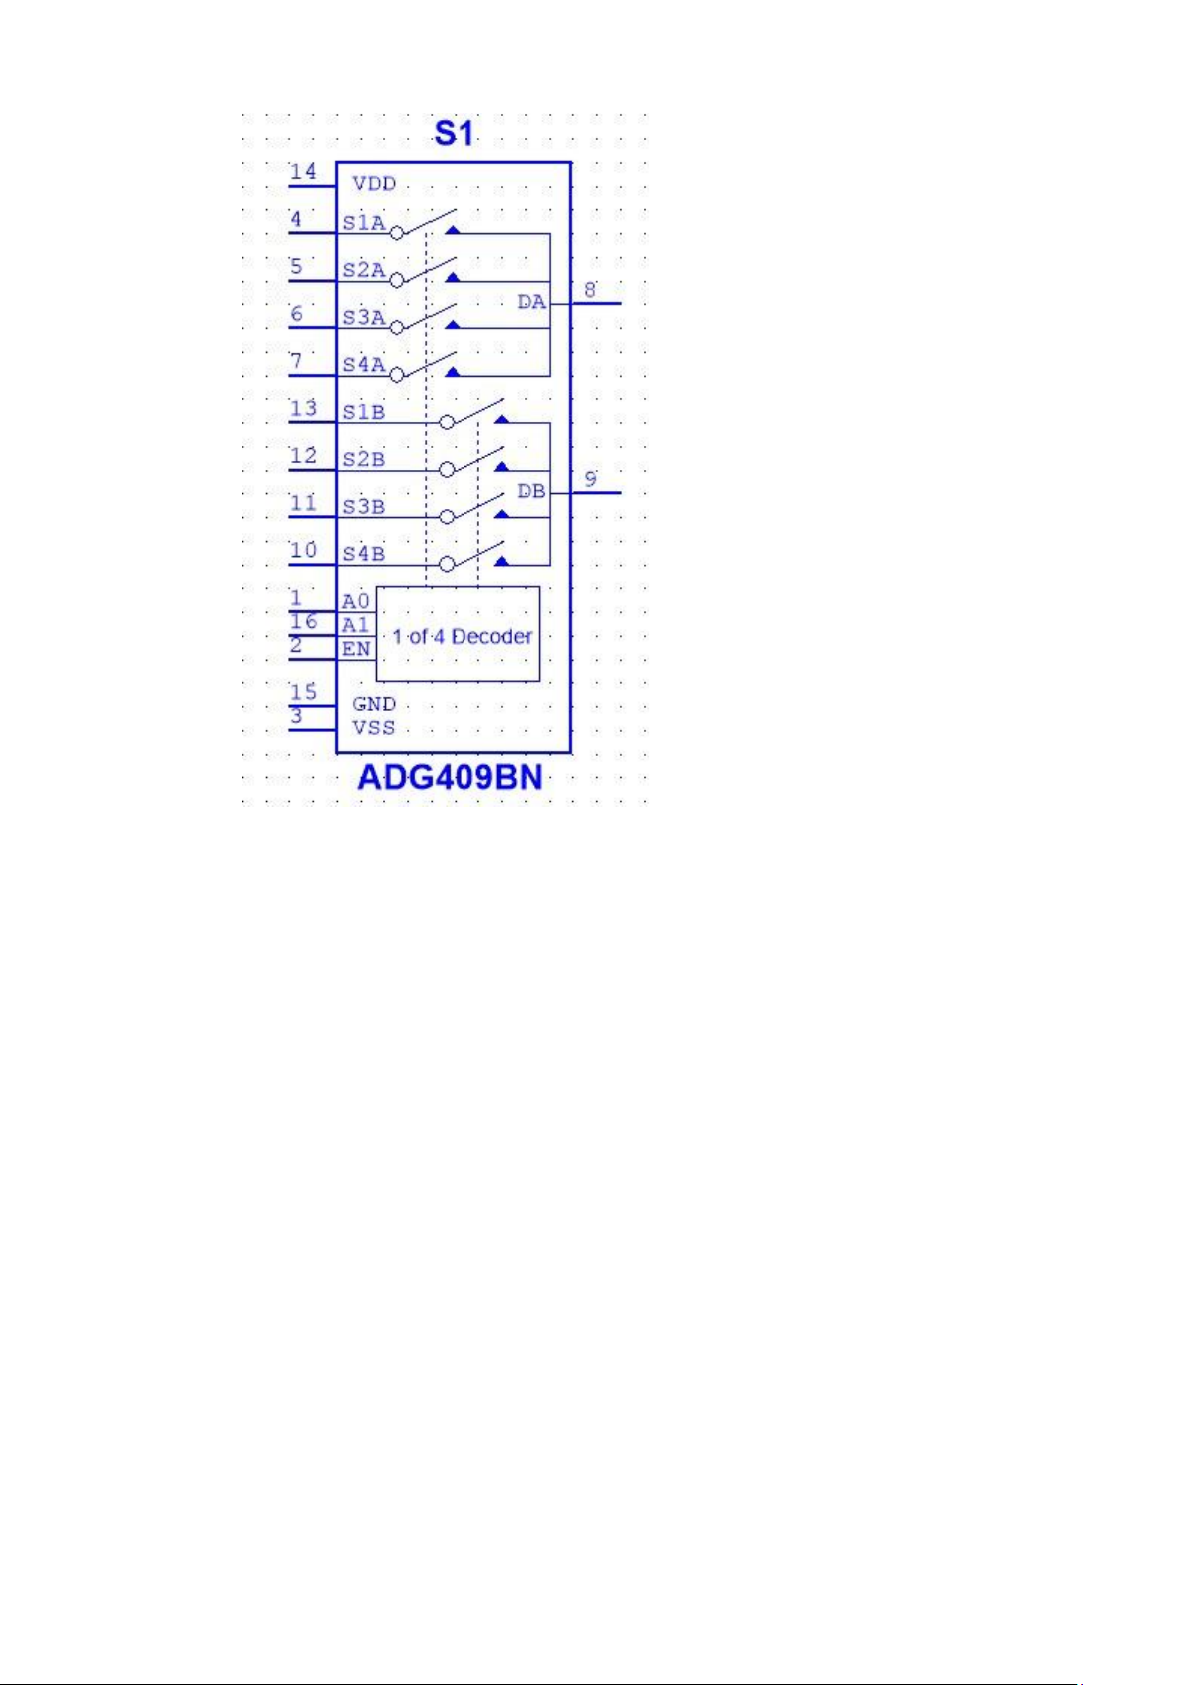
- Examples: Voltage stability errors, power filter errors, power interference; Signal form distortion, deformed. IC ADG409BN lOMoAR cPSD| 58583460 Functions:
- The ADG409 is a monolithic CMOS analog multiplexer consisting of eight single
channels and four differential channels respectively. The ADG408 converts one of
eight inputs into outputs they are identified by the 3-bit binary address lines A0,
A1 and A2. ADG409 Switch one of the four differential inputs into a common
differential output, defined by the address line 2-bit binaries A0 and A1. EN inputs
on both devices are used to turn on or off device. When the device is turned off, all channels are turned off.
- Uses: The main function of ADG409BN ICs is to provide the ability to convert
analog signals from a source into one of many different outputs. Such as Audio
Routing and video, automated test equipment, data acquisition system,
batterypowered system, system Thong take and keep samples, ...
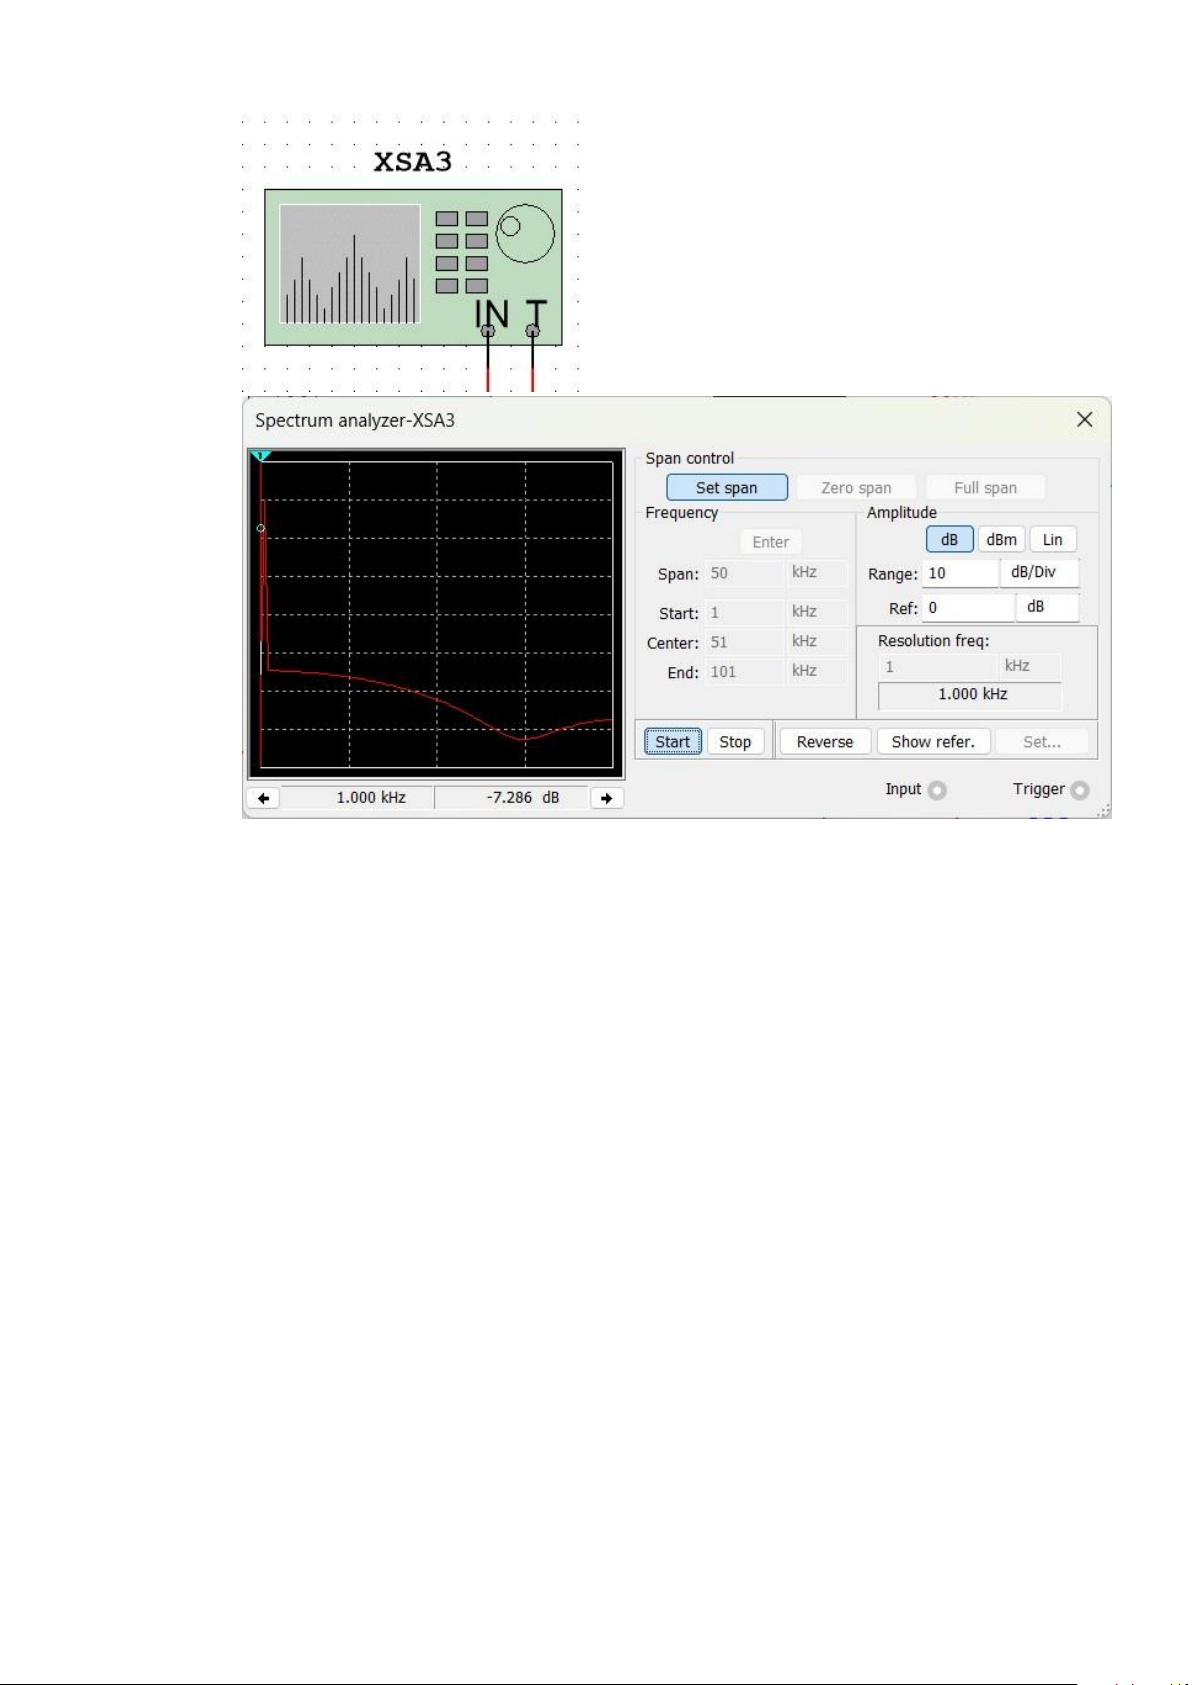
Spectrum analyzer (XSA) lOMoAR cPSD| 58583460 Functions:
- Spectrum analyzer displays a spectrum of signal amplitudes on different
frequencies. It enables analysis that determines whether signals fall within
required limits. It displays spurious signals, complex waveforms, rare
shortduration events and noise. Spectrum analyzers can also analyze transient
signals, capture burst transmissions and glitches, and show if stronger signals are
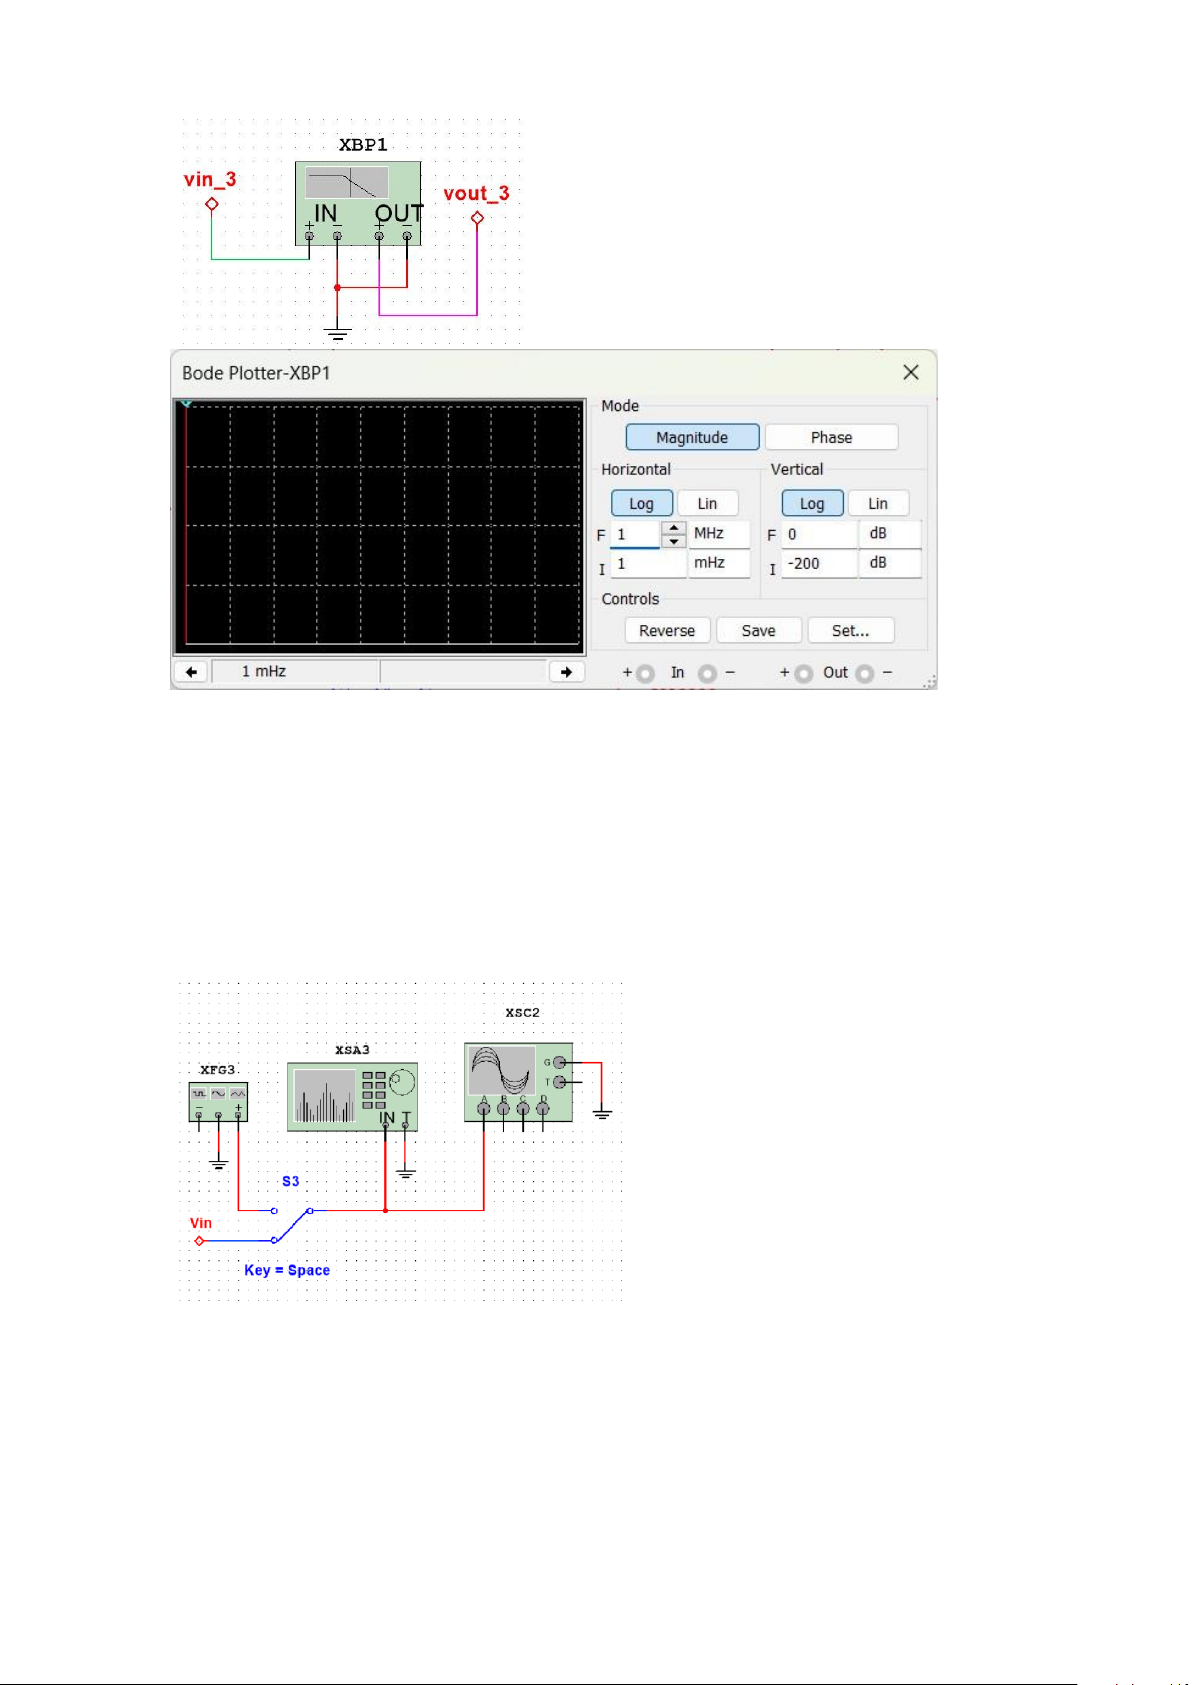
masking weaker ones. Bode plotter (XSP) lOMoAR cPSD| 58583460 Functions:
- Show the frequency response, that is, the changes in magnitude and phase as a
function of frequency. This is done on two semi-log scale plots. The top plot is
typically magnitude or “gain” in dB. The bottom plot is phase, most commonly in degrees.
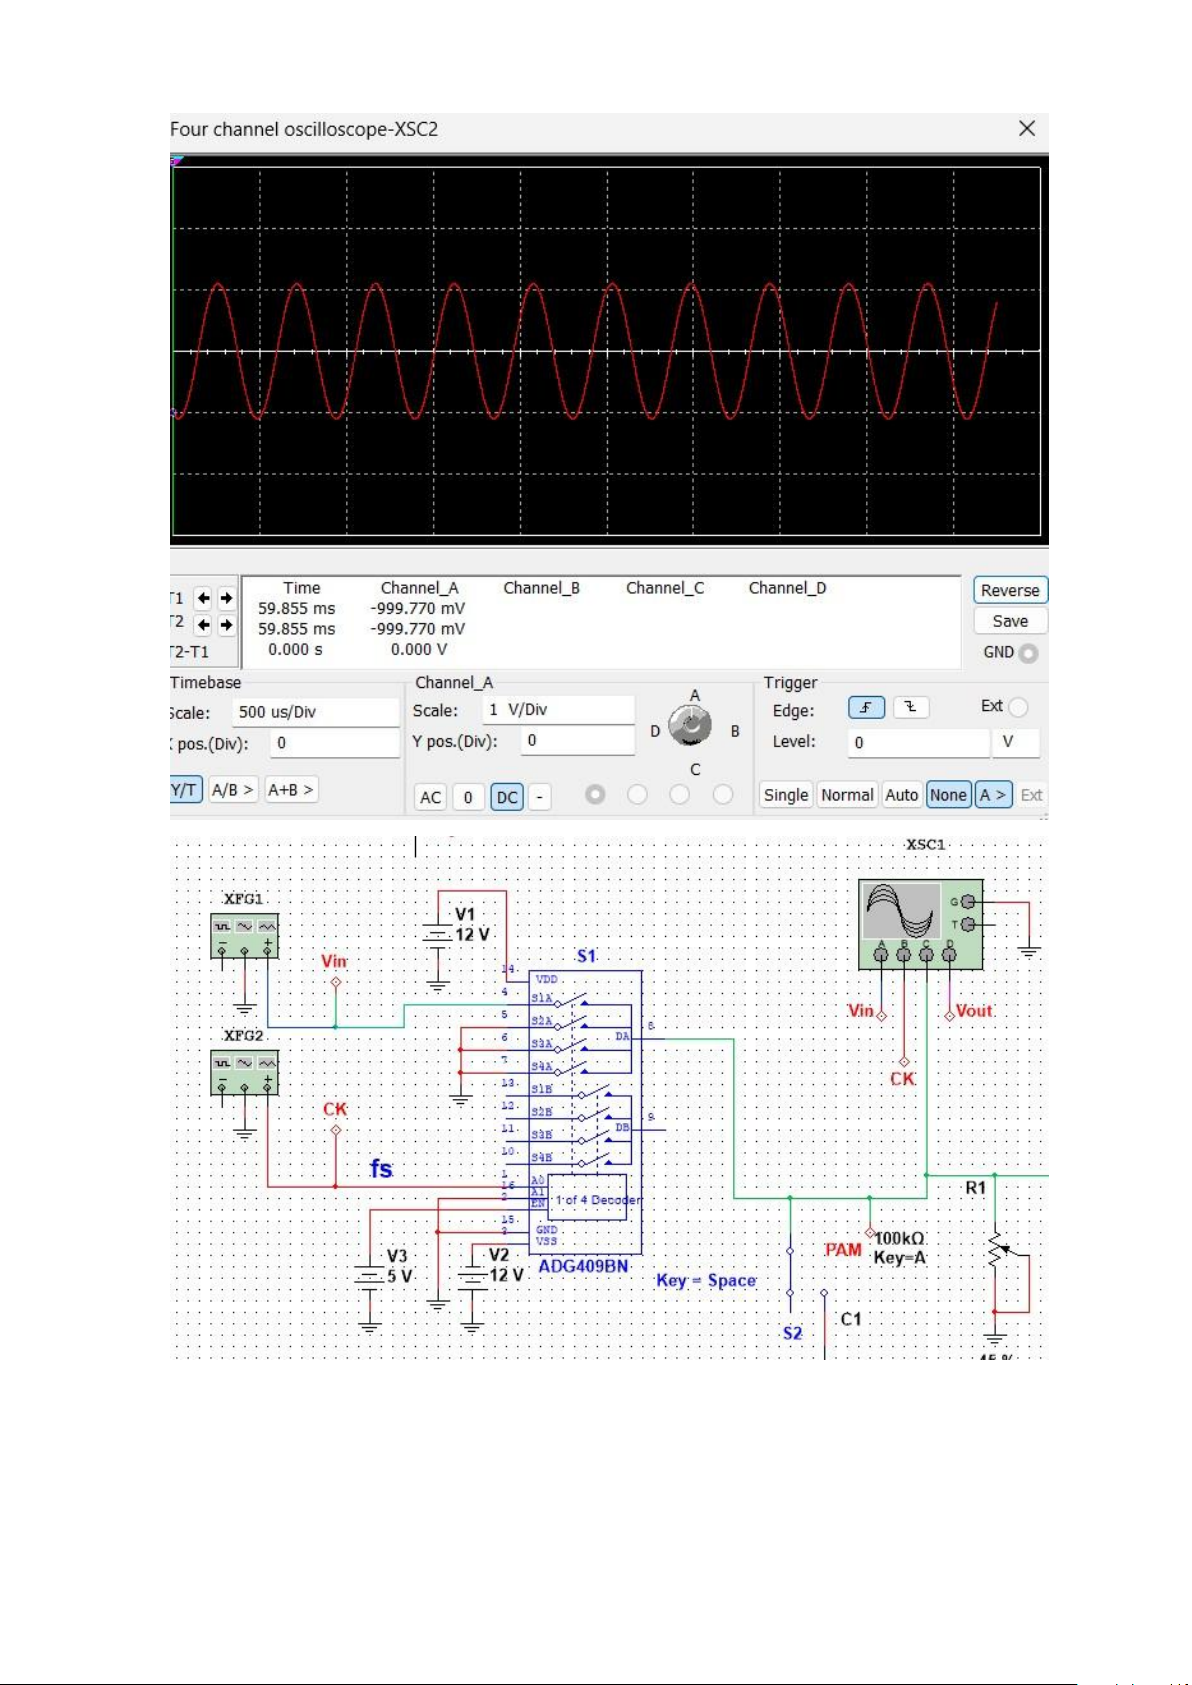
2.4.Describe the operation of the circuit. 2.4.1. PAM Modulator
XSA1, it will be the spectrum analyzer at the Vin port. XSC2 will check the input signal of the vin port.
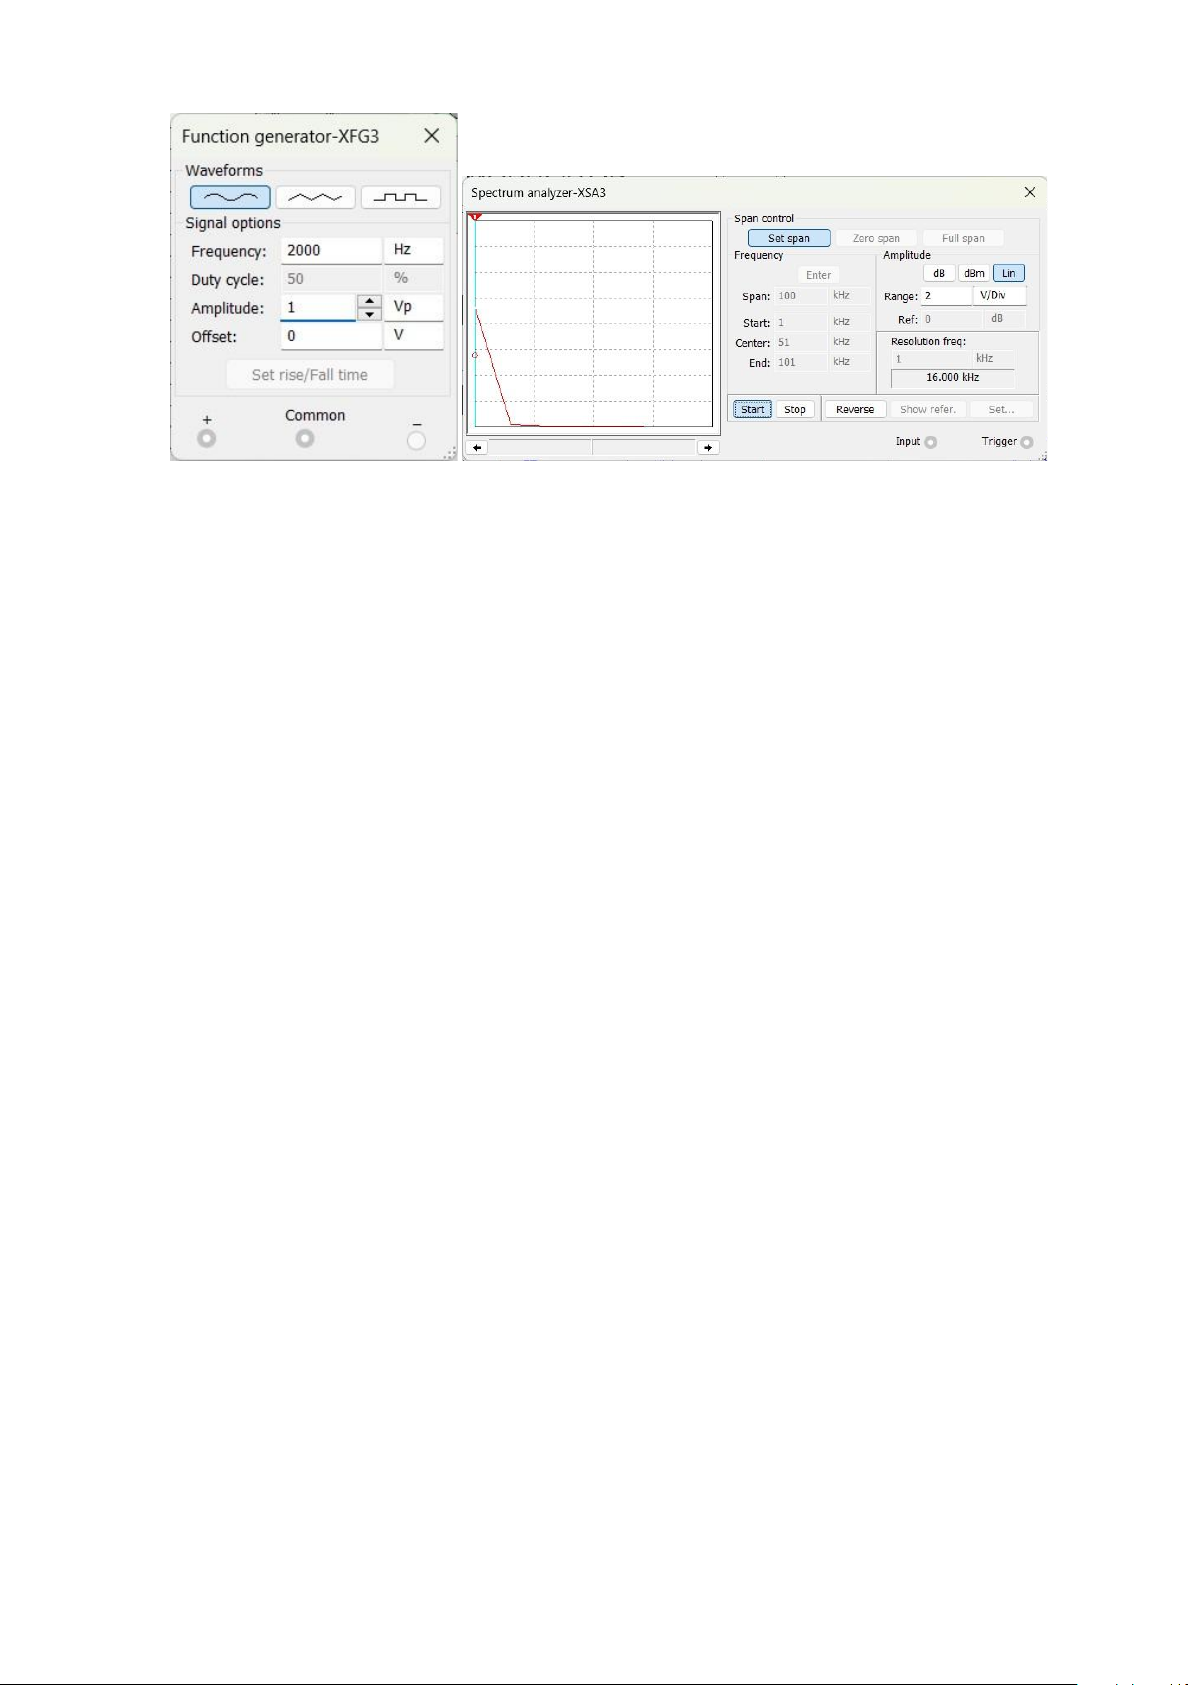
XFG3 with Frequency f=2200Hz as shown. When running the simulation, we will obtain
waveforms like those in XSC2 and XSA3 as below lOMoAR cPSD| 58583460 lOMoAR cPSD| 58583460
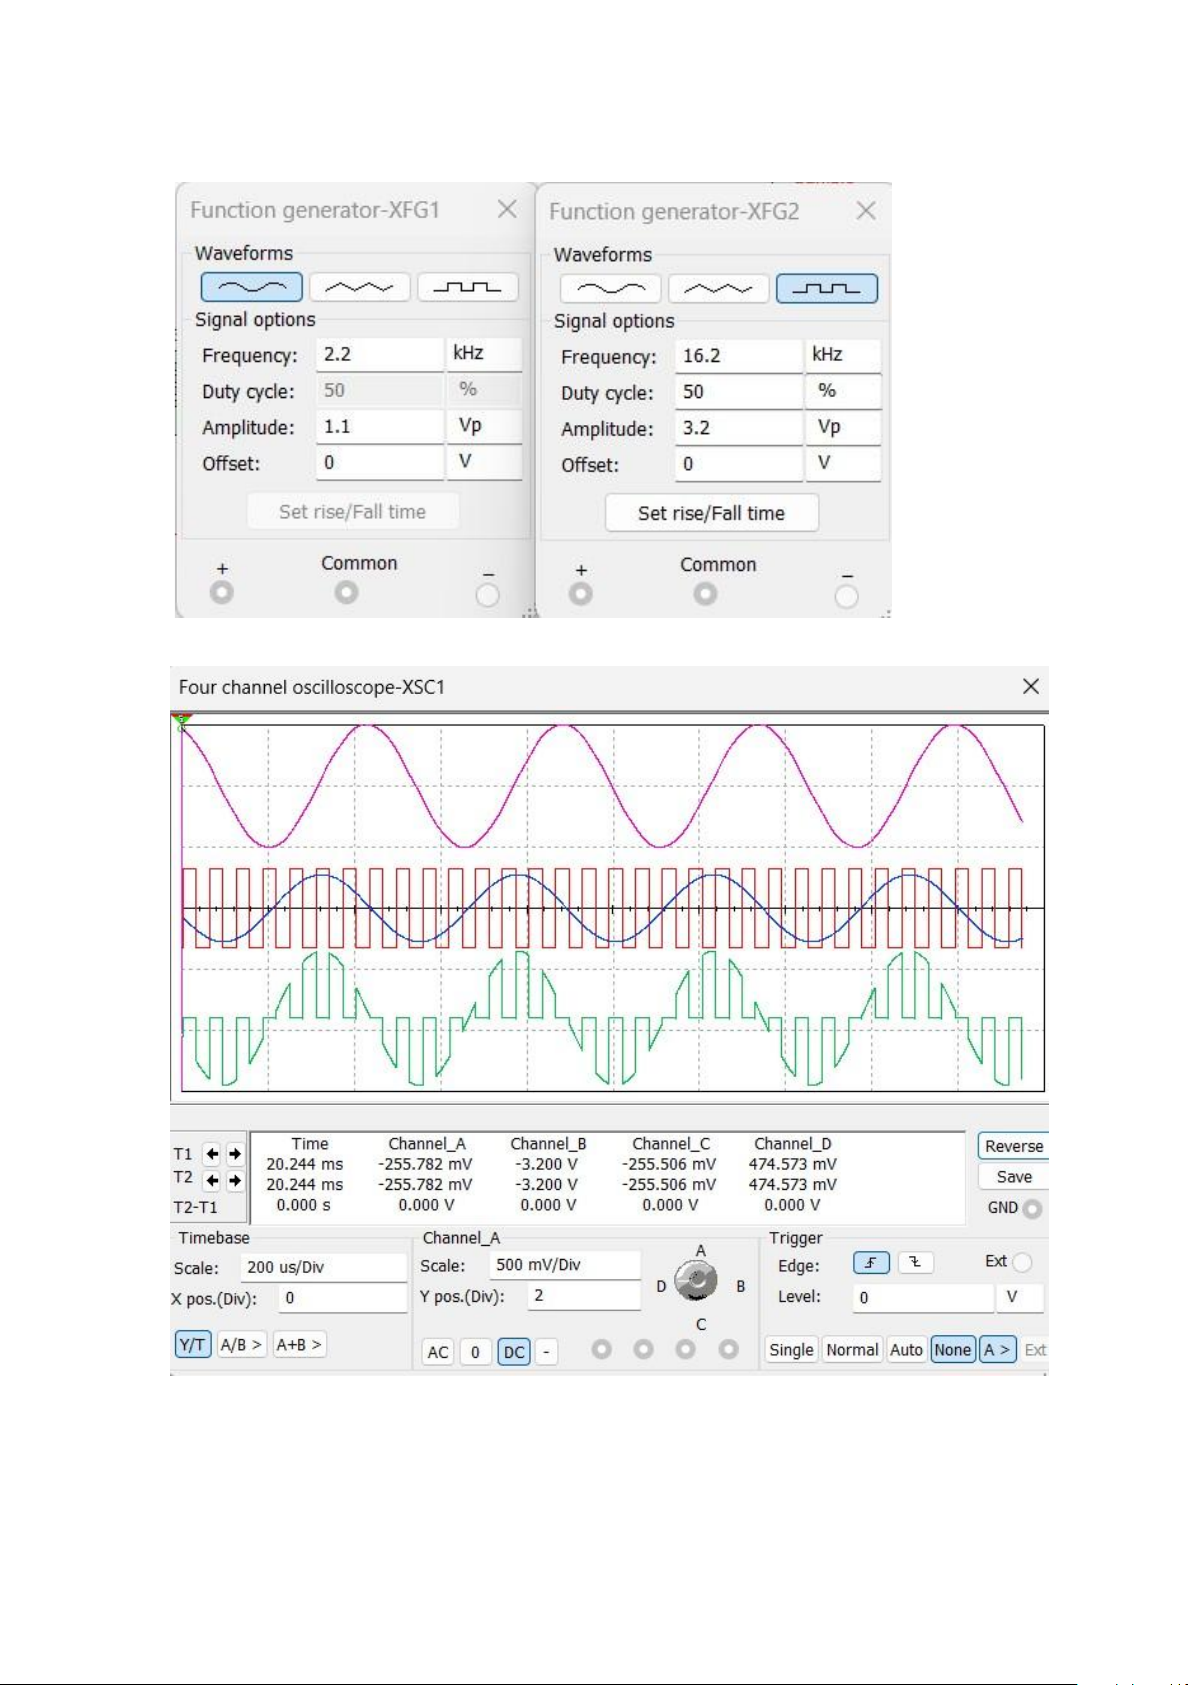
- XFG1 will act as a Modulating signal, also known as a modulating signal
- XFG2 will act as a Sample signal or sample signal lOMoAR cPSD| 58583460
- XSC1 synthesizes 2 input signals Vin of XFG1 and CK port of XFG2 With the inputs of
XFG1 and XFG2, we receive the signals at XSC1 as belows:
With the signals from XSC1, we can see the results of PAM MODULATOR 1. 2. 2.1.
Tài liệu liên quan:
-
Luận án tốt nghiệp môn Cấu trúc dữ liệu và thuật toán | Trường Đại học Sư phạm Kỹ thuật Thành phố Hồ Chí Minh
35 18 -
Trắc Nghiệm Chuyên Đề Cấu Trúc Dữ Liệu Học Kỳ 1 | Môn Cấu trúc dữ liệu và thuật toán - Đại học Sư phạm Kỹ thuật Thành phố Hồ Chí Minh
101 51 -

Queue trong C# - Cấu trúc và Phương thức | Môn Cấu trúc dữ liệu và thuật toán - Đại học Sư phạm Kỹ thuật Thành phố Hồ Chí Minh
131 66 -
Báo cáo đồ án giữa kì lần 2 | Môn Cấu trúc dữ liệu và thuật toán - Đại học Sư phạm Kỹ thuật Thành phố Hồ Chí Minh
139 70 -
Bài tập chương 3: Mạng và con trỏ | Môn Cấu trúc dữ liệu và thuật toán - Đại học Sư phạm Kỹ thuật Thành phố Hồ Chí Minh
136 68