Chapter 4: Analyzing Financial Statements | Tài liệu Tiếng Anh
Chapter 4: Analyzing Financial Statements | Tài liệu Tiếng Anh
Môn: Tiếng Anh chuyên ngành 332 tài liệu
Trường: Tài liệu Tiếng Anh chuyên ngành, Tiếng Anh cho người đi làm 432 tài liệu
Tác giả:


Preview text:
Fundamentals of Corporate Finance, 2/e ROBERT PARRINO, PH.D. DAVID S. KIDWELL, PH.D. THOMAS W. BATES, PH.D.
Chapter 4: Analyzing Financial Statements Learning Objectives
1. EXPLAIN THE THREE PERSPECTIVES FROM
WHICH FINANCIAL STATEMENTS CAN BE VIEWED.
2. DESCRIBE COMMON-SIZE FINANCIAL
STATEMENTS, EXPLAIN WHY THEY ARE USED,
AND BE ABLE TO PREPARE AND USE THEM TO
ANALYZE THE HISTORICAL PERFORMANCE OF A FIRM. Learning Objectives
3. DISCUSS HOW FINANCIAL RATIOS FACILITATE
FINANCIAL ANALYSIS, AND BE ABLE TO
COMPUTE AND USE THEM TO ANALYZE A FIRM’S PERFORMANCE.
4. DESCRIBE THE DUPONT SYSTEM OF ANALYSIS
AND BE ABLE TO USE IT TO EVALUATE A
FIRM’S PERFORMANCE AND IDENTIFY
CORRECTIVE ACTIONS THAT MAY BE NECESSARY. Learning Objectives
5. EXPLAIN WHAT BENCHMARKS ARE, DESCRIBE
HOW THEY ARE PREPARED, AND DISCUSS
WHY THEY ARE IMPORTANT IN FINANCIAL STATEMENT ANALYSIS.
6. IDENTIFY THE MAJOR LIMITATIONS IN USING FINANCIAL STATEMENT ANALYSIS.
Background for Financial Statement Analysis o PERSPECTIVES FOR ANALYSIS • Stockholder • Manager • Creditor
Background for Financial Statement Analysis o STOCKHOLDER’S PERSPECTIVE • Focus on net cash flows risk rate of return
market value of firm’s stock
Background for Financial Statement Analysis o MANAGER’S PERSPECTIVE • Focus on rate of return efficient use of assets control ing costs increasing net cash flows
increasing market value of firm’s stock job security
Background for Financial Statement Analysis o CREDITOR’S PERSPECTIVE • Focus on
predictability of revenues and expenses
ability to meet short-term obligations
ability to make loan payments as scheduled
no unanticipated change in risk IMPORTANT
Background for Financial Statement Analysis
o GUIDELINES FOR FINANCIAL STATEMENT ANALYSIS
• Understand which perspective for: stockholder, manager or creditor.
• Use audited financial statements.
• Trend analysis (3-5 years).
• Compare a firm’s financial statement with
competitors that are the same size, products, services.
• Benchmark: firms compared in a same industry
Common-Size Financial Statements o CO
. MMON-SIZE FINANCIAL STATEMENTS
• Show the dollar amount of each item as a
percentage of a reference value (total assets or total revenues)
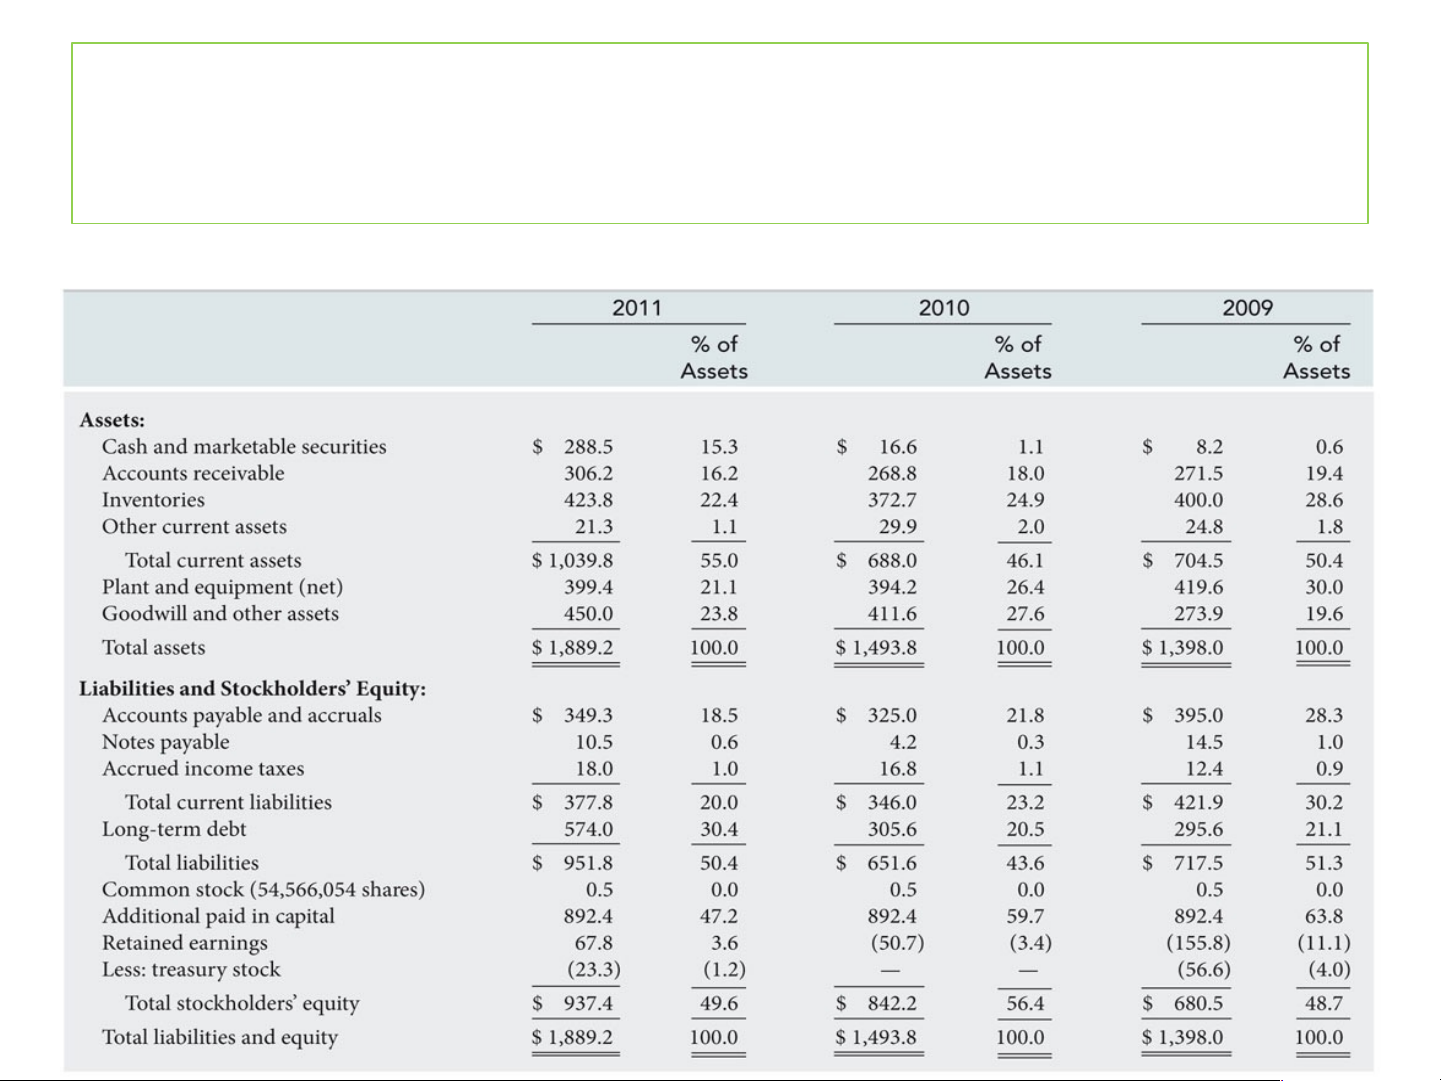
Common-size balance sheet may use total assets as the
reference value; each item is expressed as a percentage of total assets.
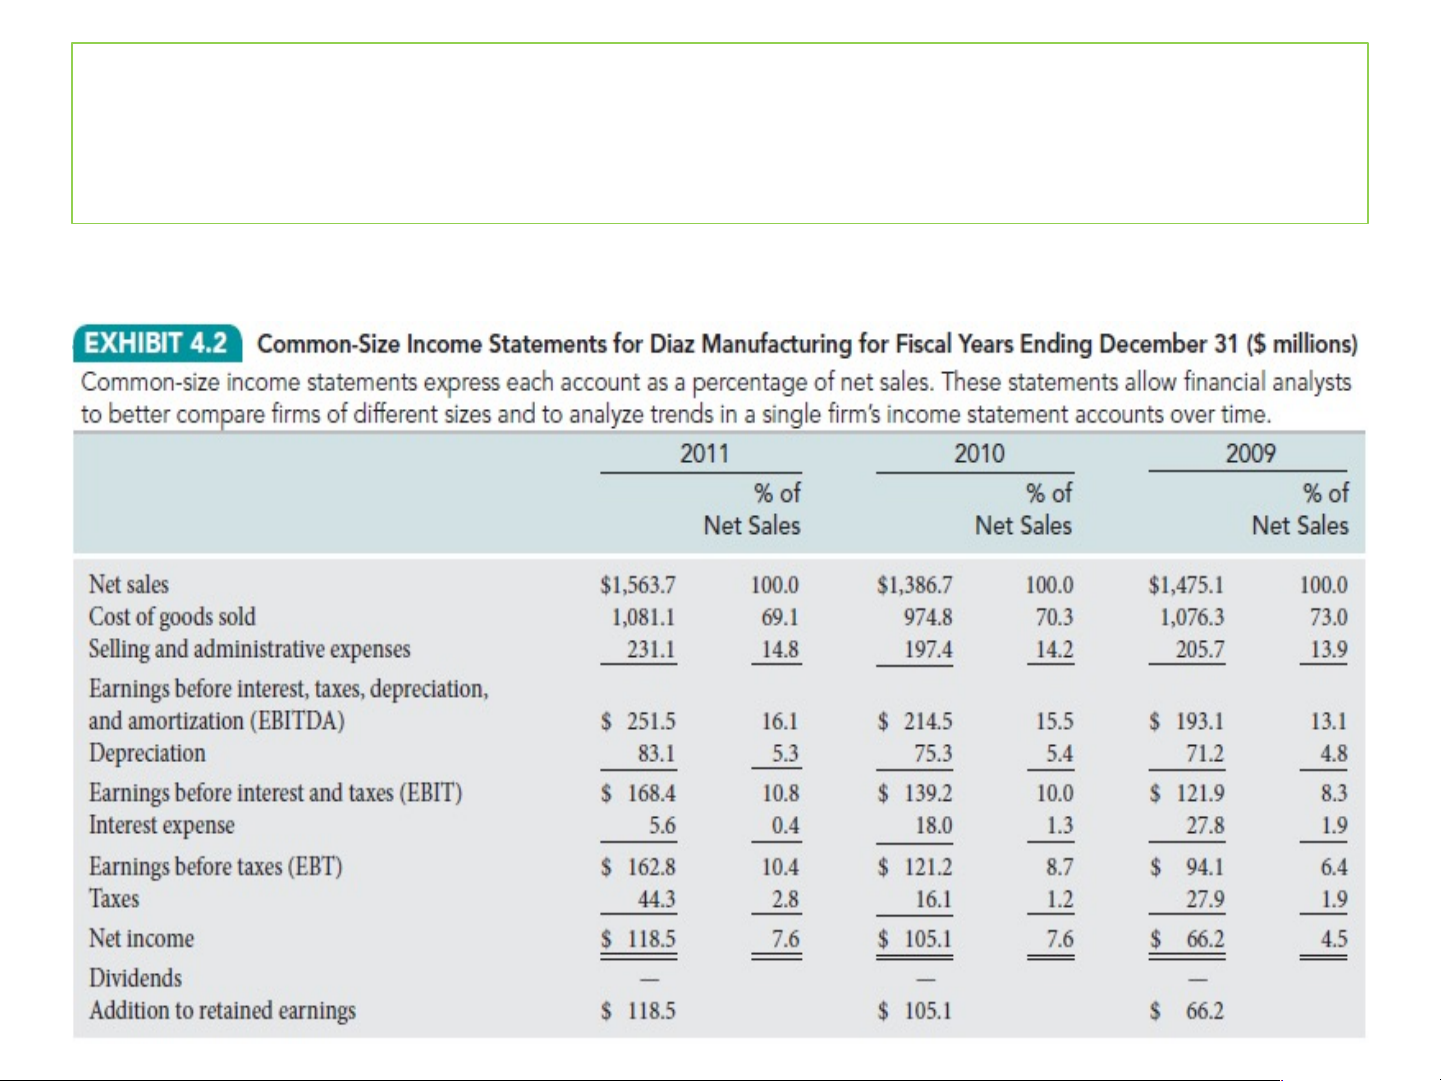
Common-size income statement may use net sales as
the reference value; each item is expressed as a percentage of net sales.
Common-Size Financial Statements o COMMON-SIZE BALANCE SHEET
• Standardizes the amount in a balance sheet
account by converting the dollar value of each
item to its percentage of total assets
Dol ar values on a regular balance sheet provide
information on the number of dol ars associated with a balance sheet account.
Percentage values on a common-size balance sheet
provide information on the relative size or importance
of the dollars associated with a balance sheet account.
Exhibit 4.1: Common-Size Balance Sheets for Diaz Manufacturing
Exhibit 4.2: Common-Size Income
Statements for Diaz Manufacturing
Financial Ratios and Firm Performance
o RATIOS IN FINANCIAL ANALYSIS.
• Ratios establish a common reference point
across firms - even though the numerical value
of the reference point will differ from firm-to- firm
Ratios make it easier to compare the performance of
large firms to that of smal firms.
Ratios make it easier to compare the current and
historical performance of a single firm as the firm changes over time.
Financial Ratios and Firm Performance
o RATIOS USED VARY ACROSS FIRMS
• occupancy ratios (hotel)
• sales-per-square foot (retailing)
• loans-to-assets (banking)
• medical cost ratio (health insurance)
Financial Ratios and Firm Performance
o RATIO VALUES VARY WITHIN AN INDUSTRY • 2010 Gross Margin Big Lots Target Walmart 40.6% 30.5% 24.9%
Financial Ratios and Firm Performance
o CATEGORIES OF COMMON FINANCIAL RATIOS • Liquidity ratios • Efficiency ratios • Leverage ratios
• Profitability ratios
• Market Value ratios
Financial Ratios and Firm Performance
o LIQUIDITY RATIOS (SHORT-TERM SOLVENCY RATIOS)
• Indicate a firm’s ability to pay short-term
obligations with short-term assets without
endangering the firm. In general, higher ratios are a favorable indicator. Current as sets Current Ra tio = (4 .1) Current li abilites Current as sets In - ventory Quick Ra tio = (4 .2 ) Current li abilites
Financial Ratios and Firm Performance o EFFICIENCY RATIOS
• Indicate a firm’s ability to use assets to produce
sales. These are also called asset turnover ratios.
In general, higher numbers are a favorable indicator.
• These ratios also are valuable for a firm’s
investors who use the ratios to find out how
quickly a firm is selling its inventory and
converting receivables into cash flow for investors.
Tài liệu liên quan:
-
Cambridge IELTS 13 Test-1 Overview and Practice Review | Tài liệu Tiếng Anh
6 3 -
IELTS Test 2 Review - Cambridge 13 Preparation Guide | Tài liệu Tiếng Anh
9 5 -
Litfocus Litreading Survey: Student Reading Interests & Habits Questionnaire | Tài liệu Tiếng Anh
9 5 -

Sách Pre-intermediate Market leader - Business English Course Book
25 13 -

Exam booster for B1 preliminary and B1 preliminary for schools with answer key
10 5