Appendix môn Xác suất thống kê| Trường Đại học Ngoại Thương
Access, which consists of three indicators: number of depositaccounts with credit unions and credit cooperatives per 1,000 adults, number of debit cards per 1,000 adults, number of loan accounts with credit unions and credit cooperatives per 1,000 adults. Tài liệu giúp bạn tham khảo, ôn tập và đạt kết quả cao. Mời đọc đón xem!
Môn: Xác suất thống kê (FTU) 355 tài liệu
Trường: Trường Đại học Ngoại Thương 1.1 K tài liệu
Tác giả:


Preview text:
Appendix
I. Definition and construction of main variables ¿ 1. inc F
: Financial inclusion index is the weighted average of three dimensions:
(i) Access, which consists of three indicators: number of deposit accounts with credit unions
and credit cooperatives per 1,000 adults, number of debit cards per 1,000 adults, number of
loan accounts with credit unions and credit cooperatives per 1,000 adults;
(ii) Availability, which consists of three indicators: total number of commercial bank
branches, number of ATMs per 100,000 adults, total number of branches of other deposit takers;
(iii) Usage, which consists of three indicators: outstanding deposits with commercial banks,
outstanding loans with other deposit takers, outstanding deposits with other deposit takers.
The index is determined using a 2-stage Principal Component Analysis as follows:
* The first stage: Estimate the three dimensions: Access, Availability, and Usage (denoted as
Yt ,Yt , Yt ) using the principal components as linear functions of the explanatory variables: p a u Yt (A1.1)
p=α1Deposit accountsi +α2Debit cardi +α3Loanaccountsi +τi Yt (A1.2)
a=θ1Bank branchesi +θ2ATMsi+θ1Otherbranchesi +σi Yt (A1.3)
u=β1Bankdeposit i+β2Otherloansi+β3Otherdepositsi+ui
* The second stage: Applying the same procedure as in the first stage, estimate the weights of
the three dimensions to obtain the overall Fi ninc index: ^Fininc=ω1Yt . (A1.4) p+ω2Yt a+ω3Yt u+εi
For the purpose of taking logarithm for the empirical models, the obtained index is then
transformed so that the minimum value is set to zero. log(Fin 2. inc )
: natural logarithm of the financial inclusion index created above.
3. ROA : Return on Assets is calculated by taking Net income divided to Total assets at the
end of the year. It captures how profitable a firm is in relation to its assets.
4. Formal loans: Formal loans is the amount of loans that a firm borrows for the purpose of
investment and development from banks or other financial institutions (in million 2010
VND). It reflects the formal financial access of firms. 1
5. Corpborrow : Corporate borrowing intensity is computed as the ratio of Formal loans over the
Total assets of a firm at the beginning of the year. It comparably shows how much of formal
loans a firm can access in relation to its assets.
6. Assetturnover : Asset turnover is the ratio of Net sales over Total assets at the end the year,
which captures how effectively a firm uses its assets to generate sales. It helps reflect the sales intensity of the firm.
7. Profitmargin : Profit margin is the ratio of Net income over Net sales at the end the year.
8. Firm¿¿ Firm size is measured by log of the total number of laborers at the end of the year.
9. Firmage : Firm age is measured by natural logarithm of number of years in operation of firms.
10. Firmtype : Firm types of business are constructed as dummy variables in which firms are
classified as either State-owned, Collective, Private, Foreign, Joint stock or Other. The firm
types are grouped based on the surveyed data as follows:
- State-owned type includes state enterprises and those having more than 50% of state capital;
- Collective type includes collective/unions collective and people’s credit fund;
- Private type includes private enterprises;
- Foreign type includes enterprises having 100% foreign capital and join ventures between
foreign enterprises and other enterprises;
- Join stock type includes join stock enterprises having less than or equal to 50% of state capital;
- Other type includes collective and other enterprises having less than or equal to 50% of state capital.
11. Firmregion : Firm regions are dummy variables capturing six socio-economic regions in
Vietnam. The socio-economic regions are grouped by the city/province that the firm is located
as follows (according to the National master plan provided in Resolution 81/2023/QH15):
Red River Delta, North Central region and Central coastal, Central Highlands, Mekong River,
Northern Midlands and Mountains and the Southeast region. 2
II. Financial inclusion index: Detailed description and calculation results
Table A1. Detailed description of financial inclusion components Variable Definition N Mean Std. Dev. Usage u dimension (Yt ) Bank deposit
Outstanding deposits with commercial banks13 0.406 0.311 (% of GDP) Other loans
Outstanding loans with other deposit takers13 0.388 0.279 (% of GDP) Other deposits
Outstanding deposits with other deposit takers 13 0.629 0.345 (% of GDP) Availability a dimension (Yt ) Bank branches Branches of commercial banks 13 0.498 0.357 ATMs Number of ATMs 13 0.549 0.348 Other branches
Branches of other deposit takers 13 0.294 0.318
Access dimension (Ypt)
Deposit accounts Number of deposit accounts with credit unions 13 0.460 0.334
and credit cooperatives per 1,000 adults Debit cards
Number of debit cards per 1,000 adults 13 0.616 0.336 Loan accounts
Number of loan accounts with credit unions13 0.518 0.386
and credit cooperatives per 1,000 adults
Table A2. Components and aggregate index of financial inclusion Year Yp u a ^ t Yt Yt Fininc Fininc log(Fininc ) 2008 -2.385 0.387 -0.134 -1.860 0.010 -4.632 2009 -1.371 1.536 0.178 -0.832 1.038 0.038 2010 -1.448 0.472 0.101 -1.085 0.785 -0.242 2011 -1.266 -0.479 0.223 -1.106 0.764 -0.269 2012 -1.295 -0.152 -0.314 -1.078 0.792 -0.233 2013 -0.727 -1.130 -0.022 -0.790 1.080 0.077 2014 -0.153 -1.187 -0.024 -0.336 1.534 0.428 2015 0.275 -0.494 0.220 0.137 2.007 0.696 2016 1.058 -0.052 0.118 0.847 2.717 1.000 2017 1.106 0.429 -0.438 0.965 2.835 1.042 2018 1.674 -0.008 -0.043 1.351 3.221 1.170
Table A3. Correlation matrix of interested variables
Correlation matrix (3) VIF ROA log(Fininc ) Corpborrow ROA 1.000 log¿ ) -0.007 1.000 1.240 Corpborrow -0.012 0.040 1.000 1.100 Mean VIF 1.750 3
Table A4. Correlation between financial inclusion index and other macroeconomic indicators Variables Fininc Findev Uncertainty Fininc 1 Findev -0.468 1 Uncertainty -0.625 0.335 1
Notes: Fininc , Findev and Uncertainty denote the financial inclusion, financial development and economic
uncertainty index respectively. Data on financial development is sourced from the IMF. Data on economic
uncertainty is obtained from Ahir, Bloom and Furceri (2022)
III. Summary statistics
Table A5 provides summary statistics for key variables used for this study. To take account of
inflation, all nominal variables such as corporate borrowings, total assets, profit, and sales are
deflated by the price index with 2010 being the base year.
Over the 2008-2018 period, the financial inclusion index has increased significantly, which
reflects different improvements in any of the three dimensions of financial products and
services: access, availability, and usage. With a mean value of 1.085, this index ranges from 0.010 to 3.221.
An average ICT firm in Vietnam borrows roughly 1.2 billion Vietnamese dong or US $62,800
per year (using 2010 price index).1 Loan values are rather diverse, from as small as 1.5
million to nearly 21 billion Vietnamese dong per year. Returns on assets,
ROA, are found to be 0.005 (or 0.5 percentage point) on average. However,
some firms have achieved some remarkable returns of 12.838 percentage points, while some
firms experienced losses, showing a great discrepancy in profitability among firms in the
sample. Data on asset turnover shows that all firms have positive ratios, with some firms
having remarkable sales record, about 90 times larger than the average. With a negative
average net profit margin (-0.041), ICT firms in Vietnam, generally, are found to be
unprofitable relative to their revenues.
The average number of workers per firm is slightly less than two. This seems reasonable for
ICT firms because their businesses may depend more on machines, software, and
technologies, etc., rather than on labour, which may in turn indicate the strong capital
intensity of such firms in Vietnam. This also highlights that ICT firms in Vietnam are mostly
small and, hence, may require substantial financial support for development. The sampled
ICT firms have been in operation for nearly 7 years on average.
1 A US dollar is equivalent to 19,096 Vietnamese dong in 2010. 4
Table A5. Statistical summary Variable name Mean Std. Dev. Min Max Fininc 1.085 0.654 0.010 3.221 log(Fininc ) -0.330 1.376 -4.632 1.170 Formal loans 1,272.324 47,086.440 1.510 20,700 Corpborrow 0.098 0.151 0.000 0.999 ROA0.005 0.179 -13.547 12.838 Assetturnover 1.689 3.834 0.000 91.061 Profitmargin -0.041 0.886 -72.000 59.250 Firm¿¿ 1.918 1.028 0.000 10.798 Firmage 1.928 0.676 0.000 4.263
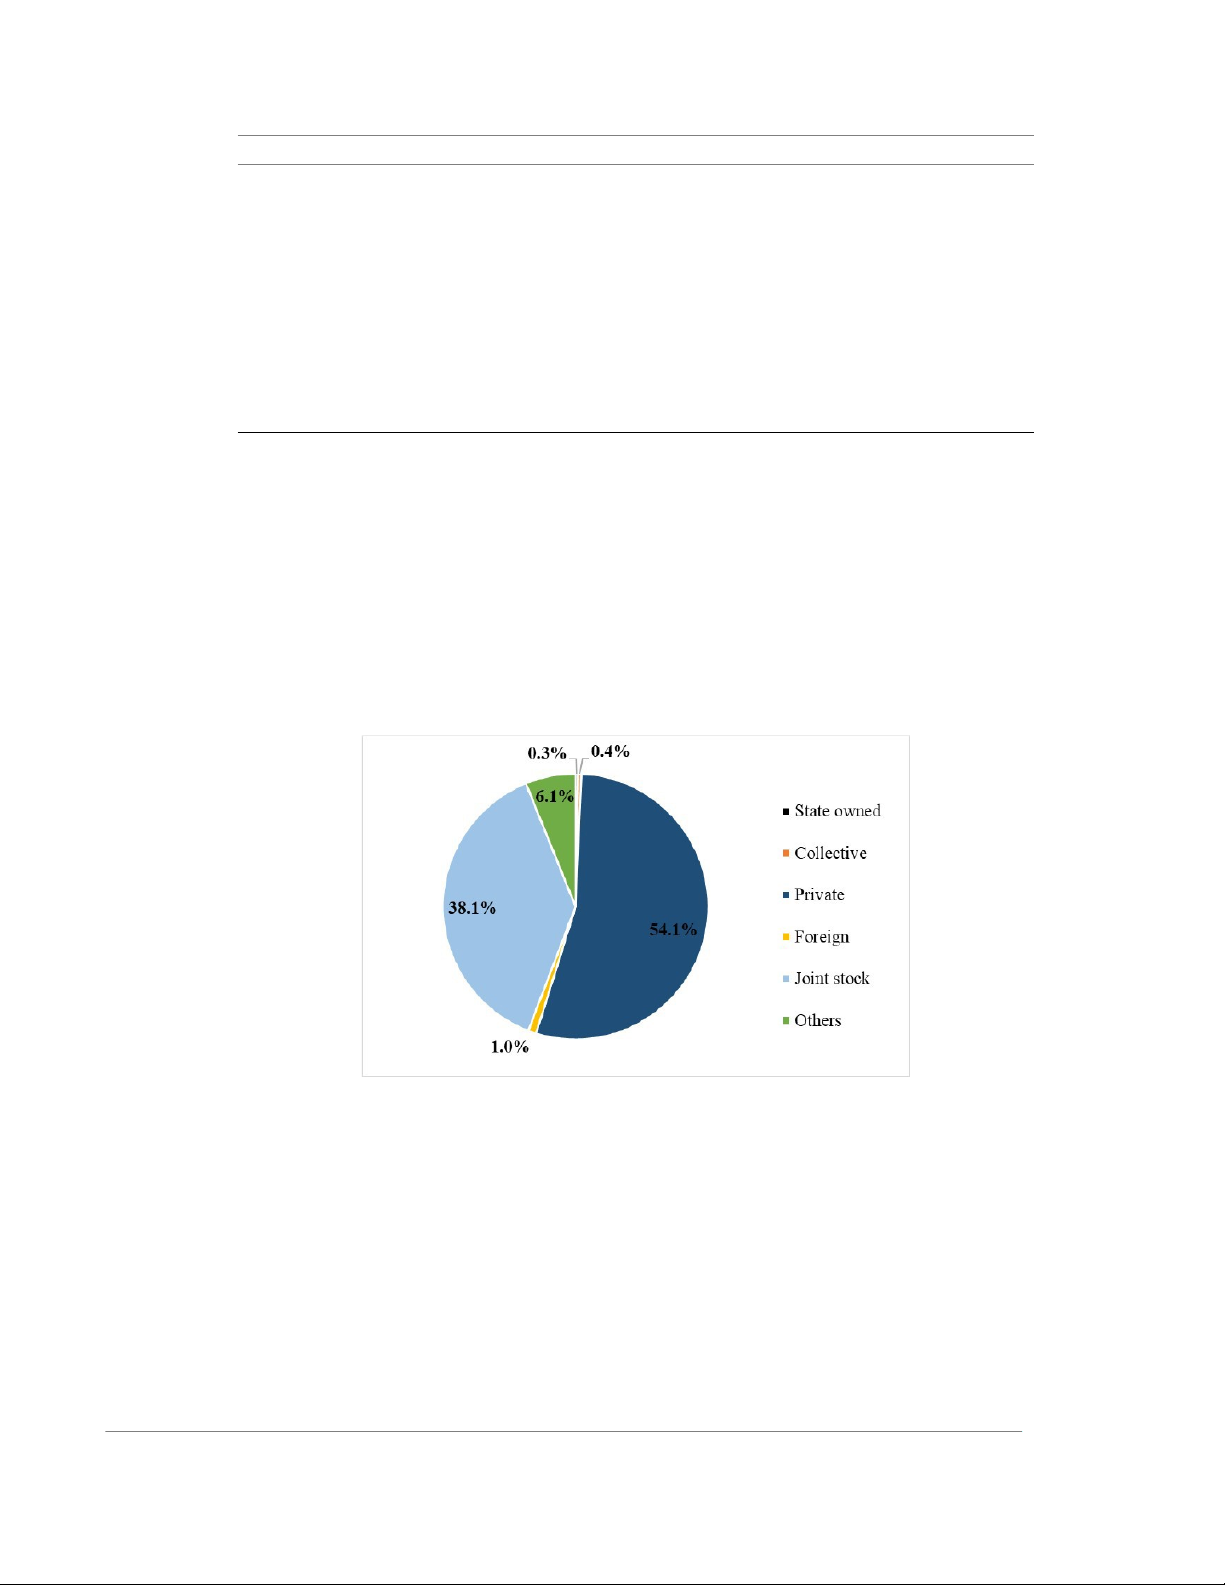
ICT firms in our sample can be classified into different groups based on their types, namely
Stated-owned, Collective, Private, Foreign, Joint stock, and other types. The corresponding
distribution of firms is illustrated in Figure A1. On average, private firms account for the
largest proportion (54.1%) while the State-owned enterprises take up the smallest part (0.3%).
Although there is a large number of joint stock firms (38.1%), foreign firms make up about 1%.
Figure A1: Distribution of firms by firm type
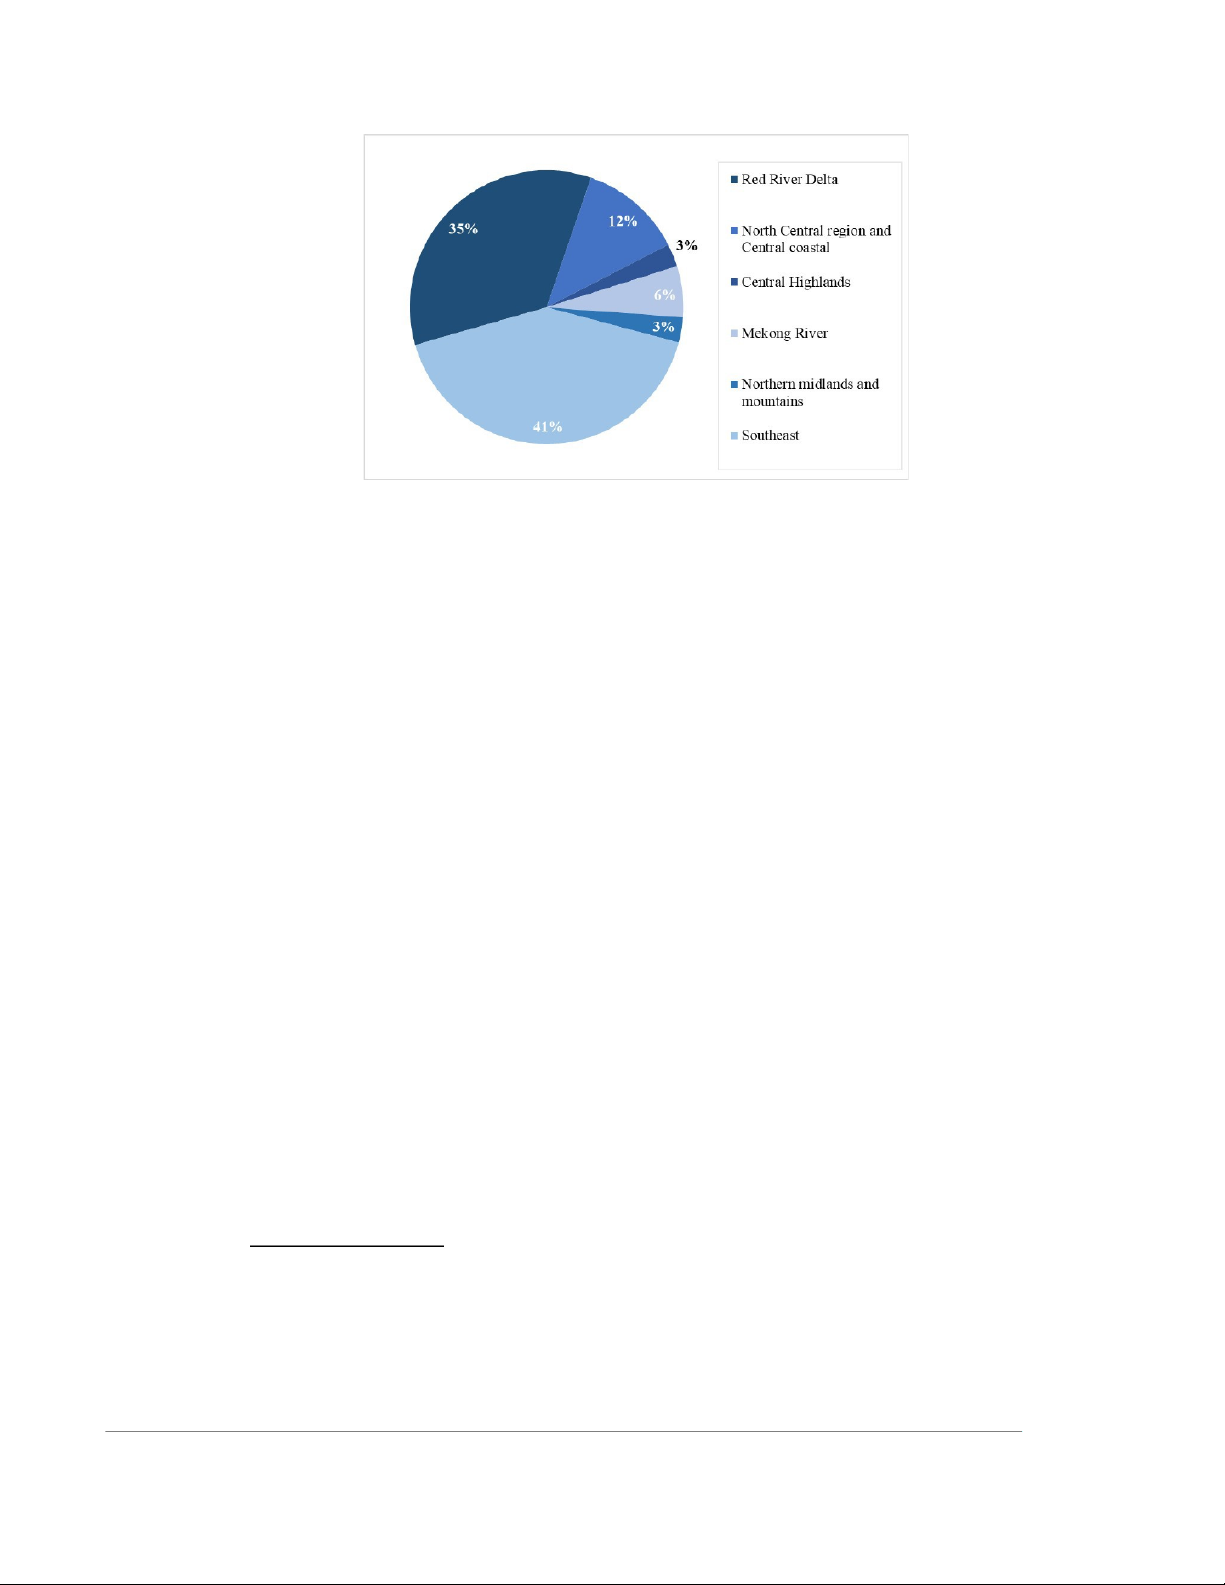
Figure A2 below reports the average number of ICT firms by their locations. Noticeably,
nearly half of the ICT firms are located in the Southeast region. The number of ICT firms in
Red River Delta also accounts for a large proportion of 35%, following up by the North
Central region and Central coastal region with 12% of firms located there. These regions are
home of many economic zones, big cities as well as those serving as ICT industry hubs such
as Thai Nguyen, Bac Ninh, Ho Chi Minh, Hanoi and Bac Giang. 5
Figure A2: Distribution of firms by region
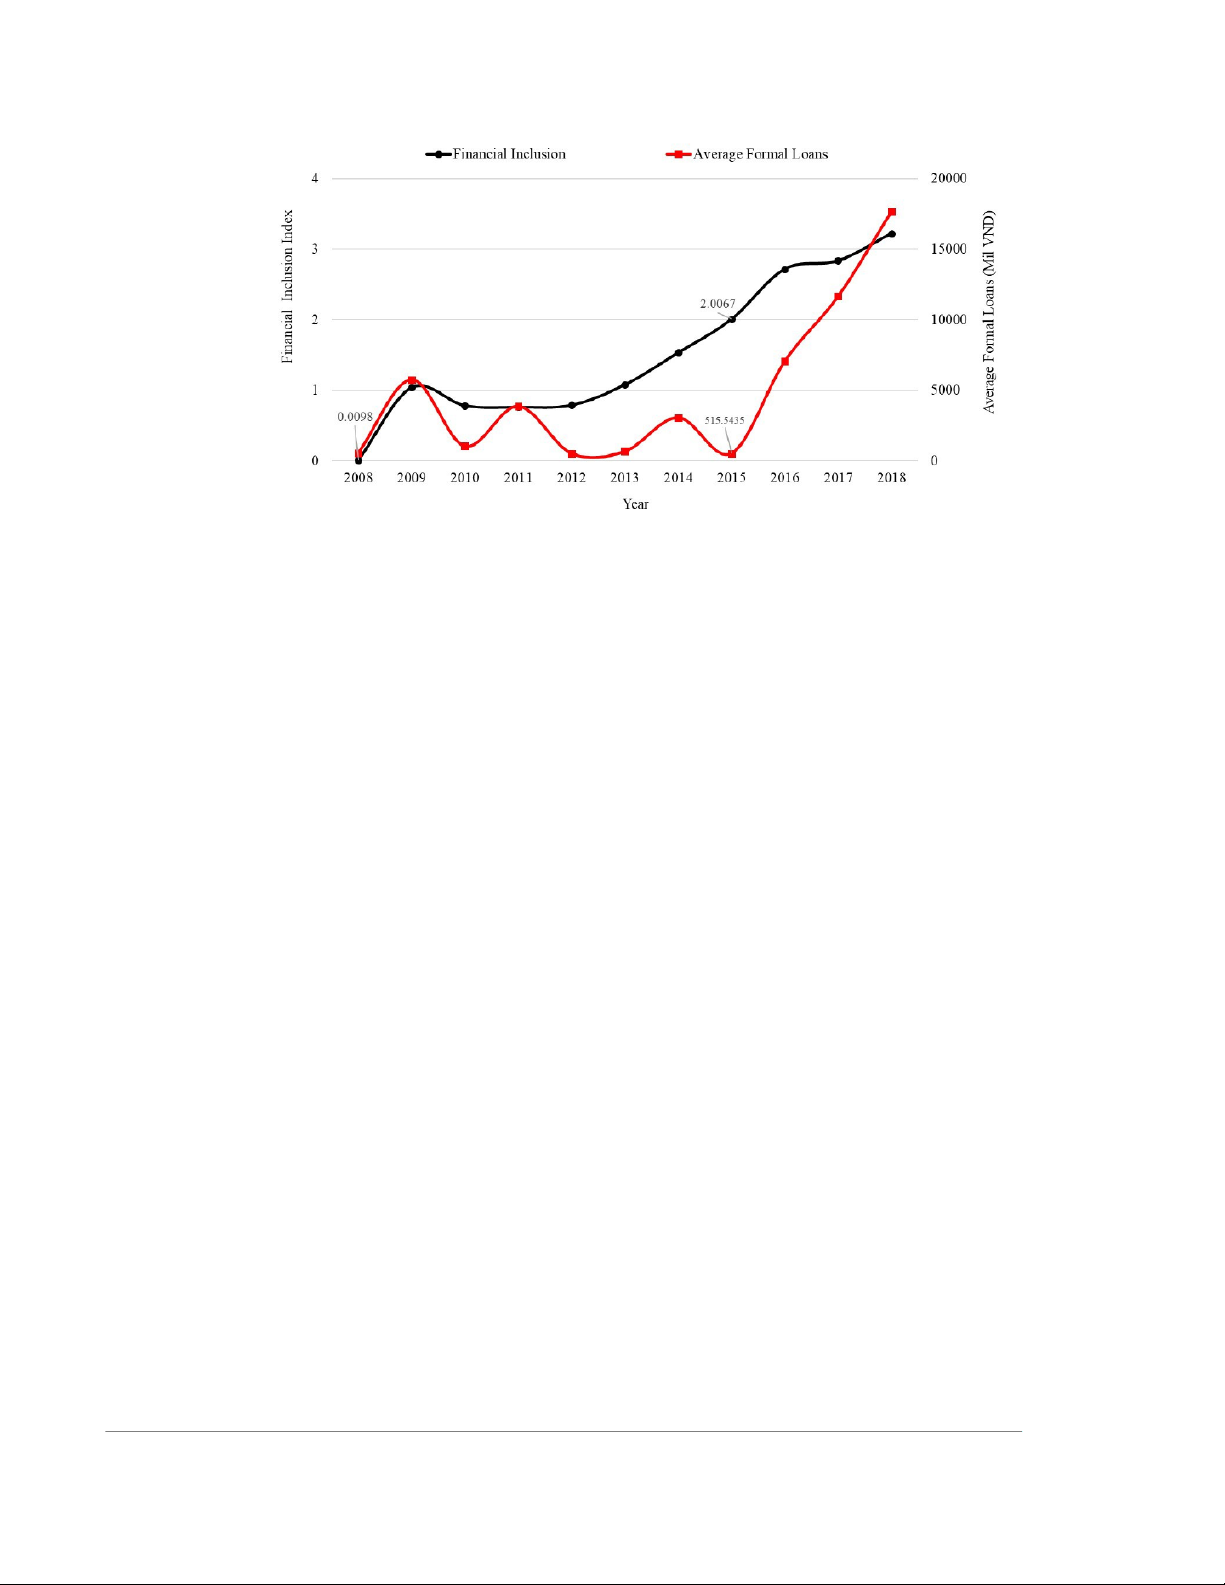
Figure A3 shows the variation of the generated financial inclusion over the 2008-2018 period.
Starting from a level as low as 0.522 in 2008, the index experienced an upward trend overall
despite a slight decrease in 2009-2010. This possibly reflects the negative impact of the
Global Financial Crisis of 2008-2009. To achieve economic development, poverty reduction
and income equality, the government has attempted to take care of the unbanked or financially
excluded population by making important improvement in different aspects such as
availability of usage of and access to financial products and services. The access to finance
dimension is calculated to be the largest proportion in the index (Table A2), implying its
largest contribution to the financial inclusion index as a whole. It also may explain the fact
that bankcards and financial accounts are likely to become a necessary part of individuals’
and firms’ transaction and capital management. The increase in individual deposit accounts,
the emerging bank branches, ATMs and the greater outstanding loans and deposits can further
contribute to the active financial market and assist firms that are in need of capital for their survival and development.
Figure A3 also depicts the time trend of formal loans of firms. Before 2015, the average loan
value (in terms of 2010 million Vietnamese dong) for ICT firms fluctuates considerably. After
that, this variable exhibits a consistent upward trend. This implies that firms probably enjoy
some greater access to financial services and products since 2015. Notably, financial inclusion
strategy has received a big push from State Bank of Vietnam since 2016. It is interesting to
see a co-movement between formal loans and financial inclusion during this period as it
signals some form of correlation between these two variables .2
2 The correlation coefficient between corporate borrowing intensity and national financial inclusion is 0.040
(Table A3). This value indicates a positive relationship between financial inclusion and corporate borrowings of firms. 6
Figure A3: Trend of Financial Inclusion and Formal Loans in Vietnam (2008-2018) 7
Tài liệu liên quan:
-

Bảng giá trị phân phối thống kê poisson và student môn Xác suất thống kê| Trường Đại học Ngoại Thương
27 14 -

Bảng giá trị quyết định thống kê wilcoxon rank-sum test môn Xác suất thống kê| Trường Đại học Ngoại Thương
29 15 -

Bài 1 Định nghĩa cổ điển về xác suất môn Xác suất thống kê| Trường Đại học Ngoại Thương
26 13 -

Exercises for probability & statistics môn Xác suất thống kê| Trường Đại học Ngoại Thương
26 13 -

Đề thi cuối kỳ lý thuyết môn Xác suất thống kê| Trường Đại học Ngoại Thương
27 14