Bài báo học thuật chuyên ngành Nghiên cứu Khoa học | Trường Đại học Khoa học tự nhiên, Đại học Quốc gia Thành phố Hồ Chí Minh
Bài báo học thuật chuyên ngành Nghiên cứu Khoa học | Trường Đại học Khoa học tự nhiên, Đại học Quốc gia Thành phố Hồ Chí Minh. Tài liệu được sưu tầm giúp bạn tham khảo, ôn tập và đạt kết quả cao. Mời bạn đọc đón xem.
Môn: Nghiên cứu Khoa học (HCMUS) 11 tài liệu
Trường: Trường Đại học Khoa học tự nhiên, Đại học Quốc gia Thành phố Hồ Chí Minh 1.1 K tài liệu
Tác giả:


Preview text:
JHSS (Journal of Humanities and Social Studies)
Volume 07, Number 01, March 2023, Page 097-101
https://journal.unpak.ac.id/index.php/jhss
e-ISSN: 2598-120X; p-ISSN: 2598-117X
REDUCING MANUFACTURING LEAD TIME WITH LEAN MANUFACTURING
APPROACH CASE STUDY: CV SUHO GARMINDO
Yusup Mauluddin a*), Sopia Marwah a)
a)Technology institute of Garut, Garut, Indonesia
*)Corresponding Author: 1yusuf.mauluddin@sttgarut.ac.id
Article history: received 27 January 2023; revised 16 February 2023; accepted 04 March 2023
DOI:https://doi.org/10.33751/jhss.v7i1.7458
Abstract. The purpose of this study is to reduce the Lead Time Manufacturing of mask products at CV Suho Garmindo. At this time
it is known that Lead Time Manufacturing is influenced by Non-Value-Added activities and Necessary Non-Value Added activities in
which there are several wastes that occur, these activities include the temporary storage process in the loading section, the process of
reworking defective products and the transportation process. The method used is Lean Manufacturing, the tools used are Value Stream
Mapping (VSM) and Process Cycle Activity (PAM). Value Stream Mapping is used to identify activities that have a cycle time greater
than the takt time, followed by Process Cycle Activity mapping to analyze activities that are Non-Value Added activities. Furthermore,
NVA activities are analyzed with 5W1H, and 5 why's tool to find out the root of the problem. Based on the research results from 126.1
minutes of lead time process 110 minutes is a non-value added activity. The rework process is identified as having the largest value of
contributing lead time, so rework must be eliminated. After it is known that the root cause of the rework process is due to t he
ineffectiveness of the sewing process (bottleneck occurs), then for improvement the author proposes the needs of the available machines
and man power. The changes are the number of machines from 9 to 10, sonday operators from 2 people to 1 person, finished stick
operators from 2 people to 1 person, and funnel operators from 2 people to 4 people. Furthermore, the optimal layout improvement
based on production flow is described. Due to research limitations, this research did not reach the implementation stage. So with the
change in the number of machine requirements and available man power, it is expected that the rework process will be reduced so that
the Manufacturing Lead Time can be reduced.
Keywords: lead time manufacture; lean manufacturing; value stream mapping; process activity mapping I. INTRODUCTION
Research on improving Manufacturing Lead Time has
been done before by researchers. The movement study
Production activities are the heart of a manufacturer,
approach is one of the alternative problems solving [5], There
so productivity is a measure of the company's success in
are also those who use line balancing to streamline the
carrying out its production activities. [1]. Good productivity
trajectory so that the lead time becomes faster [6], [7]. The
results from good production planning as well, by utilizing
most used approach is lean manufacturing, by reducing non-
resources efficiently and controlling production planning that
value-added activities, namely Value Stream Mapping (VSM)
can be adjusted in production activities [2]. The corona virus
and Lean Manufacturing Metrix and value stream mapping
pandemic has hit almost the entire world, including Indonesia,
analysis tools (Process Activity Mapping), activity process
which has hampered all economic activities and decreased
mapping with 5W1H, and the 5 why's tool. [8],[9],[10] [11].
income. [3][4]. The Rabbani company is also affected by this
Based on several previous studies, the suitable method
pandemic problem, as a result the demand for Rabbani
for this research is Lean Manufacturing. Lean manufacturing
products has decreased. However, after this, masks are
tools that will be used are Value Stream Mapping and Lean
mandatory items that everyone must have and wear, seeing
Manufacturing Metrix. VSM will be used as the first picture
this condition Rabbani gets the opportunity to produce new
of the factory to identify waste on the production floor. PAM
products, namely masks. Due to the large number of
will be used to identify activities based on the type of Value
consumer interest in this mask product, an explosion of
Added and Non-Value-Added activities [12][13]. Metrix
demand occurred so that the production target was not
Lean Manufacturing will be used to calculate Manufacturing
achieved due to late delivery of goods. Based on the results of
Lead Time (MLT) and determine the value of Process Cycle
field studies by conducting observations and interviews with Efficiency [14].
the company, it is known that there are obstacles in the
production process, namely when sewing one of the mask
components. This must first be proven in research. Therefore, II. RESEARCH METHODS
a method is needed to improve Manufacturing Lead Time so
that it can increase production capacity and achieve
The research begins with a field study to find out the production targets.
problems that occur in the field in the mask production
process. Next is a literature study, namely reviewing research - 97 -
JHSS (Journal of Humanities and Social Studies)
Volume 07, Number 01, March 2023, Page 097-101
https://journal.unpak.ac.id/index.php/jhss
e-ISSN: 2598-120X; p-ISSN: 2598-117X
journals that discuss almost the same problem as a reference.
Table 1. Cycle time and takt time comparison
Data collection in the form of time data for making masks per
bundle by direct measurement using the stopwatch method Activities Cycle Time Takt Time
with several observations to calculate production cycle time.
Delivery of Materials from temporary 60 67.2
Data processing begins with mapping the initial conditions warehouse to cutting
with VSM, followed by mapping the production process Cutting 67.2 67.2
activities with PAM and determining the classification of
Transportation from cutting to bundling 15 67.2
value added, non-value added and necessary non-value-added Bundeling 16.2 67.2
activities [15] which are then analyzed with 5W1H and 5
Transportation from bundeling to Why's. 372 67.2 loading Loading 3000 67.2 Sewing 2676 67.2
III. RESULTS AND DISCUSSION Rework 3600 67.2
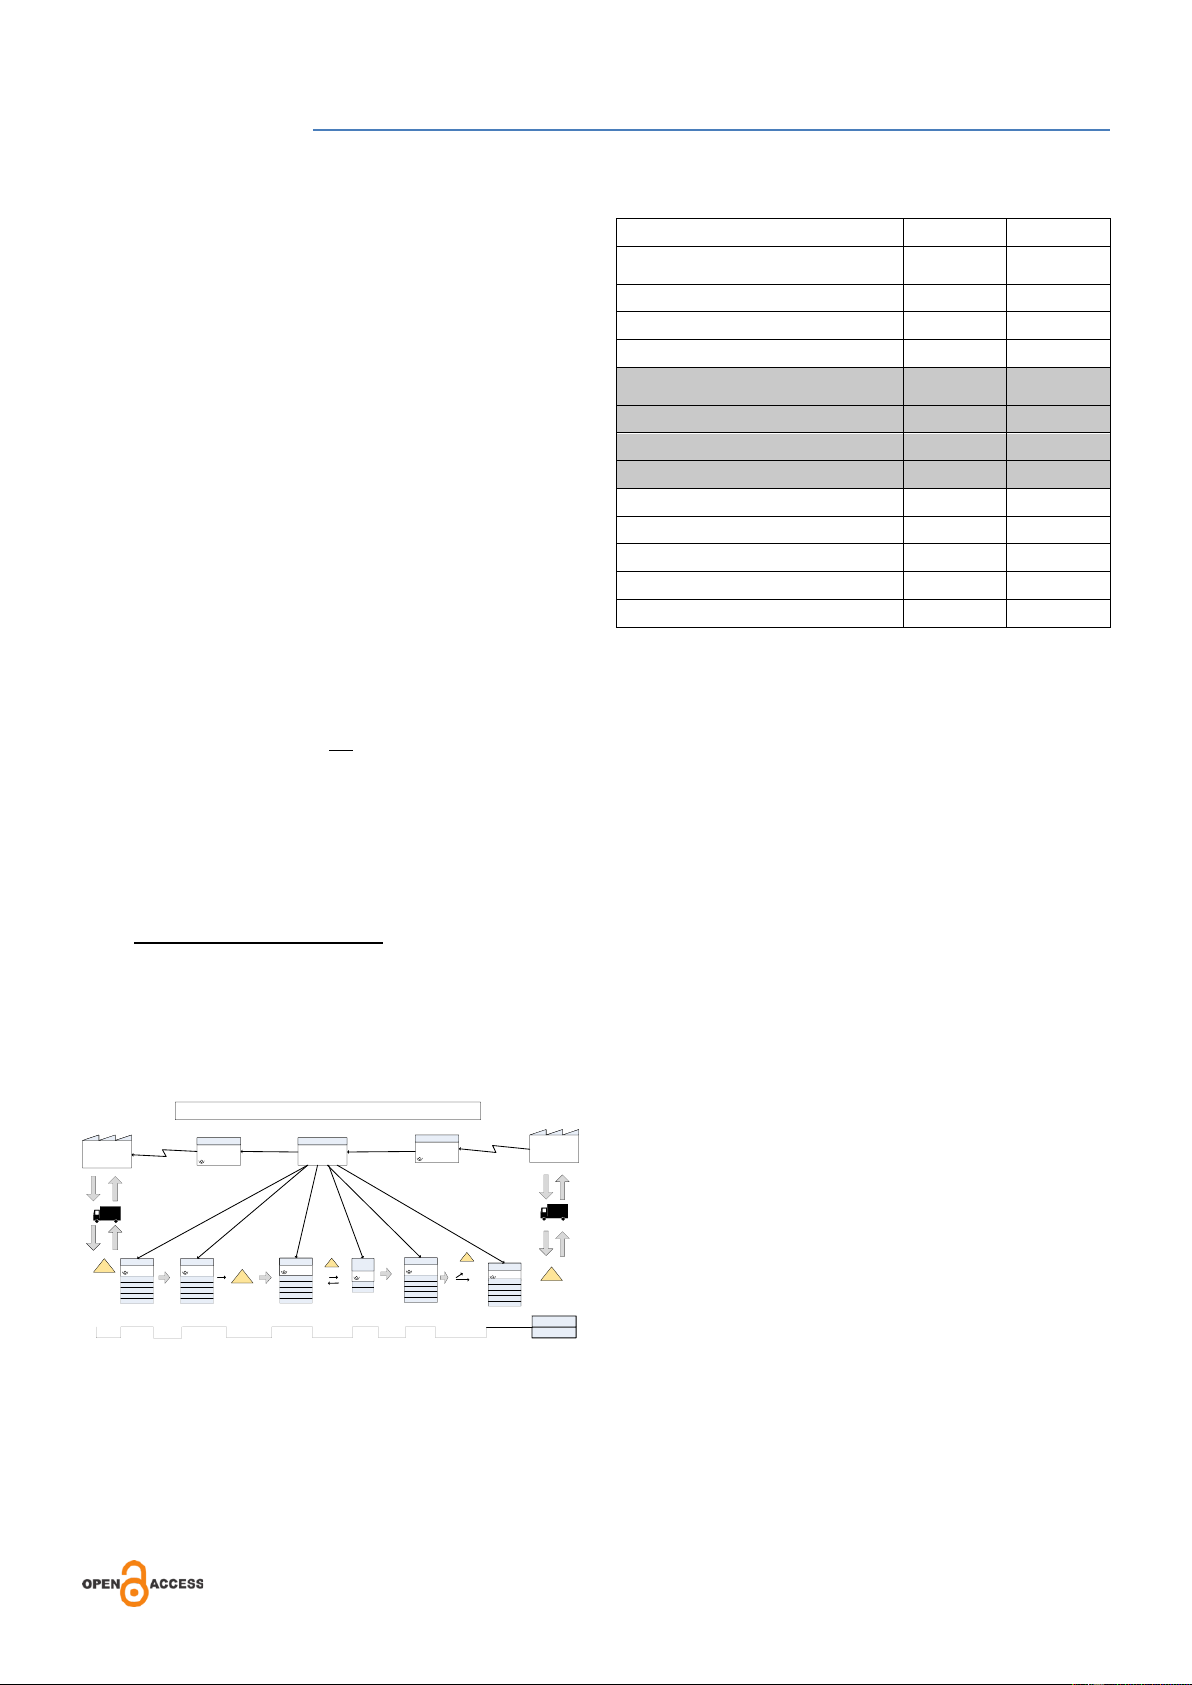
Value Stream Mapping Qc Output 67.2 67.2
Value Stream Mapping (VSM) is a tool that can
transportation from QC to Finishing 9 67.2
visually map the flow of production from upstream to Finishing 66 67.2
downstream, whether value-added or not. The identification
Transportation from finishing to packing 42 67.2
of the production process cycle time with VSM will be Packing 49.8 67.2
compared with the production takt time.
1. Takt Time Calculation
Takt Time is the trajectory speed that must be achieved
Table 1 shows that there are 4 processes that have a
to meet customer demand. The Takt time formula is:
longer cycle time than the takt time, including: transportation
from bundeling to loading, loading, sewing and rework 𝑇𝑎
processes. The existence of processes that exceed far from the 𝑇 = 𝐷
takt time value causes the length of the production process
(source: Vorne Industries, 2009)
time, so it can be said that the current production process is With: T = takt time
not good and needs improvement to eliminate time waste by
Ta = time available (net available working time)
reducing and or eliminating activities that have a cycle time D = demand
value greater than takt time because if left unchecked it will become waste.
Then the desired takt time value:
Lean Manufacture Metrics
7 𝑗𝑎𝑚 𝑥 60 𝑚𝑒𝑛𝑖𝑡 𝑥 60 𝑑𝑒𝑡𝑖𝑘 𝑇 =
= 67.2 𝑑𝑒𝑡𝑖𝑘/𝑘𝑜𝑑𝑖
Lean metrics measurement is used to see the initial 375 𝑘𝑜𝑑𝑖
condition of the company in the production process of certain
products. Since the basis of lean manufacturing has been
Value Stream Mapping
applied in CV Suho Garmindo, the metrics measurement will
The first identification result using VSM as shown in
provide an overview for the improvement process in the
Figure 1 shows that there are several activities that have cycle
company. The production process that has a cycle time value
times exceeding the takt time.
greater than the takt time is the cause of the long lead time,
therefore the process must be improved. In measuring Lean CV. SUHO GARMINDO
metrics, to see whether the activity is value-added or not for MERCHANDISER PURCHASING PRODUKSI KONSUMEN
the production process, the Process Activity Mapping (PAM) SUPPLIER
tool is used which will then calculate the production Process Cylce Efficiency. 1.
Identify value added time, non-value added with CUTTING BUNDELING SEWING QC FINISHING
Process Activity Mapping (PAM) tool. Penyimpanan B Grade OUTPUT PACKING GUDANG CT : 1.12 MIN CT : 0.27 MIN CT : 4.46 MIN CT : 1.03 MIN CT : 0.52 MIN 6,2 min A/T : 420 A/T : 420 A/T : 420 Inspeksi 100% GUDANG PRODUK JADI A/T : 420 Loading 5 min
PAM (Process Activity Mapping) is a lean tool used A/T : 420 Uptime : 99 % Uptime : 99 % Uptime : 99 % Uptime : 100 % Q : 149954 Uptime : 100 % C/O : 5 C/O : 3 C/O : 5 C/O : 0 C/O : 0 Q : 149954 Q 149954 Q : 149954 Q : 149550 Q : 149550
for further identification based on the results of the VSM that 1.12 min 0.27 min 44,6 min 1,12 min 1,10 min 0,83 min Cycletime = 49,04 min 5 min 0,25 min 50 min 60 min 0,15 min 0,7 min LTP = 126,1 min
has been made. The purpose of PAM is to identify the lead
time of the production flow. In addition, PAM also categorizes
Figure 1. Curent Value Stream Mapping
activities that include value-added activities (VA), non-value-
added activities (NVA) and activities that are not value-added
A comparison between cycle time and takt time can be seen
but still needed (NNVA). The recapitulation of data in table 1.
processing results with PAM is; - 98 -
JHSS (Journal of Humanities and Social Studies)
Volume 07, Number 01, March 2023, Page 097-101
https://journal.unpak.ac.id/index.php/jhss
e-ISSN: 2598-120X; p-ISSN: 2598-117X
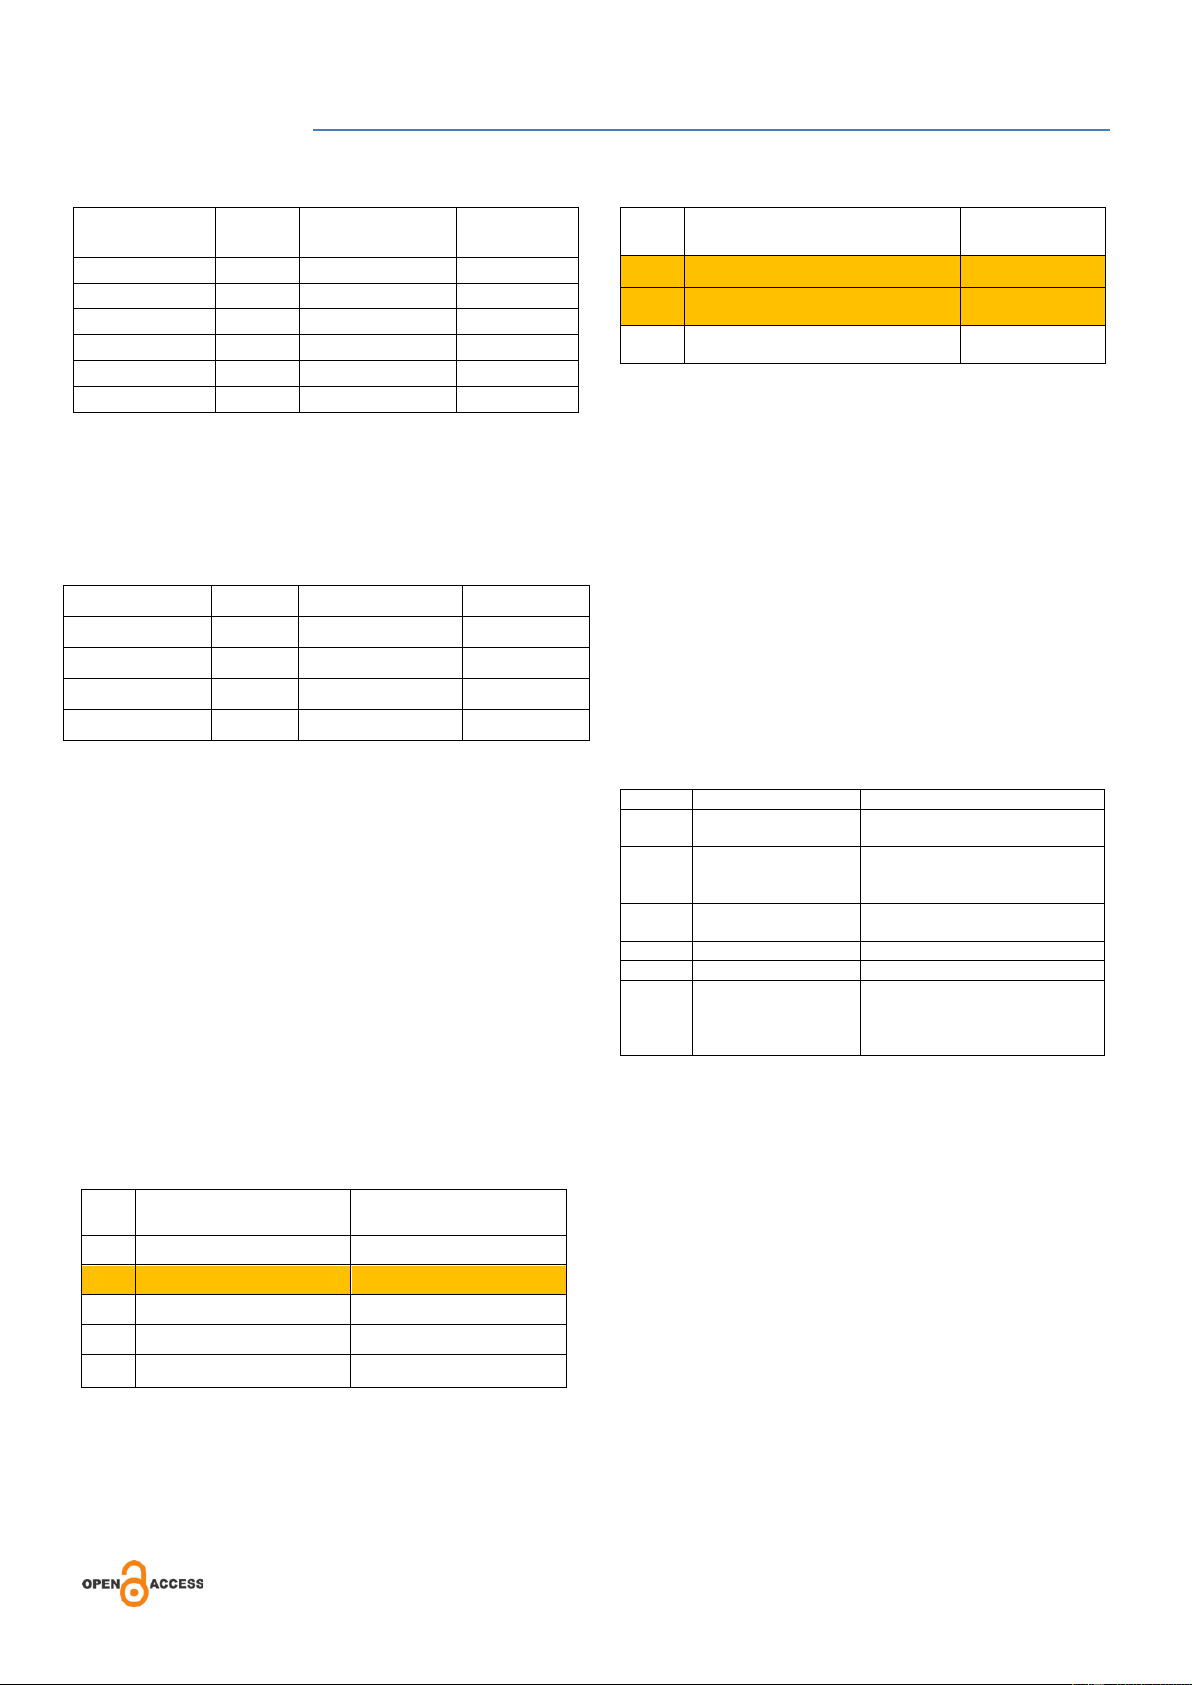
Table 2. Recapitulation of PAM Results
Table 5. Non-Value Added Activities Category Total Time (Minutes) Percentage No.
Non-Value Added Activities Time (minutes) Operation 6 107.67 52.21% 1
Cutting materials are stored in loading 50 Transportation 6 26.8 12.99%
Defective products are repaired 2 60 Inspection 3 1.42 0.69% (rework)
Defective products are separated (B Delay 2 70.35 34.11% 3 0,35 grade) Storage 4 0.35 0.17% Total 21 206.24 100%
Based on VSM, from 126.1 minutes lead time process
110 minutes are non-value added activities. So to improve
After grouping all activities on the production floor as
Process Cycle Efficiency and reduce Manufacturing Lead
in Table 2, further grouping of activities based on the type of
Time, it must be reduced to eliminate NVA activities. Based
value-added activities (VA), non-value-added (NVA) and
on table 5.4, the NVA activity that can be reduced to eliminate
non-value-added but still needed (NNVA).
is the rework process. This is because rework is an NVA
activity categorized as non-value-added operations and has
Table 3. Percentage of Each Activity the largest cycle time. Activities Total Time Percentage 3.
NVA Activity Analysis with 5W1H VA 5 47.67 23.11%
Analysis of NVA activities with 5W1H aims to find
out more about the root causes of NVA activities. Based on NVA 3 120.35 58.35%
table 5.3, NVA activities that have a cycle time greater than NNVA 13 38.22 18.53%
takt time consist of: loading process and rework process. Then Total 21 206.24 100%
the two activities will be analyzed as follows:
Activities that have no added value or non-value added
Table 6. Analysis of NVA activities with 5W1H
have the largest percentage of 58% Non-value added activities Factor
Loading Process
Rework Process
are activities that do not provide added value to the product, What Loading process
The existence of the rework
therefore if there are many NVA activities, it will become process Why For the production
So that defective goods can be excess waste motion. planning of the factory repaired head 2. VA and NVA analysis Where Loading section or
Sewing section, especially mask
Activities that have a cycle time value greater than the temporary storage mouthpiece making When As soon as possible Every day
takt time based on table 1 will be separated according to the Who Factory head Operator
Value Added (VA) and Non-Value Added (NVA) categories. How Increase storage
Maximize sewing performance by
The following is the explanation: capacity, increase
optimizing the use of machines
a. Value Added Activity workers. and time (adding machines or
Value Added is obtained from the production operation increasing processing time)
process in VSM. However, not all operations can be
categorized as value added, for example the rework process.
Based on table 6. the rework process must be improved
Then the rework activities based on PAM data processing are:
first, because leads occur every day, besides the rework
process has the longest cycle time value which can affect the
Table 4. Value Added Activities
production process activities every day. If the rework process
is still provided, the activity will become waste with activities
that have excessive motion. The loading process is also No. Value Added Activity Time (minutes)
important to improve, but because it is related to the planning 1 Cutting 1,12
of the factory head and the PPIC production department, 2 Sewing Process 44,6
further research must be done. 3 Barcode Process 0,4 4.
Rework Analysis with 5Why's 4 Labeling process 0,45
Improve that will be done is to make improvements by 5 Packing process 0,83
analyzing the rework process with 5Why's. The 5Why's tool
is used to find out more about the root causes of the rework
process. So that the rework process can be eliminated. b. Non-Value Added
The average NVA activity is a production process lead
time activity. But there is no denying the existence of
operating activities that are also NVA activities. - 99 -
JHSS (Journal of Humanities and Social Studies)
Volume 07, Number 01, March 2023, Page 097-101
https://journal.unpak.ac.id/index.php/jhss
e-ISSN: 2598-120X; p-ISSN: 2598-117X
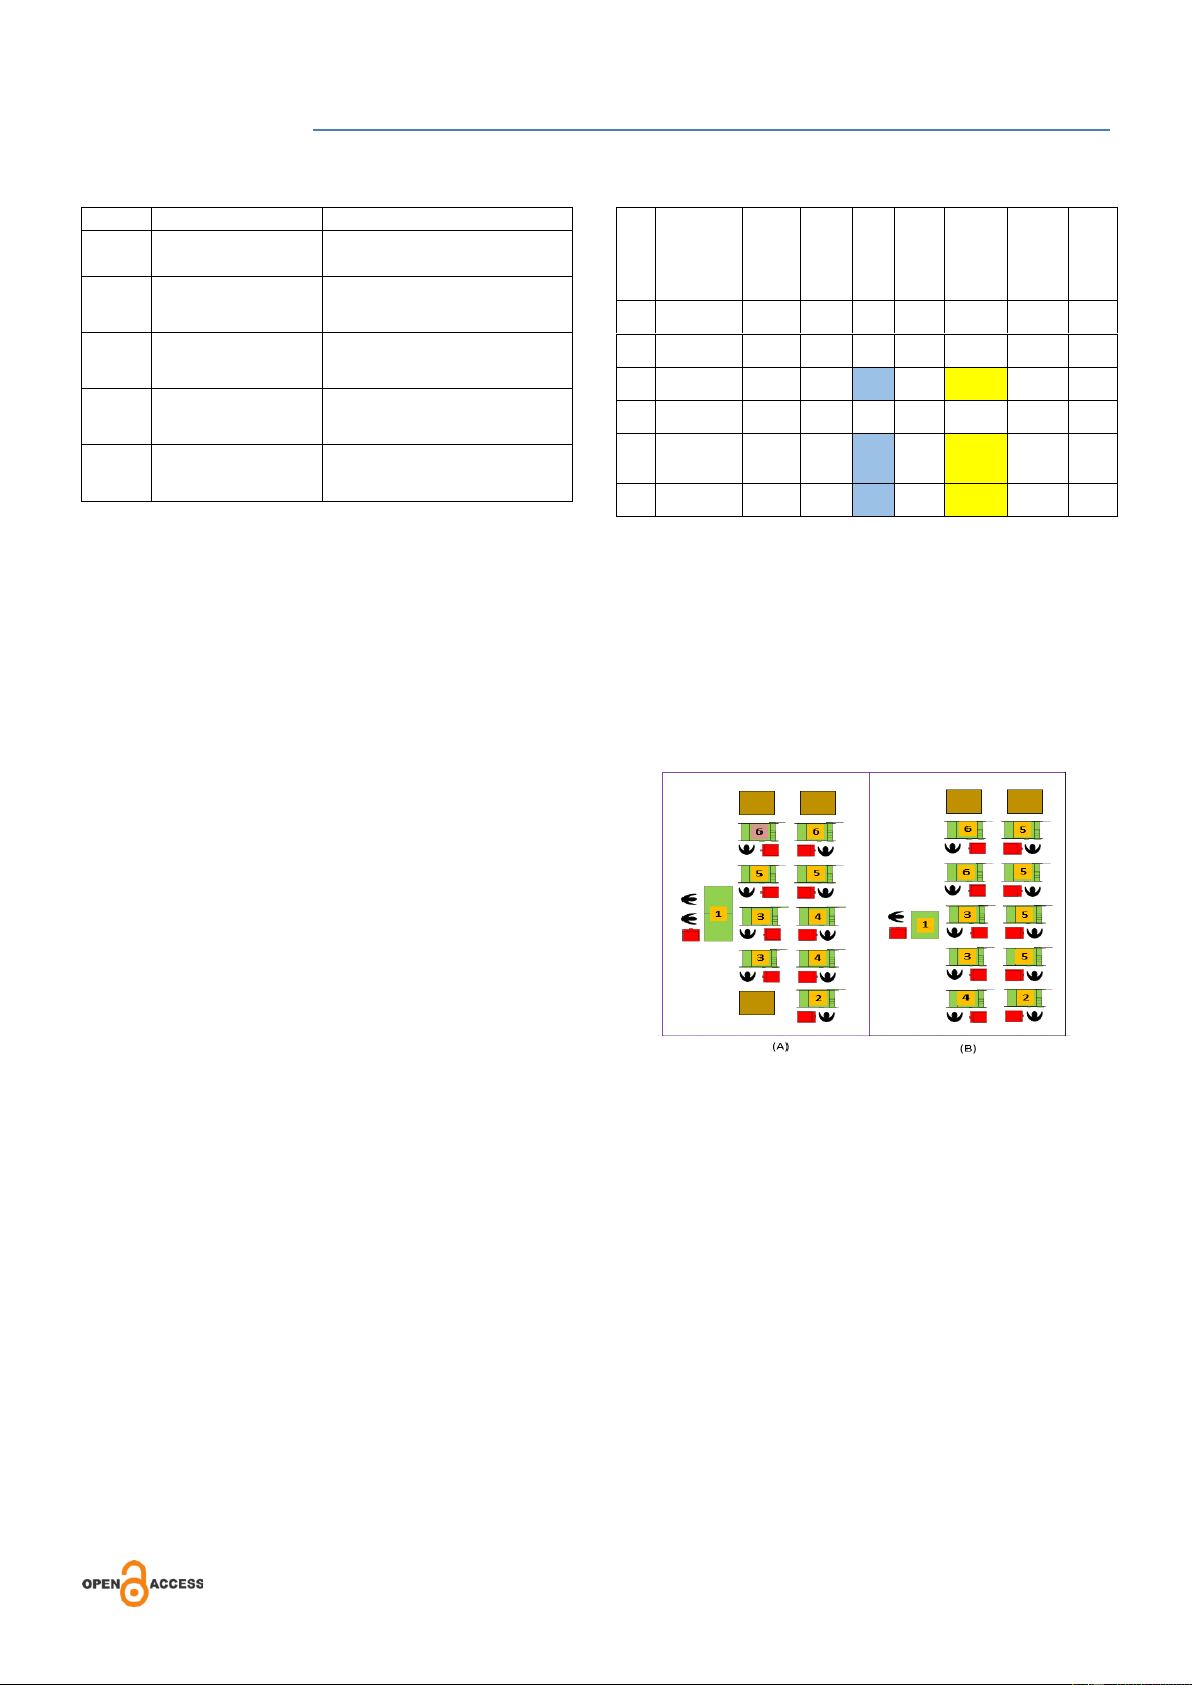
Table 7. Rework Analysis with 5Why's
Table 8. Number of machines that must be in place Factor Question Answer Actu Avail Produc Numbe Produ Cyc al Why Why there should be a
So that stitching defects can be able tion r of No Production ction le Takt Mac rework process repaired Time Capacit Machi . Activities Target Ti Time hine (Seco y Per nes to (Pcs) me Qua Why Why are there
Because the operator (sewing; nds) Day Have ntity defective goods
funnel section) is working in a 2520 16. 1525.7 0.4915 hurry 1 Sonday 750 33.6 1 0 52 315 67 Why Why operators work in
So that the next operator (the Rope 2520 13. 1879.6 0.3990 2 750 33.6 1 a hurry
finished stick section) does not Splicing 0 41 61 08 wait 2520 36. 699.41 1.0723 3 Basic Join 750 33.6 2 Why Why does the operator Due to the long funnel 0 03 715 21 Finished 2520 22. 1143.2 0.6560 (finished stick section) manufacturing process 4 750 33.6 1 Sticks 0 04 027 52 wait 12 Why Why the long funnel
Due to the long cycle time, the man Funnel 2520 203.34 3.6883 5 750 3.9 33.6 4 manufacturing process
power of the funnel and the Making 0 333 43 3 machine is lacking. Bejo Rope 2520 56. 449.75 1.6675 6 750 33.6 2 Cap 0 03 905 60
Based on the results of the waste analysis, it is known
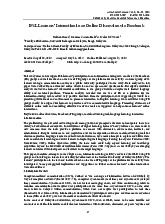
that the rework process occurs due to lack of man power in 6. Proposed Improve
the sewing production line, therefore defective goods often
The proposal for improvement to remove rework is
occur because workers are in a hurry to meet the target.
with Layout improvement in the sewing section. Changes in
Improvements that can be made so that defective goods do not
the layout of the sewing process are based on the number of
exist and the rework process is eliminated are adding man
machines and man power that must exist from table 5.7, so
power or machines. Rework is a non-value added activity.
there will be changes in operator jobs and additional
Therefore, rework should be eliminated in production
machines that will occur from the previous layout (A). Based
activities. The elimination of rework can be done with several
on the observation of field conditions, the proposed
improvements. One of them is by maximizing performance by
improvement layout is with O-shaped flow (B).
optimizing the use of machines and available time which can
be seen from idle work time and the number of employees available. 5.
Improve Proposal Analysis
As known from the results of processing, discussion
and analysis, the cause of the largest lead time is non-value
added activities. From the analysis using 5W1H, it is known
that the rework process is the largest NVA contributor activity,
therefore the rework process should be eliminated. The results
of the 5Why's tool analysis show that the cause of many
products going through rework is due to the lack of
smoothness in the sewing process, so if the rework process is
to be removed, the sewing performance must be optimized.
Figure 2. Before and after improvement
Eliminating the rework process can save 60 minutes of
working time. Saving working hours will directly increase the
Figure 2 (B) above illustrates the proposed optimal
production capacity of the mask without having to increase
layout improvement. The proposal is described by adjusting
the input used in the production process so that productivity
the efficiency of operator work (sewing operators and
increases. The proposal to remove rework is to calculate the
helpers), the flow of goods and the efficiency of layout space.
number of machines and man power available as in table 8.
The consequences of eliminating the rework process are:
a. Production Lead Time (LTP) is reduced. The initial LTP IV. CONCLUSION
based on VSM is 126.1 minutes then after the rework
Based on the results of the research that has been done,
process is eliminated, the LTP is reduced to 66.1 minutes.
the conclusion is that reducing the Manufacturing Lead Time
b. The percentage of Process Cycle Efficiency (PCE) has
of mask production can be done by removing Non-Value
increased from 28.37% to 44.13%.
Added activities. By removing Non-Value Added activities
(Rework process) obtained Production Lead Time (LTP) is
reduced. The initial LTP based on VSM is 126.1 minutes then
after the rework process is eliminated, the LTP is reduced to
66.1 minutes. The percentage of Process Cycle Efficiency
(PCE) has increased from 28.37% to 44.13%. - 100 -
JHSS (Journal of Humanities and Social Studies)
Volume 07, Number 01, March 2023, Page 097-101
https://journal.unpak.ac.id/index.php/jhss
e-ISSN: 2598-120X; p-ISSN: 2598-117X REFERENCES
Manufacturing in Practice. Procedia Engineering, 182, 780-785. 2017. [1]
A. & Y. akhimuloh & Mauluddin, “Analisis Kapasitas Produksi di PT.XYZ,” [14]
Kurilova-Palisaitiene, J. Lean “Remanufacturing:
Kalibrasi, vol. 17, pp. 8–17,
Reducing Process Lead Time”, PhD Thesis Linköping 2019. University, Sweden. 2018. [2]
Y. Mauluddin and I. Masitoh, “Rancangan Perbaikan [15]
Turseno, Andi. “Proses Eliminasi Waste dengan Produktivitas Terhadap Perubahan Design di
Departemen Produksi Sewing,”
Metode Waste Assessment Model & Process Activity
J. Kalibr., vol. 18, no.
Mapping pada Dispensing”. Journal Industrial
2, pp. 49–57, 2021, doi: 10.33364/kalibrasi/v.18-2.736.
Manufacturing. 3,(1), pp. 45-50. 2018. [3]
E. S. Apriliana, “Upaya Peningkatan Pendapatan
Nasional di Tengah Wabah Virus Corona Perspektif
Ekonomi Islam,” Al Iqtishadiyah J. Ekon. Syariah Dan
Huk. Ekon. Syariah, vol. 6, no. 1, p. 19, 2022, doi: 10.31602/iqt.v6i1.3097. [4]
S. Alfaritsi, D. Anggraeni, and A. Fadhil, “Analisis
wacana kritis berita ‘tentang social distance’’, cara
pemerintah cegah penyebaran virus corona di
Detik.com,’” J. Communicology, vol. 8, no. 1, pp. 131–152, 2020. [5]
I. Nurhidayat and Y. Mauluddin, “Penentuan Waktu
Dan Jumlah Pengiriman Bolu Lapis Legit Dengan
Model Probabilistic P (Penelitian Di Pd. Sawargi
Kp.Radug - Garut),” J. Kalibr., vol. 12, no. 1, pp. 1–9,
2016, doi: 10.33364/kalibrasi/v.12-1.279. [6]
Y. Mauluddin, K. Yusuf, and E. Lesmana, “Perbaikan
Lintasan Produksi untuk Meningkatkan Efisiensi dengan Menghilangkan Bottleneck dan
Penyeimbangan Lintasan pada Divisi Sewing,” Semin.
Nas. Tek. dan Manaj. Ind., vol. 1, no. 1, pp. 47–54,
2021, doi: 10.28932/sentekmi2021.v1i1.42. [7]
Handayani, D. Yuli, B. Prihandono, and M. Kiftiah,
“Analisis Metode Moodie Young Dalam Menentukan
Keseimbangan Lintasan Produksi,” Bul. Ilm. Mat. Stat.
dan Ter., vol. 5, no. 03, pp. 229–238, 2016. [8]
Y. Mauluddin and I. F. Rahman, “Analisis Lean
Manufacturing Pada Aktivitas Proses Produksi di PT.
Mandala Logam Utama,” J. Kalibr., vol. 17, no. 2, pp.
59–68, 2020, doi: 10.33364/kalibrasi/v.17-2.694. [9]
S. Batubara and R. A. Halimuddin, “Penerapan Lean Manufacturing Untuk Meningkatkan Kapasitas
Produksi Dengan Cara Mengurangi Manufacturing
Lead Time Studi Kasus: Pt Oriental Manufacturing
Indonesia,” J. Penelit. Dan Karya Ilm. Lemb. Penelit.
Univ. Trisakti, vol. 1, no. 1, pp. 49–56, 2016, doi: 10.25105/pdk.v1i1.431. [10]
I. Siregar, A. A. Nasution, U. Andayani, R. M. Sari, K.
Syahputri, and Anizar, “Lean manufacturing analysis
to reduce waste on production process of fan products,”
IOP Conf. Ser. Mater. Sci. Eng., vol. 308, no. 1, 2018,
doi: 10.1088/1757-899X/308/1/012004. [11]
Oleghe, O., & Salonitis, K. “Variation modeling of
lean manufacturing performance using fuzzy logic
based quantitative lean index”. Procedia CIRP, 41, 608- 613. 2016 [12]
Rohani, J. M., & Zahraee, S. M. “Production line
analysis via value stream mapping: A lean
manufacturing process of color industry”. Procedia
Manufacturing, 2, 6-10. 2015. [13]
Wyrwicka, M. K., & Mrugalska, B. “Mirages of Lean - 101 -
Tài liệu liên quan:
-

Phương pháp nghiên cứu khoa học | Cao Hữu Đàm
34 17 -
ESL Learners’ Interaction in an Online Discussion via Facebook - Bài nghiên cứu môn Nghiên cứu Khoa học | Trường Đại học Khoa học tự nhiên, Đại học Quốc gia Thành phố Hồ Chí Minh
42 21 -

An toàn và Đạo lí Sinh học Cấp 3&4 - Nghiên cứu khoa học | Trường Đại học Khoa học Tự nhiên, Đại học Quốc gia Thành phố Hồ Chí Minh
327 164 -
Giáo trình Empower A2 elementary workbook - Nghiên cứu khoa học | Trường Đại học Khoa học Tự nhiên, Đại học Quốc gia Thành phố Hồ Chí Minh
738 369