BÀI GIẢNG PHÂN TÍCH TÂM LÝ HÀNH VI
CHUYÊN VỀ TÂM LÝ LÝ LUẬN
Môn: Tâm lý học giáo dục 410 tài liệu
Trường: Trường Đại học Sư Phạm Hà Nội 3.8 K tài liệu
Tác giả:


Preview text:
Energy Economics 121 (2023) 106661
Contents lists available at ScienceDirect Energy Economics
journal homepage: www.elsevier.com/locate/eneeco
What derives renewable energy transition in G-7 and E-7 countries? The
role of financial development and mineral markets
Muhammad Irfan a,b, Mubeen Abdur Rehman c, Asif Razzaq d, Yu Hao e,f,g,h,i,*
a School of Economics, Beijing Technology and Business University, Beijing 100048, China
b Department of Business Administration, Ilma University, Karachi 75190, Pakistan
c Lahore Business School, University of Lahore, Lahore, Pakistan
d Research Division, CAREC Institute, Urumqi 830000, China
e School of Management and Economics, Beijing Institute of Technology, Beijing 100081, China
f Center for Energy and Environmental Policy Research, Beijing Institute of Technology, Beijing 100081, China
g Beijing Key Lab of Energy Economics and Environmental Management, Beijing 100081, China
h Sustainable Development Research Institute for Economy and Society of Beijing, Beijing 100081, China
i Yangtze Delta Region Academy of Beijing Institute of Technology, Jiaxing 314001, China A R T I C L E I N F O A B S T R A C T Keywords:
The enduring impact of the synergy between environmental sustainability and natural resources varies across Energy transition
countries depending on the economic structure. Though the transboundary effect of mineral resources and Mineral markets
cleaner energy underlines the significance of environmental performance, this research aims to scrutinize this Financial development
inclusive theme by investigating the dynamic effects of mineral markets, and financialization on energy tran- Clean energy Sustainability
sition in selected developed and developing countries from 1990 to 2019. The cross-sectional autoregressive
distributive lags (CS-ARDL) model is applied to address slope heterogeneity and cross-sectional dependency. The
empirical findings reveal that mineral markets significantly contribute to the energy transition process in
accomplishing low-carbon power generation in G-7 countries. In contrast, financial development negatively
influences energy transition; however, it has an insignificant effect on the E-7 countries. The study outcomes are
verified by employing the augmented mean group (AMG) and common correlated effect mean group (CCEMG)
estimators. These findings provide valuable policy recommendations for all stakeholders to drive the transition of
renewable energy toward low carbon and green growth. 1. Introduction
commonly accepted as the principal aspects of this framework since they
can curtail greenhouse gas (GHG) emissions resulting from fossil fuel
Currently, the challenge of reforming world’s energy system is a
consumption (Al Mamun et al., 2018). However, this subject must be
prevailing subject for policymakers (Loorbach et al., 2017). Energy
addressed with proper energy planning to proceed with the energy
transition1 is a process that aims to produce sustainable energy, driven
transition process. As a result, rather than studying energy transition-
by three overarching motives: reducing adverse environmental effects,
related concerns at a national level, a growing body of literature has
increasing energy independence, and growing the industrial and service
done so locally (Suitner and Ecker, 2020). This implies that effective
sectors to support sustainable economic development (Aldieri et al.,
energy transition planning should include the specific aspects of coun-
2019; Lantz et al., 2021). Renewable energy and energy efficiency are tries (Lantz et al., 2021).
* Corresponding author at: School of Management and Economics, Beijing Institute of Technology, 5 Zhongguancun South Street, Haidian District, Beijing 100081, China.
E-mail addresses: irfansahr@bit.edu.cn (M. Irfan), mubeenurehman@gmail.com (M.A. Rehman), asifrazzaq@yahoo.com (A. Razzaq), haoyuking@bit.edu.cn, haoyuking@gmail.com (Y. Hao).
1 It is imperative to transfer the energy sectors from fossil fuels to clean energy; this process is referred to as the “energy transition” (Bond, 2018; De La Pena et al., 2022).
https://doi.org/10.1016/j.eneco.2023.106661
Received 14 September 2022; Received in revised form 7 March 2023; Accepted 2 April 2023 Available online 11 April 2023
0140-9883/© 2023 Published by Elsevier B.V. M. Irfan et Energy Economics al. 121 (2023) 106661
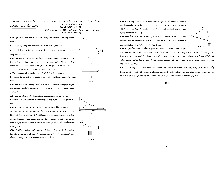
Fig. 1. Energy transition situation between 1990 and 2019.
exacerbate the problem for countries already struggling to survive, both Table 1
in advanced and emerging,4 economists tend to prefer economic and Variables’ description.
security concerns above environmental preservation (Komendantova, Variable name Symbol Source Measurement unit
2021). Stakeholders can only develop solutions for a successful energy
transition by analyzing the distinct barriers and demands encountered in Energy Transition ET WDI
Clean energy concerning fossil fuel- based energy consumption.
each country separately (De La Pena et al., 2022; Relva et al., 2021). Mineral markets MM WITS
Share of export products in percentage
The mining sector is a significant contributor to the global economy Financial
and is one of the most resource-intensive businesses.5 Due to their vital Development FD IMF
The access, depth, and efficiency of
financial institutions and markets Foreign Direct
role in renewable energy transmission, metals, and minerals are Investment FDI WDI
FDI is the net inflow of investment from foreign economies
increasing in value, and the rising demand for clean energy technology Urbanization URB WDI
People are living in urban areas: a
(Jiskani et al., 2022). A World Bank report claims that over 3 billion
proportion of the total population
tonnes of minerals6 will be needed to install geothermal power, solar, Renewable Energy RE WDI
The proportion of RE in total energy consumption
wind, and energy storage will be required to meet the target of the Paris Non-renewable
Agreement to limit global warming to <2 degrees Celsius. More mining Energy NRE WDI
The proportion of NRE in total energy consumption
will be required to address the environmental challenges in a climate- Gross Domestic
smart and sustainable manner due to the worldwide shift to low- Product GDP WDI
Per capita economic growth (constant US$ 2015)
carbon technologies that primarily rely on minerals (Jiskani et al.,
Notes: WDI, WITS, and IMF stand for World Development Indicators, World 2021).
Integrated Trade Solution, and International Monetary Fund, respectively.
It is well acknowledged that the increasing demand for mineral re-
sources increases the production volume and project complexity
The two most prevalent narratives in the literature deal with rapid2
(Dubinski, 2013), resulting in decision-making difficulties (Chinbat and
and gradual3 energy transitions. Some scholars claim that it is irrational
Takakuwa, 2009). An intense mining process increases resource con-
to believe the energy transition has become boosted by the intermittent
sumption and operational hazards. Hence, it leads to the danger of
nature and slow development of cleaner energy sources because of the
interaction between elements of sustainable mining and the mining
expensive infrastructure associated and historical policies of gradual
system, such as the community, environment, economy, safety, and
global transformations (Smil, 2016). Others argue that despite the
productivity. The impact of risks7 impeding project objectives exerts an
traditional evidence favoring conventional and gradual views, there is
incredible strain on the project’s overall performance. In the first place,
sufficient evidence to suggest that they can happen promptly in specific
mining operations promote a greener procedure and contribute to
circumstances, particularly when climate change, scarcity, and techno-
cleaner energy generation. To accomplish cleaner energy targets based
logical innovations are becoming accelerating factors (De La Pena et al.,
on activities of minerals mining, it is indispensable to conduct a risk 2022: Sovacool, 2016).
assessment to mitigate, avoid and control the risk management strate-
The energy transition initiatives bring several challenges, for gies (Amoatey et al., 2017).
instance, social, economic, and technical concerns (Papadis and Tsat-
saronis, 2020). The energy transition is experienced at varying rates in
different economies. When constraints like the Covid-19 epidemic
4 Developing nations confront infrastructure and economic challenges in
decarbonizing their energy systems.
5 Following the World Bank report, the production of various metals and
minerals including cobalt, lithium, graphite, vanadium, nickel, and indium is
2 A rapid narrative (or approach) means that advanced technologies are
projected to increase up to 585%, 964%, 383%, 173%, 108%, and 241% by
meeting the growing need for energy and new policies are reshaping markets,
2050, respectively (Hund et al., 2020).
business models, and consumer habits to provide social benefits and promote a
6 Minerals for sustainable energy technology will acquire from nations with low-carbon economy.
abundant mineral deposits that have yet to be explored.
3 The gradual approach promotes carbon-intensive initiatives by extending
7 It is because the risk associated with mining failures may also reduce the
the traditional strategies and policy practices.
chance of reaching the operation’s planned sustainable objectives. 2 M. Irfan et Energy Economics al. 121 (2023) 106661
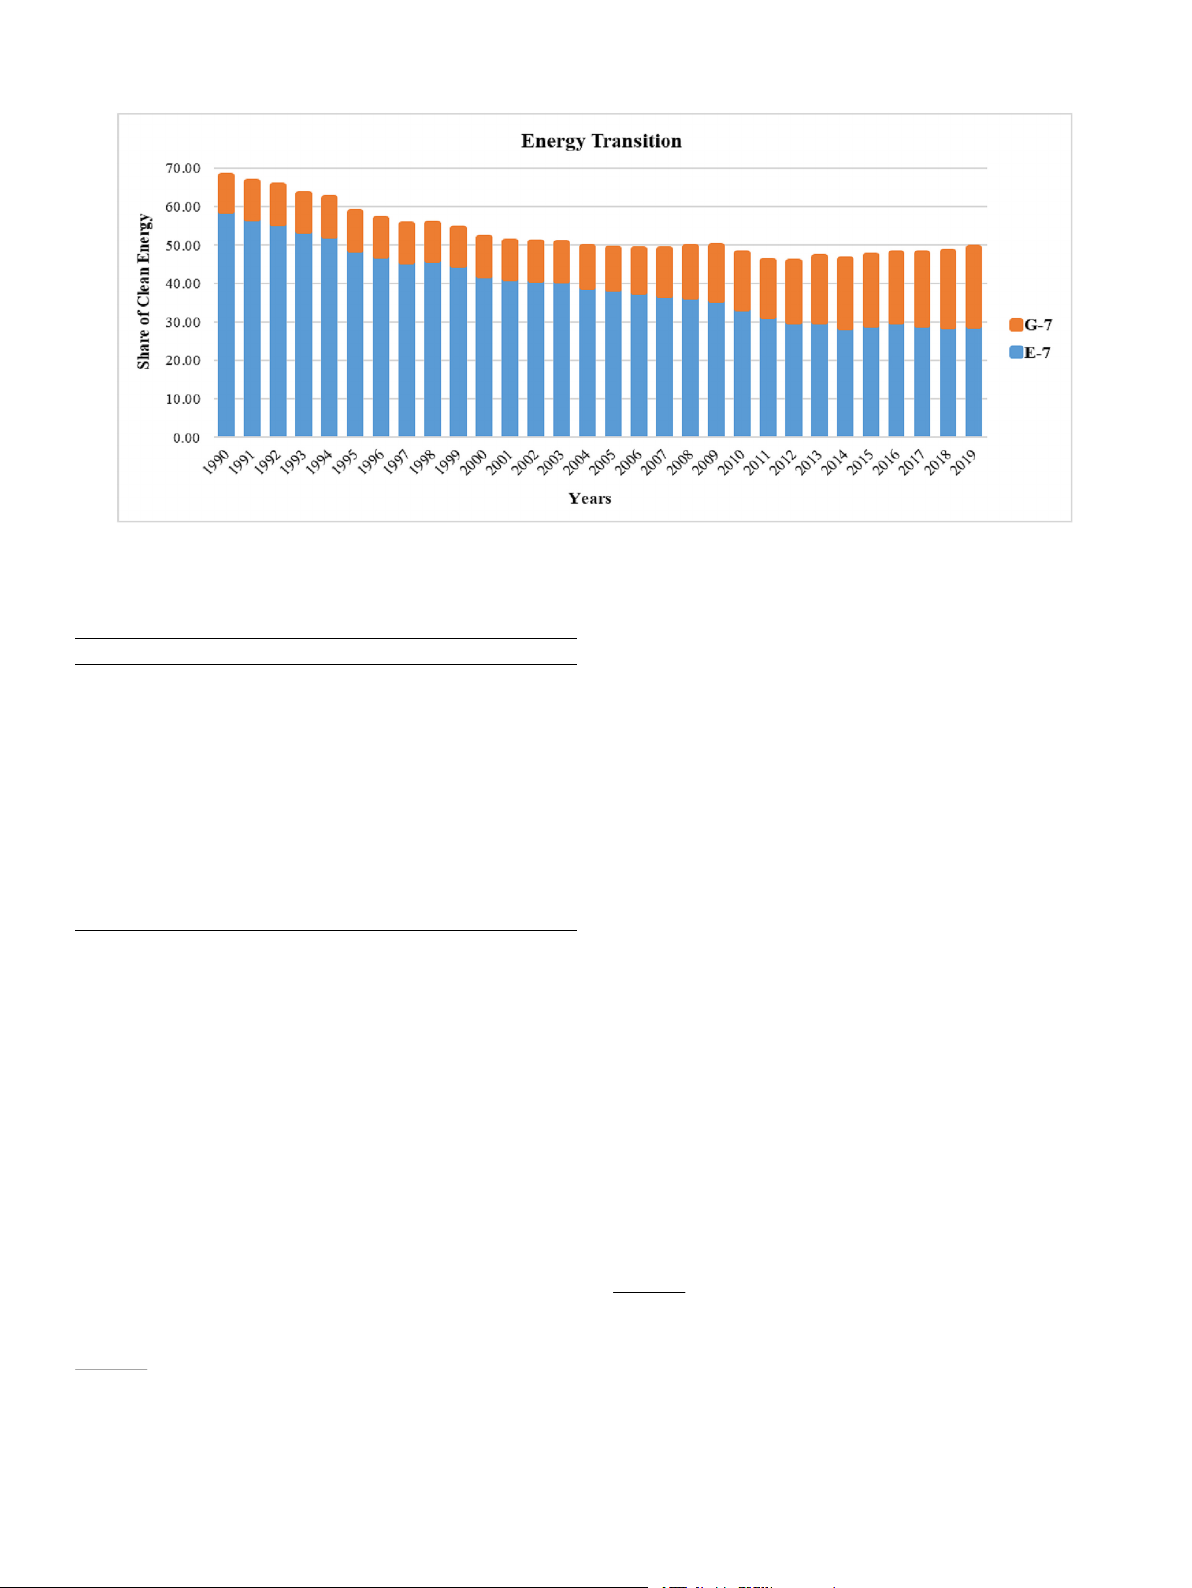
Fig. 2. Distributions of critical variables in G-7 and E-7 economies. No data reports the countries outside the sample. 3 M. Irfan et Energy Economics al. 121 (2023) 106661 Table 2 Summary statistics. Variables N Mean SD Min 1st Quartile Median 3rd Quartile Max Model 1 ET 210 12.763 9.794 0.674 5.128 8.577 20.047 33.181 MM 210 0.946 0.983 0.208 0.407 0.602 0.892 5.846 FD 210 0.742 0.134 0.345 0.691 0.759 0.858 0.946 FDI 210 10.442 0.693 7.543 10.120 10.526 10.834 11.709 URB 210 77.835 5.526 66.706 75.417 78.202 80.606 91.698 RE 210 9.266 6.575 0.608 4.430 7.355 13.200 22.690 NRE 210 79.009 12.474 46.226 75.197 82.694 86.438 94.633 GDP 210 4.565 0.080 4.439 4.501 4.544 4.624 4.783 Model 2 ET 210 39.953 31.864 3.495 12.976 29.703 71.400 109.670 MM 210 1.258 1.358 0.266 0.576 0.808 1.254 7.363 FD 210 0.406 0.108 0.191 0.327 0.395 0.474 0.657 FDI 210 10.076 0.708 7.867 9.554 10.239 10.563 11.464 URB 210 59.376 19.599 25.547 39.776 67.533 74.587 86.824 RE 210 26.177 17.183 3.180 11.510 24.022 43.620 58.653 NRE 210 76.279 13.919 51.216 62.549 81.404 88.898 93.396 GDP 210 3.631 0.370 2.722 3.313 3.798 3.933 4.079
Model 1 indicates G-7, whereas Model 2 denotes E-7 economies. N and SD stand for no. of observations and standard deviation, respectively.
boosts economic growth (GDP), resulting in an energy consumption Table 3
escalation. Secondly, the growth of the financial sector and the process of Findings of the CSD test.
effective financial intermediation lead to a rise in the consumption of Variables Model 1 Model 2
energy products. Thirdly, capital and financial market development Breusch-Pagan Pesaran CD Breusch-Pagan Pesaran CD
expand the investment level that raises energy consumption (Shahbaz LM LM et al., 2018; Zhang, 2011). ET 152.368*** − 0.757 184.882*** − 0.700
Financial support is considered one of the most critical measures for (0.000) (0.449) (0.000) (0.484)
sustainable development. According to the “financial structure theory” MM 121.773*** 7.294*** 56.984*** − 0.517
and “financial promotion theory” proposed by Goldsmith and Schum- (0.000) (0.000) (0.000) (0.605)
peter, respectively, financial institutions may assist economic develop- FD 127.350*** 13.556*** 60.859*** 3.123***
ment (Yang and Ni, 2022). The nexus between green economic (0.000) (0.000) (0.000) (0.002) FDI 26.294 2.412** 41.958*** 2.328**
transactions and financial development further demonstrates the dual (0.195) (0.016) (0.004) (0.020)
role of the financial sector. Scale, structural and technological effects URB 106.623*** 6.276*** 132.127*** − 1.717*
themselves can broaden the economic scale. Financial development may (0.000) (0.000) (0.000) (0.086)
enhance the economic structure and minimize ecological pollution by RE 269.642*** − 1.418 101.609*** 0.285 (0.000) (0.156) (0.000) (0.775)
applying manufacturing processes and modernizing equipment with NRE 228.038*** 1.931* 163.357*** − 2.583***
environmentally friendly production techniques (Sadorsky, 2010). (0.000) (0.054) (0.000) (0.010)
Contrarily, the expansion of financing channels with high-energy use, GDP 270.652*** 3.899*** 95.602*** − 1.372
GHG emissions, and pollution levels has decreased the effectiveness of (0.000) (0.000) (0.000) (0.170)
green economic development (Boutabba, 2014; Yang and Ni, 2022).
Notes: Model 1 indicates G-7, whereas Model 2 denotes E-7 economies. *** and
To improve the environmental performance in both developed and
** denote the significant levels at 1% and 5%, respectively, whilst * claims at the
developing countries, this research aims to probe how mineral markets,
10% level. P-values are reported in the parenthesis.
financial development, and FDI play their role in achieving the goals of
sustainable energy consumption. The group of seven (G-7)9 comprises
exceptionally advanced economies, and these countries account for 58% Table 4
of the worldwide wealth (IMF, 2018). Among the advanced nations, this Findings of SH test.
is a platform to address financial and economic concerns since this Statistics Model 1 Model 2
forum is not free from challenges. Following ratifying the Paris Climate Test value Prob. Test value Prob.
Agreement (PCA), most G-7 nations have taken necessary ecological Tilde (Delta) 5.816*** <0.001 9.146*** <0.001
preservation actions to achieve sustainable economic development. Adjusted tilde (Delta) 7.185*** <0.001 11.299*** <0.001
However, the G-7 economies are responsible for almost 24.58% of GHG
emissions worldwide (Wang et al., 2020; WDI, 2021). The emerging
Notes: *** and ** denote the significant levels at 1% and 5%, respectively, while
seven10 or E-7 countries comprise the other sample panel for our * claims at a 10% level.
research. These economies have the potential to expand and may even
For the development and stability8 of an economy, the financial
outperform several important developed markets. Therefore, it is crucial
sector is crucial. It is indispensable to consider the financial sector
to research E-7 economies to provide obligatory policies and ’s role
in environmental degradation. Three key channels may explain the recommendations.
relationship between energy and financial development. Firstly, more
This study explores the tendency of energy transition from 1990 to
financial development increases foreign direct investment (FDI) and
2019 for G-7 and E-7 countries as represented in Fig. 1. Since 1990, the
9 G-7 consists of Canada, France, Germany, Italy, Japan, the United Kingdom
8 Economic and financial stabilities are two sides of the same coin (Nasir
and the United States of America. et al., 2015).
10 Brazil, China, India, Indonesia, Mexico, Russia, and Turkey. 4 M. Irfan et al. 5
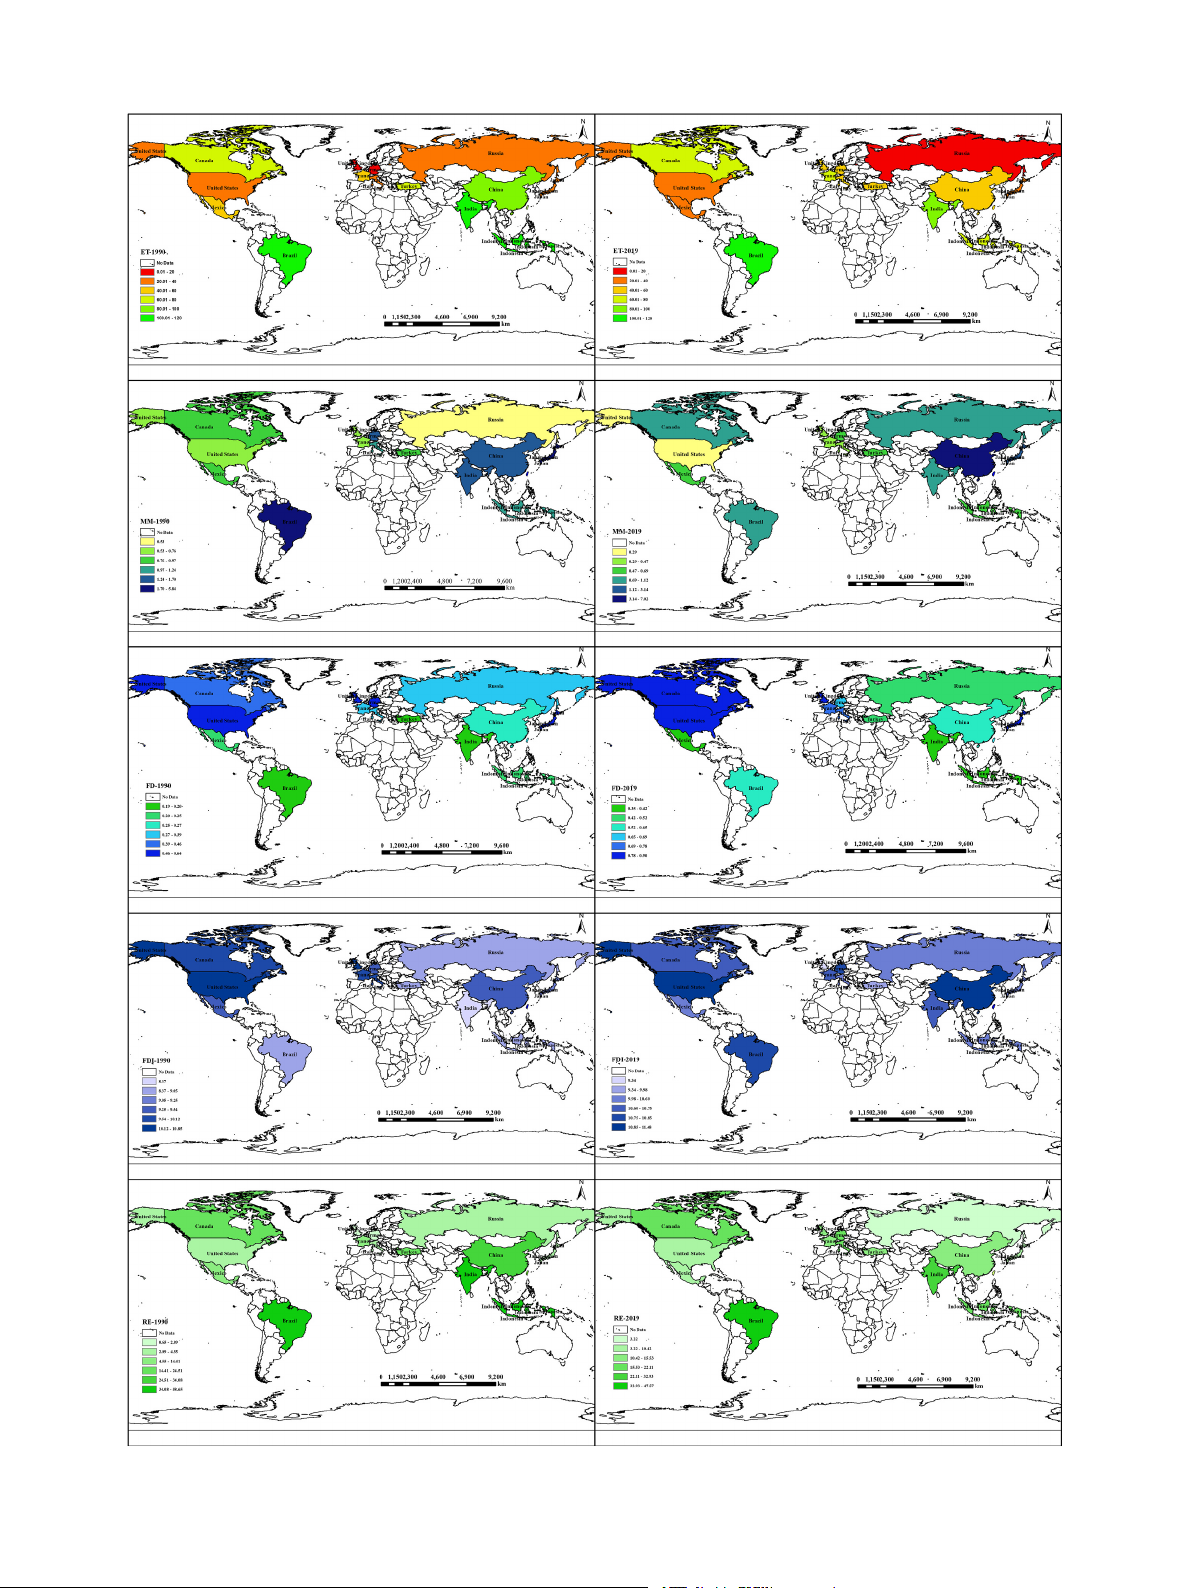
Fig. 3. Binary-relation scatter plots. Energy Economics 121 (2023) 106661 M. Irfan et Energy Economics al. 121 (2023) 106661 Table 5
Findings of 1st and 2nd generation unit root tests. Variables IPS ADF CIPS CADF I(0) I(I) I(0) I(I) I(0) I(I) I(0) I(I) Model 1 ET 6.769 − 4.854*** 4.782 − 5.292*** − 1.129 − 5.314*** − 0.578 − 3.392*** (1.000) (0.000) (1.000) (0.000) (0.999) (0.000) MM − 3.094*** − 7.912*** − 3.398*** − 8.616*** − 2.395** − 4.997*** − 2.217 − 4.677*** (0.001) (0.000) (0.000) (0.000) (0.106) (0.000) FD − 3.370*** − 6.104*** − 3.711*** − 6.657*** − 2.487** − 5.484*** − 2.064 − 3.955*** (0.000) (0.000) (0.000) (0.000) (0.204) (0.000) FDI − 1.951** − 8.684*** − 2.126** − 9.319*** − 3.359*** − 6.018*** − 2.600** − 4.258*** (0.026) (0.000) (0.017) (0.000) (0.011) (0.000) URB 1.800 0.376 1.525 0.544 1.113 − 1.849 − 0.305 − 1.135 (0.964) (0.646) (0.936) (0.707) (1.000) (0.956) RE 6.925 − 5.235*** 4.710 − 5.669*** − 1.369 − 5.149*** − 0.892 − 3.517*** (1.000) (0.000) (1.000) (0.000) (0.991) (0.000) NRE 1.780 − 6.850*** 1.966 − 7.515*** − 1.421 − 5.172*** − 1.601 − 3.269*** (0.963) (0.000) (0.975) (0.000) (0.668) (0.000) GDP 1.025 − 6.761*** 1.162 − 7.298*** − 1.425 − 3.686*** − 1.938 − 2.742*** (0.847) (0.000) (0.877) (0.000) (0.314) (0.004) Model 2 ET − 0.676 − 6.291*** − 0.644 − 6.733*** − 1.707 − 4.930*** − 1.450 − 3.157*** (0.250) (0.000) (0.260) (0.000) (0.801) (0.000) MM − 3.186*** − 8.053*** − 3.394*** − 8.747*** − 3.170*** − 5.575*** − 2.531** − 4.001*** (0.000) (0.000) (0.000) (0.000) (0.018) (0.000) FD − 0.774 − 8.091*** − 0.791 − 8.765*** − 2.234* − 5.061*** − 2.335* − 3.971*** (0.220) (0.000) (0.214) (0.000) (0.058) (0.000) FDI − 2.487*** − 8.114*** − 2.685*** − 8.686*** − 3.114*** − 5.524*** − 2.958*** − 4.075*** (0.007) (0.000) (0.004) (0.000) (0.001) (0.000) URB 2.940 1.296 2.525 1.278 − 1.513 − 2.348** − 4.234*** − 1.758 (0.998) (0.902) (0.994) (0.899) (0.000) (0.502) RE 0.656 − 6.744*** 0.768 − 7.246*** − 1.946 − 4.917*** − 1.719 − 3.172*** (0.744) (0.000) (0.779) (0.000) (0.545) (0.000) NRE − 1.999** − 6.605*** − 2.186** − 7.067*** − 2.109 − 4.874*** − 1.834 − 3.508*** (0.023) (0.000) (0.014) (0.000) (0.420) (0.000) GDP 2.620 − 4.938*** 2.671 − 5.471*** − 1.895 − 3.381*** − 2.647*** − 2.545** (0.996) (0.000) (0.996) (0.000) (0.008) (0.016)
Model 1 indicates G-7, whereas Model 2 denotes E-7 nations. *** and ** represent the significant levels at 1% and 5%, respectively, while * claims at the 10% level. P-
values are shown in the parenthesis. Table 6
Findings of unit root test with a structural break. Variables Model 1 Model 2 I(0) NB I(1) NB I(0) NB I(1) NB ET 2.123 1 − 16.150*** 1 1.188 1 − 17.619*** 1 (1.000) (0.000) (1.000) (0.000) MM − 0.297 1 − 3.782*** 1 − 0.794 1 − 9.889*** 1 (0.280) (0.000) (0.400) (0.000) FD − 0.005 1 − 0.103*** 1 0.000 1 − 0.126*** 1 (0.110) (0.000) (0.870) (0.000) FDI − 4.696** 1 − 24.616*** 1 − 0.314 1 − 8.261*** 1 (0.030) (0.000) (0.220) (0.030) URB 0.153 1 − 8.563*** 1 0.190 1 − 6.153*** 1 (0.900) (0.000) (0.960) (0.000) RE 1.742 1 − 13.699*** 1 1.792 1 − 18.745*** 1 (1.000) (0.000) (1.000) (0.000) NRE − 2.001 1 − 18.110*** 1 0.318 1 − 22.429*** 1 (0.230) (0.000) (0.960) (0.000) GDP 0.000 1 − 0.004*** 1 0.001 1 − 0.014* 1 (1.000) (0.000) (1.000) (0.090)
Model 1 indicates G-7, whereas Model 2 denotes E-7 nations. NB stands for the number of breaks. *** and ** represent the significant levels at 1% and 5%, respectively,
while * claims at the 10% level. P-values are shown in the parenthesis.
energy transition in G-7 countries (orange bars) is gradually increasing
The current study aims to probe the dynamic determinants of the
and has almost doubled in the given three decades asserting that the
energy transition, making several possible contributions to the field from
increased dependence of developed nations on clean and renewable
numerous angles. First and foremost, energy transition, a somewhat
energy sources. In the case of emerging economies (blue bars), the en-
idiosyncratic element, focuses on cleaner energy input to curb GHG
ergy transition share is steadily decreasing and has become half of its
emissions by concerning low-carbon power generation (Nam and Jin,
starting point in 1990. This is because non-renewable energy practices
2021) following the energy trade perspective (Zhang et al., 2021). The
are fulfilling more demand for energy in emerging economies.
primary theoretical input of this research states that how much clean 6 M. Irfan et Energy Economics al. 121 (2023) 106661 Table 7
the environment’s ecology. While dirty energy hinders green develop-
Findings of cointegration test.
ment, clean energy encourages it (Ulucak, 2020). The primary contri- Estimates Model 1 Model 2
bution to global warming is humans’ usage of dirty energy in their daily
activities of production and habitation (Sarkar et al., 2022). Moreover, Stat. Prob. Stat. Prob.
the effects of global warming on social progress and economic growth Pedroni Co-integration Test
result in a 25% decline in global GDP, even though limiting GHG Phillips-Perron t − 3.021*** 0.001 − 1.787** 0.037
emissions only costs 1% of the economic growth (Stern, 2007). The ef- Phillips-Perron t (Modified) 2.151** 0.016 3.059*** 0.001 Dickey-Fuller t (Augmented) − 2.754*** 0.003 − 0.660 0.255
fect of global warming on the economy is greater than the expense of
mitigating it; hence global warming is becoming a cause of slowing
down economic growth (Dogan et al., 2022; Tzeremes et al., 2023). Kao Co-integration Test Dickey-Fuller t 3.443*** <0.001 − 2.718*** 0.003
Therefore, it makes perfect sense to depend less on dirty energy and Dickey-Fuller t (Modified) 2.418*** 0.008 − 2.261** 0.012
increase the use of clean energy that helps to mitigate environmental Dickey-Fuller t (Augmented) 3.562*** <0.001 − 2.081** 0.019
pollution (Rahman and Alam, 2021). The application and promotion of Unadjusted Dickey-Fuller t 3.595*** <0.001 − 2.541*** 0.006
green energy have evolved into the contemporary era’s development Unadjusted Dickey-Fuller t (Modified) 2.469*** 0.007 − 1.753** 0.040
trend in response to the rising demand for sustainable development.
A scarce body of studies estimates the role of renewable and con-
Notes: *** and ** denote the significant levels at 1% and 5%, respectively, while
ventional energy and financial channels on energy transition when * claims at a 10% level.
technical circumstances stay the same (Chen et al., 2022; Liu et al.,
2022). As a result, the second novelty of this article is to calculate the
energy can substitute for dirty energy is worthy of attention. Second, the
amount of clean energy that can replace dirty energy in both emerging
dynamic impact of the mineral markets, financial development, and FDI
and developed economies. This study significantly lowers environ-
on energy transition is investigated using the cross-sectional autore-
mental deterioration since it encourages implementing clean energy to
gressive distributive lag (CS-ARDL) statistical technique (Chudik and
promote sustainable development and green growth. Panel data analysis
Pesaran, 2015) to estimate the long and short-run impact of explanatory
has been used to estimate how much carbon is mitigated by the global
variables for the period of 1990–2019. This advanced approach is effi-
energy transition. The impact of renewable energy on GHG emissions
cient enough to handle cross-section dependence (CSD), heterogeneous
was disclosed for BRICS and sub-Saharan nations (Danish, 2020). In
slope coefficients, endogeneity, and unit root in the series (Khan et al.,
contrast, Vo et al. (2020) independently revealed the influence of nu-
2020). In addition to the dynamic model, augmented mean group (AMG)
clear, alternative, and renewable energy on carbon reduction. Both
and common correlated effect mean group (CCEMG) estimator are
studies concluded that using cleaner energy helps to reduce CO
applied to obtain robust results. Third, to contrast developed and devel- 2 emis-
sions. Consuming clean energy contributes to sustainable economic
oping economies, this research used the sample of G-7 and E-7 countries
development (Taskın et al., 2020). The necessity of encouraging the use
separately to compare the features of both groups and recommend
of clean energy is confirmed by literature demonstrating the link be-
necessary policy implications. Last, the energy transition becomes
tween renewable energy and green growth. Pao and Fu (2013) discov-
enriched using a pool of control variables: urbanization, clean energy,
ered how using clean and dirty energy might affect economic growth in
non-renewable energy, and economic growth to obtain reliable
Mexico, Indonesia, South Korea, and Turkey (MIST). outcomes.
Extended literature argued for the significance of the phases and
The rest of the article is structured as follows. Section 2 reviews and
components of mining operations that contribute to the energy transi-
presents the relevant literature. Section 3 defines the data and in-
tion. For example, growing consumer demand raises concerns about
troduces the methodology used in this study. Section 4 portrays the
metal supply and scarcity. Thus, mining projects must demonstrate their
empirical analysis of the effects of minerals and financial development
risk assessment, mitigation, and management capacity. Otherwise, the
on energy transition in developed and developing nations. In the end,
energy transition-based minerals supply would be delayed, making the
the conclusion and necessary policy implications are shown in Section 5.
transition to a low-carbon proposal much more challenging (Islam et al.,
2022; Lebre et al., 2020; Zhu et al., 2022). Research on the mining
2. Literature review and theoretical framework
projects’ risk management analyzed that mining at large-scale opera-
tions has been ineffective due to underestimating or ignoring the haz- 2.1. Literature review
ards (Irfan et al., 2022a; Xie et al., 2022). For the success of mining
operations, technologies should be applied effectively to increase the
Energy and GHG emissions have a strong relationship; hence, several
dependability of choices (Irfan et al., 2022b).
research studies have inspected the influence of energy transition and
Other risk-based quantitative studies undertaken in the mining
efficiency on CO2 emissions (Nam and Jin, 2021). Clean energy, which
sector have focused on various risk factors, including operational, safety,
may be used as a proxy for energy transition, has been included in most
and water inrush. For instance, Gul et al. (2019) developed an advanced
articles that have linked substitution and electrification with energy
technique for an underground zinc and copper mines case study. Iphar
transition. This nexus provided empirical evidence and theoretical
and Cukurluoz (2020) presented a fuzzy safety evaluation approach to
background for green development to validate the socio-economic in-
improve the risk assessment practice in mechanized coal mines. This was
dicators and improve environmental performance (Acheampong et al.,
done to compensate for the deficiencies of the traditional decision ma- 2023; Wang et al., 2022).
trix method’s precise risk score. Financial risks at a gold mine were
Clean11 and dirty12 energy are two categories of energy consump-
evaluated using an expanded TOPSIS technique (Jiskani et al., 2022).
tion. This classification depends on how much energy usage influences
Economic growth and financial development have significantly
affected the relationship between the environment and energy (Khan
et al., 2022). The first category ensures empirical and theoretical sup- 11
port for financial development to demonstrate how crucial it is to
Clean energy is primarily defined as energy that does not produce waste,
encourage economic growth and preserve environmental performance
pollution or GHG emissions and thus is not considered bad for the environment
(Chincarini and Moneta, 2021; Lee and Wang, 2022). (Garai and Sarkar, 2022). 12
Various studies have observed the effects of financial development
On the other hand, dirty energy, such as fossil fuel-based, is the energy that
emits significant amounts of GHG gases, solid and liquid wastes that are
on environmental deterioration since the Environmental Kuznets Curve
damaging to the atmosphere throughout the consumption process.
(EKC) hypothesis was proposed (Grossman and Krueger, 1995). 7 M. Irfan et Energy Economics al. 121 (2023) 106661 Table 8
Findings of Westerlund Bootstrap cointegration test. Estimates Model 1 Model 2 Value Z-value Prob. Robust Prob. Value Z-value Prob. Robust Prob. Gt − 3.995 − 4.293 <0.001 <0.001 − 2.653 − 0.020 0.492 0.148 Ga − 9.310 1.259 0.896 <0.001 − 0.611 4.610 1.000 1.000 Pt − 8.780 − 2.858 0.002 0.015 − 15.835 − 8.841 0.000 0.000 Pa − 4.130 1.806 0.965 0.405 − 1.164 3.223 0.999 0.850
Notes: *** and ** denote the significant levels at 1% and 5%, respectively, while * claims at a 10% level.
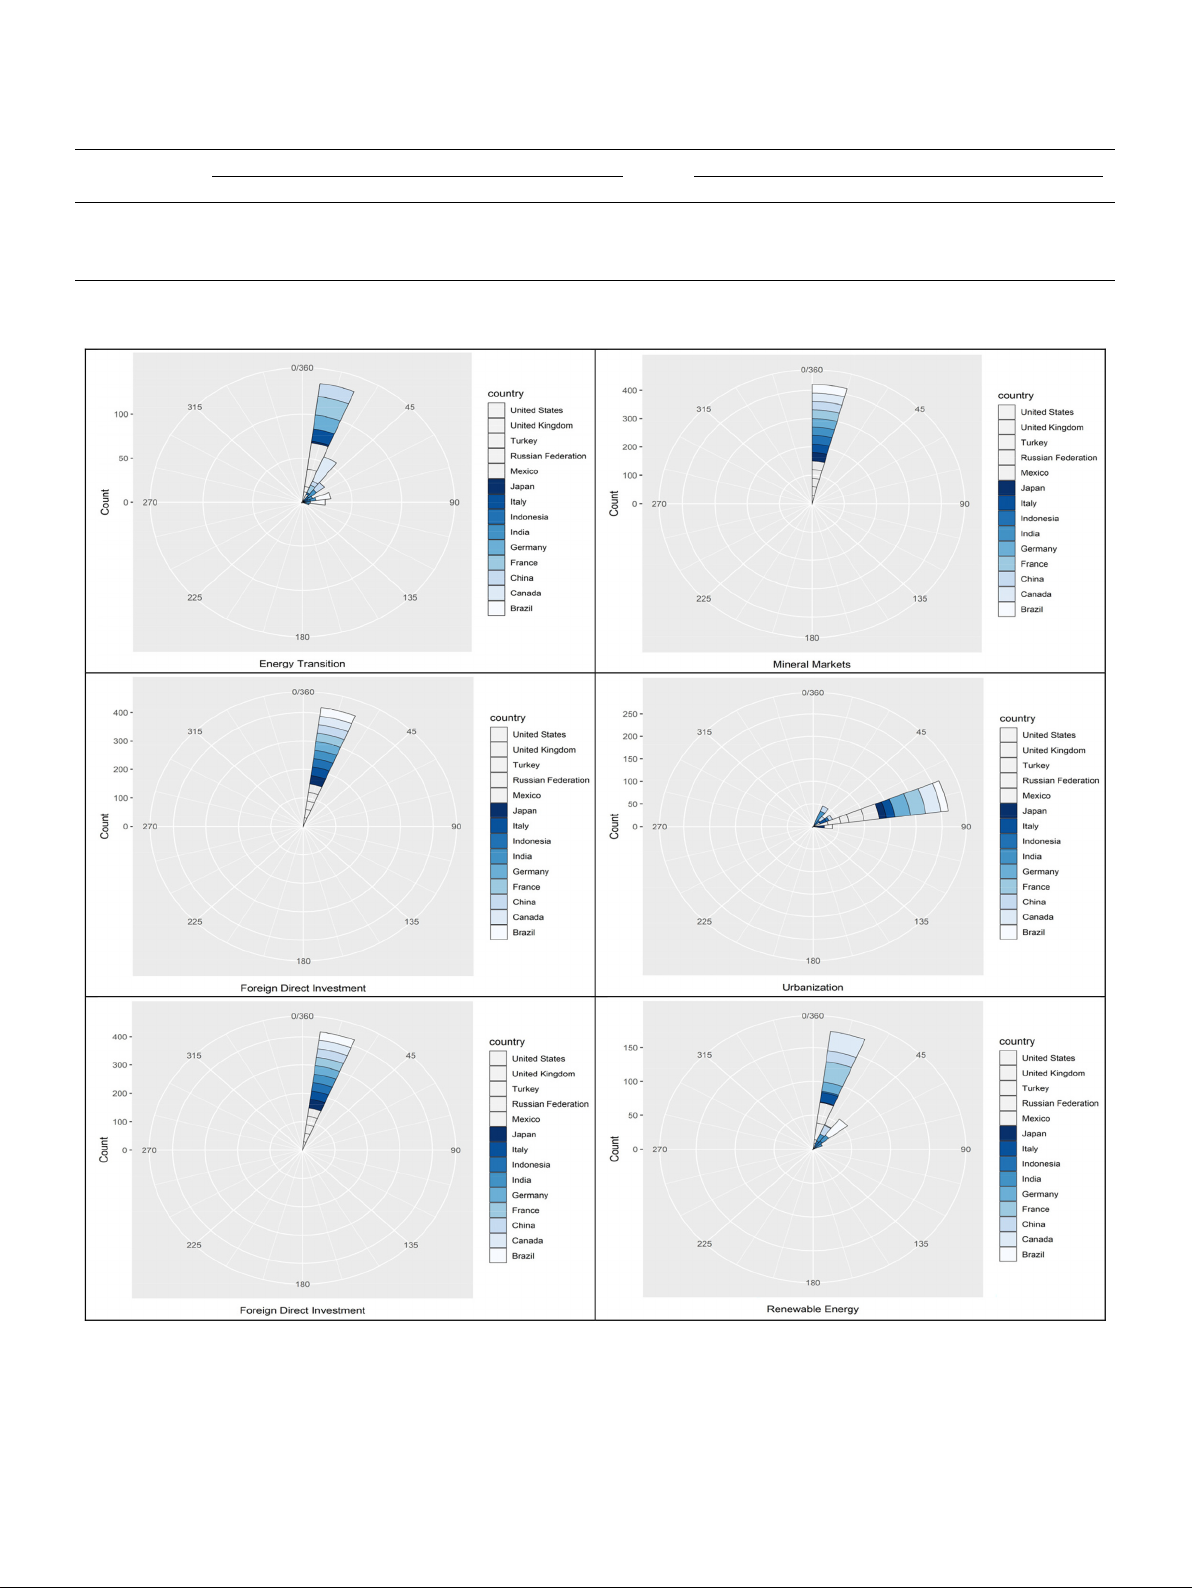
Fig. 4. Circulars plots.
According to one school of thought, financial development has a nega-
emissions (Charfeddine and Kahia, 2019). Similarly, Khan et al. (2017)
tive impact on ecological performance (Ouyang and Li, 2018). Due to
examined how financial development affects environmental degrada-
financial development, financial institutions provide households and
tion in 34 upper-middle-income nations. The authors’ empirical analysis
investors with low-cost borrowing options with fewer constraints,
discovered that financial development adversely affects ecological per-
increasing their need for energy and hence, contributing to GHG
formance. In contrast, the other school contends that the financial sector 8 M. Irfan et Energy Economics al. 121 (2023) 106661 Table 9 Findings of CS-ARDL test. Variables Model 1 Model 2 Variables Model 1 Model 2 Coef. St. Errors Coef. St. Errors Coef. St. Errors Coef. St. Errors Long Run Estimates Short Run Estimates MM 0.356*** 0.072 0.020 0.129 ΔMM 0.352*** 0.071 0.022 0.132 (0.000) (0.879) (0.000) (0.869) FD − 0.491** 0.244 − 1.472 1.862 ΔFD − 0.516** 0.249 − 1.503 2.012 (0.045) (0.429) (0.038) (0.455) FDI 0.005 0.043 − 0.200 0.193 ΔFDI 0.002 0.042 − 0.208 0.199 (0.911) (0.300) (0.968) (0.296) RE 1.297*** 0.109 1.281*** 0.103 ΔRE 1.290*** 0.103 1.324*** 0.105 (0.000) (0.000) (0.000) (0.000) NRE − 0.185*** 0.051 − 0.636*** 0.183 ΔNRE − 0.180*** 0.049 − 0.670*** 0.194 (0.000) (0.001) (0.000) (0.001) URB 0.426* 0.219 0.521* 0.288 ΔURB 0.403** 0.203 0.554* 0.302 (0.052) (0.071) (0.047) (0.066) GDP 0.026 1.472 − 0.143 3.556 ΔGDP − 0.138 1.447 − 0.346 3.716 (0.986) (0.968) (0.924) (0.926) F-Stat 30.280 47.340 p-value 0.005 0.071 N 196 196
Model 1 indicates G-7, whereas Model 2 denotes E-7 economies. *** and ** denote the significant levels at 1% and 5%, respectively, while * claims at the 10% level. P-
values are reported in parentheses.
Most economies place concerns on economic development, and the Table 10
urgent issues related to climate change have sparked researchers’ in- Findings of robustness tests.
terest in finding ways to reduce its damaging impacts. Even so, emerging Variables Model 1 Model 2
countries seek to escalate their economic development through various
methods and processes. One of the most appealing techniques is FDI, AMG CCEMG AMG CCEMG
which is a significant source of outside investment since it may boost MM 0.154** 0.662** 0.082* 0.078*
economic growth by expanding production. Moreover, it might result in (0.061) (0.286) (0.048) (0.041) FD − 0.499* − 0.491 0.928** 3.202**
the transfer of modern technology and assistance as well as the creation (0.293) (0.397) (0.474) (1.315)
of employment. More in-depth analyses of the FDI phenomenon and its FDI 0.002 0.038 − 0.027 0.457*
effects on the environment have recently been conducted in academic (0.016) (0.034) (0.058) (0.240) studies. REC 1.201*** 1.270*** 1.230*** 1.266*** (0.045) (0.046) (0.120) (0.034) NREC − 0.163*** − 0.116*** − 0.675*** − 0.444*** (0.052) (0.032) (0.260) (0.043)
2.2. Theoretical framework URB 0.027 − 0.103 − 0.016 1.107*** (0.080) (0.213) (0.023) (0.348)
The process of energy transition covers three facets: energy inde- GDP − 0.254* 3.290 − 1.161 − 9.550** (0.139) (2.275) (1.138) (4.694)
pendence, reducing adverse environmental effects, growing the indus- Const. 10.101 41.567** 39.515* − 256.535***
trial and service sectors to accomplish sustainable environmental (9.390) (18.458) (22.514) (74.976)
objectives (Lantz et al., 2021), and transferring the energy sector to a Wald-Test 727.760 7418.140 120.280 43.650
clean and sustainable one (De La Pena et al., 2022). The energy transi- RMSE 0.052 0.027 0.256 0.107
tion indicator is adjusted for FDI and financial development. The p-vale <0.001 <0.001 <0.001 <0.001 N 210 210 210 210
Pollution Halo13 and the Pollution Haven14 hypotheses capture the lit-
erature’s attention by considering the environmental effects of FDI. Most
Model 1 indicates G-7, whereas Model 2 denotes E-7 economies. *** and **
research (see Huang et al., 2019; Singhania and Saini, 2021; Zafar et al.,
denote the significant levels at 1% and 5%, respectively, while * claims at the
2020) affirms the Pollution Haven in developing nations and claims that
10% level. P-values are reported in parentheses.
FDI raises GHG emissions by transferring the contaminating activities to
raises environmental standards. For instance, efficient research and
the host countries. FDI can curtail GHG emissions via energy-efficient
technology and restrictions on carbon emissions projects lead to green
technologies and boost economic development (Caetano et al., 2022). finance.
Based on the theoretical notion of the energy trade model, financi-
Similarly, Shahbaz et al. (2013) claimed that trade openness and
alization and FDI further lead to trade activities affecting cleaner energy
financial sector growth had decreased environmental damage in Indo-
consumption through three distinct aspects: scale, technical and nesia
composition effects. The scale effect pertains to escalating the produc-
’s case. The nexus between financial development and GHG emis-
sions were examined for G-20 nations and found that the financial sector
tion level in an economy. For instance, a rise in the production process
reduces GHG emissions. In addition, it is also noted that financial
demands more raw materials and energy, further leading to financiali-
development does not have any relationship with environmental quality
zation and increasing environmental contamination by shifting the
(Ozturk and Acaravci (2013). Global economies are adopting green in-
vestment strategies and transferring investments from high to low- 13
polluting projects to combat climate change (Wang and Zhi, 2016;
According to the Pollution Halo theory, FDI transfers effective and envi-
Zerbib, 2019). By providing the funding needed for projects with low
ronmentally friendly technologies that lower degradation primarily by CO
consuming less energy (Aust et al., 2020).
2 emissions levels, financial instruments like blue and green bonds
14 In the Pollution Haven theory, on the other hand, economies with strict
may play a significant role in addressing climate-related challenges
environmental policies shift their polluting industries to nations with less
(Mumtaz and Yoshino, 2021; Xu et al., 2020).
stringent environmental regulations. 9 M. Irfan et Energy Economics al. 121 (2023) 106661
country to the industrial level (Zhang et al., 2021). The technical effect
transition, mineral markets, financial development, FDI, and renewable
helps to adopt innovation and advanced technologies to improve effi-
energy for G-7 and E-7 economies in 1990 and 2019 in Fig. 2. Economies
cient production and energy themes. In the end, the composition effect
are allocated into 07 levels, where bright color directs higher magnitude
presents a change in the economic structure mix: Shifting to the services
whereas light color denotes a lower value of the relevant indicator. In
section (less polluting sector).
the given three decades, every developed or developing country has
While the continuing growth in financialization and economic ac-
been changed blatantly, as conspicuous in the figure.
tivities, it has become progressively challenging to hold the proportions
of these influencing three effects constant. In the case of economic
3.2. Econometric modeling
growth, GDP is a measure of economic health and comprises several
economic components, including investment, production, consumption,
3.2.1. CSD and slope heterogeneity tests
government spending, and FDI. Since a significant part of economic
This study estimates the CSD15 and SH coefficient tests for all the
growth involves energy consumption and this rising consumption is
variables. Traditional methods have ignored these basic preliminary
directly associated with energy transition. Energy transition fosters the
tests, and their absence may lead to inconsistent estimates (Li et al.,
inclusive inputs to mitigate GHG emissions that have been validated
2020; Ulucak and Khan, 2020). For instance, in the presence of het-
(Nam and Jin, 2021) following the energy trade perspective (Zhang
erogeneity, the SH test is efficient enough to handle the homogenous
et al., 2021), Pollution Halo and Haven hypothesis (Caetano et al.,
coefficient’ assumptions (Baltagi and Pesaran, 2007). The general for-
2022). Hence, this study covers the minerals and urbanization along
mula of this test is shown below:
with financialization, FDI and GDP effect on energy transition in ( )
developed and emerging economies, which needs further research. 1 1
ΔSH = (V)2(2h)− 12 + N − h (3.2) V
3. Materials and methods ( ) ( ) − 12 1
2h(S − h − 1 1 Δ 2 + N − 2h (3.3) 3.1. Data ASH = (V ) S + 1 V
This research investigates the dynamic association between mineral
where ΔSH and ΔASH report slope coefficient’ homogeneity in delta SH
markets, financial development, FDI, urbanization, renewable energy,
and delta SH (adjusted), respectively.
non-renewable energy, and economic growth with energy transition in
14 economies from 1990 to 2019. The time span depends upon the data 3.2.2. Unit root test
availability of study variables. The sample is further bifurcated into
This research has employed both 1st generation: Im, Pesaran, and
models: Model 1 and 2, illustrating the G-7 and E-7 economies,
Shin (IPS) (Im et al., 2003) and Augmented Dickey-Fuller (ADF) and 2nd
respectively, to compare the empirical outcomes. In this part, this
generation: cross-sectional ADF (Pesaran, 2003) and cross-sectional IPS
research elucidates the nature of the study variables and their potential
(Pesaran, 2007) unit root tests. The 2nd generation unit root tests are
relationship with the dependent variable. Supplementary material is
robust to CSD and Slope Heterogeneity (SH) coefficients. The general provided in Appendix A.
formula of the unit root test is indicated as follows:
Energy transition (the share of clean energy in the TPES: total pri- ∑ ∑ m m ΔT ¯ A δ δ
mary energy supply) (Nam and Jin, 2021) is retrieved from World Bank
it = δi + δiTit− 1 + δi t− 1 + ihΔT t− 1 +
ihΔTit− h + εit (3.4) h=0 h=1
(WDI). The data on the mineral markets (minerals export trading share,
The equation mentioned above shows the difference and lag values
expected direction ∂ET > 0) (Jiskani et al., 2021) is collected from World as ΔT ∂MM
t− 1 and Tt− 1, respectively. Hence, the statistics of the cross-
Integrated Trade Solution (WITS), whilst financial development data
sectional IPS unit root test are reported below:
(financial access, depth, and efficiency of financial markets and in- / ∑
stitutions, expected direction ∂ET < 0) (Baloch et al., 2021) is gathered m ∂FD CIPS = 1 V CADFi (3.5)
from International Monitoring Fund (IMF). The IMF i=1 ’s financial devel-
opment ranges from 0 to 1. This dataset provides a multi-dimensional
In Eq. (3.5), CADF denotes cross-sectional ADF as shown in Eq. (3.4)
measure and broader coverage for financial sector development using and H
eight different indicators. More so, the data of FDI (net inflow of in-
0 state the non-stationarity of the data.
vestments, expected direction ∂ET > 0) (Caetano et al., 2022), urbani- ∂FDI
3.2.3. Cointegration test
zation (population in urban areas, expected direction ∂ET > 0) (Yao and
To estimate the long-run cointegration among study variables, this ∂URB
Tang, 2021), renewable energy (share of total energy, expected direc-
study employed both 1st generation: Kao (Kao, 1999) and Pedroni
tion ∂ET > 0), non-renewable energy (share of fossil fuels-based energy,
(Pedroni, 2004) and 2nd generation: Westerlund bootstrap (Westerlund, ∂RE
expected direction ∂ET < 0) and economic growth (per capita GDP,
2007)16 based on error correction (EC), cointegration tests. The general ∂NRE expected direction
form of cointegration test is as follows:
∂ET > 0) is aggrandized from WDI, as reported in ∂GDP
Table 1. The table further clarifies the variable’s name, symbol, source,
Pt = δ/SE(δ) (3.6)
and measurement unit. The FDI and GDP are transformed into loga-
rithmic forms to present better outcomes.
Pa = t(δ) (3.7)
To assess the short and long-run outcomes, this study employs a /
cross-sectional ARDL technique (Chudik and Pesaran, 2015). The model ∑v δi
of this study is presented below. Gt = 1 V (3.8)
i− 1SE(δi)
ETit = ρ + ρ MM FD FDI URB RE O 1
it + ρ2
it + ρ3
it + ρ4
it + ρ5 it (3.1) + ρ NRE GDP 6
it + ρ7
it + εit
15 This test is capable of handling the shocks in developed and emerging
ρO shows the slope, ρ1 to ρ7 are coefficients of explanatory variables, economies (Pesaran, 2004).
whilst εit denotes the residuals. i indicates the time period (from 1990 to
16 Compared with 1st generation cointegration tests such as Kao and Pedro-
2019), whereas t reports the cross-sections (14 developed and emerging
ni’s, the Westerlund bootstrap test is robust with error coefficients of SH (Khan
countries). This research illustrates the distributions of the energy et al., 2020). 10 M. Irfan et Energy Economics al. 121 (2023) 106661 /
Kao and Pedroni cointegration tests as in Table 7. The results of these ∑v Sδ G i
tests validate the presence of long-term connections in the hypothesized a = 1 V (3.9) i− 1δi(1)
variables by rejecting the H0 of no cointegration. Eqs. (3.6) and (3.7) of P
To overcome the issues of CSD and slope heterogeneity, this study
t and Pa explore panel while Eqs. (3.8) and (3.9) of G
further applies the 2nd generation panel cointegration test, for instance,
t and Ga illustrate group means statistics, where H0 is of no cointegration.
bootstrap Westerlund as recorded in Table 8. Following the findings of
the Westerlund test, both panel (Pt and Pa) and group (Gt and Ga) mean
3.2.4. CS-ARDL modeling
statistics, cointegration is recommended by rejecting the H0 of no
This study applies cross-sectional ARDL for long and short-run esti-
cointegration. Consequently, the panel data variables are significantly
mations (Chudik and Pesaran, 2015). This approach is more robust to
interlinked. With this robust cointegration, two conditions: connection
endogeneity, CSD, SH coefficients, unobserved common factors17, and
is not spurious, and coefficients are valuable for estimations are met.
non-stationarity18 (Danish, 2019; Khan et al., 2020). The universal form
Furthermore, to overview the study, variables including energy transi-
of CS-ARDL is presented below:
tion, minerals, financial development, FDI, urbanization, and renewable
energy are explored by circular plots, as shown in Fig. 4. These unique ∑ ∑ ∑ m m 3 ET
plots present a comprehensive picture of key variables as shown in the it = α0 + λitETit− r + β Pt− r + Vt− r + εit (3.10) r=1 r=0 it r=0
legend of the graphs. The dark color of the variables represents more where V magnitude.
t = (ΔETit, Pt’)’ and Pit = (MMit, FMit, FDIit, URBit, REit, NREit, GDP
The outcomes of Model 1 in Table 9 explain the results, which infer
it)’, P is the pool of explanatory variables, for instance, minerals,
financial development, FDI, urbanization, clean energy, non-renewable
that the minerals are positively significant with the coefficients of 0.352 energy, and GDP.
and 0.356; it represents that a 1% surge in minerals can cause a 0.35%
increase in the energy transition in both the short and long run. These
4. Results and discussion
results reveal that mineral resources contribute to the sustainable
objective in developed nations. These outcomes are supported by the
Table 2 reports the summary statistics of the study variables for both
extant studies (Jiskani et al., 2022; Lebre et al., 2020; Ulucak, 2020).
models. It is shown that the mean of energy transition and minerals is
The findings of Model 2 state that MM also has a direct connection with
higher in E-7 countries; however, the volatility of these variables is
energy transition but with a lower magnitude indicating inadequate
higher in developing countries. Table 2 reports that financial develop-
intentions of emerging nations toward mineral use to meet the demands
ment, FDI, and urbanization have more mean magnitude in Model 1,
of clean energy. Traditional energy dependence seems to impede the
indicating advanced financial management. The statistics further indi-
energy transition. Though this appears to be an undesirable outcome, it
cate that the mean of cleaner and traditional energy is more favorable in
is indispensable to mention that the energy transition concerns the
developing nations indicating that they are focusing on sustainable
amount of energy produced. Fareed et al. (2022) argued that this in-
economic development. In the end, economic growth presents more
fluence might be expounded by the impact of advantage toward clean
obvious in Model 1. These descriptive statistics assert an idea about the
energy production. They suggests that renewable energy could benefit
characteristics of both models.
the economies to accomplish Agenda 2030, provided the energy tran-
Moreover, to examine the cross-sections of the study, CSD is esti-
sition is a sustainable opportunity. The findings of the study testify to the
mated using Breusch-Pagan and Pesaran CD CSD tests. The outcomes of
crucial role played by energy transition; indeed, given the statistic that
Table 3 report that CSD exists among the study variables by rejecting the
clean energy considerably refers to the addition in sustainable growth. H
In the case of financial development, short and long-run coefficients
0 of no CSD, which infers the interconnection among G-7 and E-7
economies illustrating global economic spillover effects, regional con-
are significant and negative, i.e., − 0.516 and − 0.491. It concludes that
nectivity, and globalization (Hasanov et al., 2021). The findings of slope
financial development in advanced economies desperately depends on
homogeneity (SH) are interpreted in Table 4, which elaborates the null
energy utilization and is less concerned about environmental goals. hypothesis (H
However, Table 9 inspects that the negative influence of financial
0 = SH exists among the series). The results of the test
confirm that heterogeneity exists among cross-section slope coefficients.
development is more dominant in emerging countries than in advanced
Fig. 3 describes the correlational plots for both models of this study.
ones indicating that developing nations ignore sustained commitments
These two-way graphs indicate the binary relationship among all the
and are more anxious about energy consumption, even at the expense of
study variables from 1990 to 2019.
atmospheric pollution. These outcomes are aligned with the current
The authors employed 1st and 2nd generations unit root tests to
studies (Acheampong et al., 2020; Xu et al., 2022). Financial develop-
probe the integration properties of the data. The four-panel unit root
ment seems to be a barrier to the energy transition. Though this seems an
tests’ highlights, which are employed in this article and aim to inspect
undesirable outcome, it is essential to consider that economic growth
the integration order of the series, are reported in Table 5. In the pres-
leads to the energy transition. However, when only considering financial
ence of heterogeneity and CSD, 2nd generation non-stationarity tests
development to the energy sector, ceteris paribus, FD reduces environ-
such as CIPS and CADF are endorsed (Fareed et al., 2022). Indeed, the
mental pollution in the long run and becomes favorable to the advanced
recorded findings confirm that most variables have a unit root at the nations. level (by accepting the H
Meanwhile, FDI has a positive and negative relationship with energy
0 of stationarity). Hence, the study variables are
stationary at the 1st difference I (1), which validates that the study
transition for Models 1 and 2. Although the results of FDI are insignifi-
variables are integrated of order one. In the current situation, the
cant: however, the positive magnitude denotes that FDI in developed
applicable onward move is to estimate the enduring association among
economies supports environmental quality following the Pollution Halo
study variables. This study employed Karavias and Tzavalis (2014)
effect, and these outcomes are supported by the current literature
panel unit root test to observe the structural break. Table 6 reports that
(Caetano et al., 2022; Hao et al., 2020). Contrarily, the Pollution Haven
variables of both Model 1 and 2 are stationary at the first difference I (1)
affects developing countries to bear a negative connection of FDI with
with one structural break in the series. Therefore, this research applies
energy transition in the long and short run. Foreign direct investment
increases energy transition in developed nations elucidating that these
economies are more concerned about sustainable growth. Specifically,
in the long run, the higher coefficient of FDI indicates that advanced
17 Ignoring unobserved common factors can lead to biased estimations.
economies are following the objectives of Agenda 2030 by promoting
18 Able to deal with stationarity with varied difference levels.
clean and efficient energy generation. Lastly, renewable energy 11 M. Irfan et Energy Economics al. 121 (2023) 106661
consumption has a significant and positive relation with energy transi-
source. However, deployment and investment in cleaner energy must
tion. These outcomes are supported by the extant literature (Vo et al.,
continue in the future. The government should promote the use of
2020). Opposite to RE, non-renewable energy’s coefficients are docu-
cleaner sources rather than restrict them. Investing in RE in developed
mented to be negatively significant in the long and short run for both the
nations today results in a possible replacement of fossil fuel revenues.
study models. Empirical outcomes of CS-ARDL describe that the
Additionally, increased investment in energy storage might lower the
magnitude of NRE is more rigorous in emerging nations than in devel-
carbon intensity while addressing intermittency challenges. The mining oped countries.
sector relies on and prioritizes risks for sustainable mining operations.
Moreover, urbanization positively influences energy transition in
Policymakers and mining sustainability focus groups should consider
both the long and short run for developed and developing economies.
formulating climate-smart and green mining policies and their pro-
The coefficients of urbanization claim that in the case of the long run, 1
spective repercussions (Jiskani et al., 2022). This paper evaluates the
unit rise in URBs increases energy transition by 0.426 and 0.521 units in
hazards that must be addressed in order of importance for socially
Models 1 and 2, respectively. The current studies further support these
acceptable and sustainable mining methods to provide green and
consequences (Lantz et al., 2021). Ultimately, economic growth explains
cleaner energy. The environmental deterioration is jeopardy to mineral
its positive and negative connection with Models 1 and 2. In developed
resources, leading to the threat of lessening natural resources. The
economies, GDP emphasizes green energy and technological innovation
resource conservation agenda can assist the cleaner production tech-
to impart its role in improving ecological quality, whilst emerging na-
niques and the latest technology to thwart enormous losses. In addition,
tions, in the same scenario, are not aware and responsive to sustainable
it receives benefits from financial services and economic insurance to
growth to curtail the pollution level to accomplish the carbon neutrality
reinstate the natural resource protection strategy. More so, the financial
targets. The study outcomes are also tested for robustness and re-
development of G-7 and E-7 economies restricts green development ef-
confirmation by employing AMG (Eberhardt, 2012) and CCEMG
ficiency. Therefore, three elements of financial development should be
(Pesaran, 2007) estimations, as reported in Table 10.
examined while evaluating financial reform (financial deepening,
financial efficiency, and financial size) (Yang and Ni, 2022). In devel-
5. Conclusions and policy implications
oping their financial size, economies should optimize the financial re-
sources’ allocation and guide the flow of funds to pollution-free and low-
The Conference of Parties’ (COP-26) objectives, considering the
emission firms. The industrial orientation of green finance development
cleaner energy and environmental challenges, provide significant pres-
should be taken into account, with policies of financial assistance for the
sure to expedite the shift to the energy transition. This research aims to
expansion of low-carbon firms and risk sharing for the technical inno-
scrutinize the dynamic impact of mineral markets and financial devel- vation of clean energy.
opment along with a pool of auxiliary variables: FDI, urbanization, clean
Lastly, governments should invest in cleaner energy sources for the
energy, non-renewable energy, and GDP on energy transition from 1990
national grid. Specialization of the energy sector is essential because the
to 2019. To forecast the characteristics of both developed and emerging
ensuing economies of scale and efficiency would cut marginal costs, and
countries, the sample is further bi-furcated in Models 1 and 2,
consequently energy prices, and increase FDI. It is vital to avoid respectively.
importing dirty energy; thus, governments should promote backup from
With the massive expansion of minerals mining worldwide, minerals-
clean energy sources, especially those with accumulation potential, such
intensive countries have faced a mess regarding minerals extraction,
as hydro. As this study focuses on the G-7 and E-7 economies and sug-
supply, and commercial dealings. The authors of this study have
gests policy instruments for cleaner energy, minerals, and financial
employed CS-ARDL to estimate the financialization of minerals and
development, the policy agenda might appear inconclusive. Indeed, the
energy nexus. This advanced approach is efficient enough to deal with
suggested policy framework may have been more multifaceted due to
CSD, endogeneity, non-stationarity, and heterogeneous slope co-
the G7 nations’ other growth-related considerations. Although broad-
efficients (Khan et al., 2020). The empirical findings of this study esti-
ening the topic’s scope may have included more growth drivers, the
mate that minerals significantly contribute to the energy transition
parameters were selected within the theoretical limitations of the study
process for both models to accomplish low-carbon power generation. In
challenges. Though the policy framework can be organized by consid-
the case of financial development, it encourages the negative direction
ering the other contexts of advanced and emerging countries, which may
with energy transition in the long- and short-run. FDI, renewable energy,
demand a policy revamp to address the environmental deterioration
and urbanization support sustainable goals, while non-renewable en-
challenges, there lies the generalizability of the study’s recommended
ergy is negatively related to the energy transition. Developed economies
policy outline. To offer policy recommendations from a precise
draw such economic and environmental policies that follow sustainable
perspective, further research might benefit from examining the
development goals. Statistics discover that the supply and demand for
comparative situation by considering the micro or sectoral-level
minerals have significantly increased due to low carbon-intensive goals research.
and a rising share of renewable energy for sustainable energy genera-
tion. These outcomes are robust with the AMG and CCEMG statistical
CRediT authorship contribution statement techniques.
The following policy implications and recommendations are pro-
Muhammad Irfan: Resources, Conceptualization, Data curation,
vided to empower the decision-making process for all the energy tran-
Validation, Formal analysis, Writing – original draft, Writing – review &
sition stakeholders, as they are sympathetic to escalating the
editing. Mubeen Abdur Rehman: Writing – original draft, Writing –
decarbonization of the energy sector in both developed and developing
review & editing, Investigation, Visualization. Asif Razzaq: Conceptu-
countries. The energy mix must immediately reduce its carbon con-
alization, Methodology, Writing – original draft, Writing – review &
centration to attain the carbon neutrality objective. According to the
editing. Yu Hao: Conceptualization, Methodology, Funding acquisition,
analysis, focusing on traditional fuels such as coal and oil mitigates the
Supervision, Writing – original draft, Writing – review & editing.
likelihood of attaining a climate-stabilized scenario on time. Establish-
ing a Carbon Neutral objective by 2050 and developing short- and long- Acknowledgments
run policies must be the next step in the broader social perspective and
transforming energy sector priorities on decarbonization (De La Pena
The authors acknowledge sponsorship from Science and Technology
et al., 2022). Eliminating coal-fired power plants is another crucial move
Program of Zhejiang Province of China (2022C35060), The Technology
in the right way in emerging economies. In the context of ongoing en-
Innovation Program of Beijing Institute of Technology (2022CX01013),
ergy security concerns, natural gas would be the preferred energy
and the Joint Development Program of the Beijing Municipal 12 M. Irfan et Energy Economics al. 121 (2023) 106661
Commission of Education. The authors are also very grateful to the
Fareed, Z., Rehman, M.A., Adebayo, T.S., Wang, Y., Ahmad, M., Shahzad, F., 2022.
anonymous reviewers and Editor-in-Chief Prof. Dr. Richard S.J. Tol for
Financial inclusion and the environmental deterioration in Eurozone: the
their insightful comments that helped us sufficiently improve the quality
moderating role of innovation activity. Technol. Soc. 69, 101961 https://doi.org/
10.1016/j.techsoc.2022.101961.
of this paper. The usual disclaimer applies.
Garai, A., Sarkar, B., 2022. Economically independent reverse logistics of customer-
centric closed-loop supply chain for herbal medicines and biofuel. J. Clean. Prod.
Appendix A. Supplementary data
334, 129977 https://doi.org/10.1016/j.jclepro.2021.129977.
Grossman, G.M., Krueger, A.B., 1995. Economic growth and the environment. Q. J. Econ.
110 (2), 353–377. https://doi.org/10.2307/2118443.
Supplementary data to this article can be found online at https://doi.
Gul, M., Ak, M.F., Guneri, A.F., 2019. Pythagorean fuzzy VIKOR-based approach for
org/10.1016/j.eneco.2023.106661.
safety risk assessment in mine industry. J. Saf. Res. 69, 135–153. https://doi.org/ 10.1016/j.jsr.2019.03.005.
Hao, Y., Guo, Y., Guo, Y., Wu, H., Ren, S., 2020. Does outward foreign direct investment References
(OFDI) affect the home country’s environmental quality? The case of China. Struct.
Chang. Econ. Dyn. 52, 109–119. https://doi.org/10.1016/j.strueco.2019.08.012.
Acheampong, A.O., Amponsah, M., Boateng, E., 2020. Does financial development
Hasanov, F.J., Khan, Z., Hussain, M., Tufail, M., 2021. Theoretical framework for the
mitigate carbon emissions? Evidence from heterogeneous financial economies.
carbon emissions effects of technological progress and renewable energy
Energy Econ. 88, 104768 https://doi.org/10.1016/j.eneco.2020.104768.
consumption. Sustain. Dev. 29 (5), 810–822. https://doi.org/10.1002/sd.2175.
Acheampong, A.O., Opoku, E.E.O., Dogah, K.E., 2023. The political economy of energy
Huang, Y., Chen, X., Zhu, H., Huang, C., Tian, Z., 2019. The heterogeneous effects of FDI
transition: the role of globalization and governance in the adoption of clean cooking
and foreign trade on CO2 emissions: evidence from China. Math. Probl. Eng. 2019
fuels and technologies. Technol. Forecast. Soc. Chang. 186, 122156. https://www.
https://doi.org/10.1155/2019/9612492.
sciencedirect.com/science/article/abs/pii/S0040162522006771.
Hund, K., La Porta, D., Fabregas, T.P., Laing, T., Drexhage, J., 2020. Minerals for climate
Al Mamun, M., Sohag, K., Shahbaz, M., Hammoudeh, S., 2018. Financial markets,
action: the mineral intensity of the clean energy transition. World Bank 73.
innovations and cleaner energy production in OECD countries. Energy Econ. 72,
Im, K.S., Pesaran, M.H., Shin, Y., 2003. Testing for unit roots in heterogeneous panels. 236
J. Econ. 115 (1), 53–74. https://doi.org/10.1016/S0304-4076(03)00092-7.
–254. https://doi.org/10.1016/j.eneco.2018.04.011.
Aldieri, L., Carlucci, F., Vinci, C.P., Yigitcanlar, T., 2019. Environmental innovation,
IMF, 2018. A Guide to Committees, Groups, and Clubs, 2018. https://www.imf.
knowledge spillovers and policy implications: a systematic review of the economic
org/en/About/Factsheets/A-Guide-to-Committees-Groups-and-Clubs#G7.
effects literature. J. Clean. Prod. 239, 118051 https://doi.org/10.1016/j.
Iphar, M., Cukurluoz, A.K., 2020. Fuzzy risk assessment for mechanized underground jclepro.2019.118051.
coal mines in Turkey. Int. J. Occup. Saf. Ergon. 26 (2), 256–271. https://doi.org/
Amoatey, C.T., Famiyeh, S., Andoh, P., 2017. Risk assessment of mining projects in
10.1080/10803548.2018.1426804.
Ghana. J. Qual. Maint. Eng. https://doi.org/10.1108/JQME-09-2015-0044.
Irfan, M., Chen, Z., Adebayo, T.S., Al-Faryan, M.A.S., 2022a. Socio-economic and
Aust, V., Morais, A.I., Pinto, I., 2020. How does foreign direct investment contribute to
technological drivers of sustainability and resources management: demonstrating
sustainable development goals? Evidence from African countries. J. Clean. Prod.
the role of information and communications technology and financial development
245, 118823 https://doi.org/10.1016/j.jclepro.2019.118823.
using advanced wavelet coherence approach. Res. Policy 79, 103038. https://www.
Baloch, M.A., Ozturk, I., Bekun, F.V., Khan, D., 2021. Modeling the dynamic linkage
sciencedirect.com/science/article/abs/pii/S0301420722004810.
between financial development, energy innovation, and environmental quality: does
Irfan, M., Rehman, M.A., Liu, X., Razzaq, A., 2022b. Interlinkages between mineral
globalization matter? Bus. Strateg. Environ. 30 (1), 176
resources, financial markets, and sustainable energy sources: evidence from minerals –184. https://doi.org/ 10.1002/bse.2615.
exporting countries. Res. Policy 103088. https://www.sciencedirect.com/scienc
Baltagi, B.H., Pesaran, H.M., 2007. Heterogeneity and cross section dependence in panel
e/article/abs/pii/S0301420722005311.
data models: theory and applications introduction. J. Appl. Econ. 22 (2), 229
Islam, M.M., Sohag, K., Hammoudeh, S., Mariev, O., Samargandi, N., 2022. Minerals –232.
https://doi.org/10.1002/jae.955.
import demands and clean energy transitions: a disaggregated analysis. Energy Econ.
Bond, K., 2018. 2020 Vision: Why you Should See Peak Fossil Fuels Coming. Carbon
113, 106205 https://doi.org/10.1016/j.eneco.2022.106205. Tracker Initiative.
Jiskani, I.M., Cai, Q., Zhou, W., Shah, S.A.A., 2021. Green and climate-smart mining: a
Boutabba, M.A., 2014. The impact of financial development, income, energy and trade
framework to analyze open-pit mines for cleaner mineral production. Res. Policy 71,
on carbon emissions: evidence from the Indian economy. Econ. Model. 40, 33
102007. https://doi.org/10.1016/j.resourpol.2021.102007. –41.
https://doi.org/10.1016/j.econmod.2014.03.005.
Jiskani, I.M., Cai, Q., Zhou, W., Lu, X., Shah, S.A.A., 2022. An integrated fuzzy decision
Caetano, R.V., Marques, A.C., Afonso, T.L., Vieira, I., 2022. A sectoral analysis of the role
support system for analyzing challenges and pathways to promote green and climate
of foreign direct investment in pollution and energy transition in OECD countries.
smart mining. Expert Syst. Appl. 188, 116062 https://doi.org/10.1016/j.
J. Environ. Manag. 302, 114018 https://doi.org/10.1016/j.jenvman.2021.114018. eswa.2021.116062.
Charfeddine, L., Kahia, M., 2019. Impact of renewable energy consumption and financial
Kao, C., 1999. Spurious regression and residual-based tests for cointegration in panel
development on CO2 emissions and economic growth in the MENA region: a panel
data. J. Econ. 90 (1), 1–44. https://doi.org/10.1016/S0304-4076(98)00023-2.
vector autoregressive (PVAR) analysis. Renew. Energy 139, 198
Karavias, Y., Tzavalis, E., 2014. Testing for unit roots in short panels allowing for a –213. https://doi.
org/10.1016/j.renene.2019.01.010.
structural break. Comp. Stat. Data Analys. 76, 391–407. https://doi.org/10.1016/j.
Chen, H., Rehman, M.A., Luo, J., Ali, M., 2022. Dynamic influence of natural resources, csda.2012.10.014.
financial integration and eco-innovation on ecological sustainability in EKC
Khan, M.T.I., Yaseen, M.R., Ali, Q., 2017. Dynamic relationship between financial
framework: fresh insights from China. Res. Policy 79, 103043. https://www.scienc
development, energy consumption, trade and greenhouse gas: comparison of upper
edirect.com/science/article/abs/pii/S030142072200486X.
middle income countries from Asia, Europe, Africa and America. J. Clean. Prod. 161,
Chinbat, U., Takakuwa, S., 2009, December. Using simulation analysis for mining project
567–580. https://doi.org/10.1016/j.jclepro.2017.05.129.
risk management. In: Proceedings of the 2009 Winter Simulation Conference (WSC).
Khan, M.K., Khan, M.I., Rehan, M., 2020. The relationship between energy consumption, IEEE, pp. 2612
economic growth and carbon dioxide emissions in Pakistan. Financ. Innov. 6 (1),
–2623. https://ieeexplore.ieee.org/document/5429647.
Chincarini, L.B., Moneta, F., 2021. The challenges of oil investing: Contango and the
1–13. https://doi.org/10.1186/s40854-019-0162-0.
financialization of commodities. Energy Econ. 102, 105443 https://doi.org/
Khan, I., Hou, F., Zakari, A., Irfan, M., Ahmad, M., 2022. Links among energy intensity, 10.1016/j.eneco.2021.105443.
non-linear financial development, and environmental sustainability: new evidence
Chudik, A., Pesaran, M.H., 2015. Common correlated effects estimation of heterogeneous
from Asia Pacific economic cooperation countries. J. Clean. Prod. 330, 129747. htt
dynamic panel data models with weakly exogenous regressors. J. Econ. 188 (2),
ps://www.sciencedirect.com/science/article/abs/pii/S0959652621039238. 393
Komendantova, N., 2021. Transferring awareness into action: a meta-analysis of the
–420. https://doi.org/10.1016/j.jeconom.2015.03.007.
Danish, 2019. Moving toward sustainable development: the relationship between water
behavioral drivers of energy transitions in Germany, Austria, Finland, Morocco,
productivity, natural resource rent, international trade, and carbon dioxide
Jordan and Iran. Energy Res. Soc. Sci. 71, 101826 https://doi.org/10.1016/j.
emissions. Sustain. Dev. 28, 540 erss.2020.101826.
–549. https://doi.org/10.1002/sd.2007.
Danish, Ulucak R., 2020. The pathway toward pollution mitigation: Does institutional
Lantz, T.L., Ioppolo, G., Yigitcanlar, T., Arbolino, R., 2021. Understanding the correlation
quality make a difference? Bus. Strateg. Environ. 29 (8), 3571
between energy transition and urbanization. Environmental Innovation and Societal –3583. https://doi. org/10.1002/bse.2597.
Transitions 40, 73–86. https://doi.org/10.1016/j.eist.2021.06.002.
De La Pena, L., Guo, R., Cao, X., Ni, X., Zhang, W., 2022. Accelerating the energy
Lebre, ´E., Stringer, M., Svobodova, K., Owen, J.R., Kemp, D., Cˆote, C., Valenta, R.K.,
transition to achieve carbon neutrality. Resour. Conserv. Recycl. 177, 105957
2020. The social and environmental complexities of extracting energy transition
https://doi.org/10.1016/j.resconrec.2021.105957.
metals. Nat. Commun. 11 (1), 1–8. https://doi.org/10.1038/s41467-020-18661-9.
Dogan, E., Chishti, M.Z., Alavijeh, N.K., Tzeremes, P., 2022. The roles of technology and
Lee, C.C., Wang, C.S., 2022. Financial development, technological innovation and energy
Kyoto protocol in energy transition towards COP26 targets: evidence from the novel
security: evidence from Chinese provincial experience. Energy Econ. 112, 106161
GMM-PVAR approach for G-7 countries. Technol. Forecast. Soc. Chang. 181,
https://doi.org/10.1016/j.eneco.2022.106161.
121756. https://www.sciencedirect.com/science/article/abs/pii/S0040162522002
Li, J., Zhang, X., Ali, S., Khan, Z., 2020. Eco-innovation and energy productivity: new 815.
determinants of renewable energy consumption. J. Environ. Manag. 271 (June),
Dubinski, J., 2013. Sustainable development of mining mineral resources. J. Sustain.
111028 https://doi.org/10.1016/j.jenvman.2020.111028. Min. 12 (1), 1
Liu, X., Razzaq, A., Shahzad, M., Irfan, M., 2022. Technological changes, financial
–6. https://doi.org/10.7424/jsm130102.
Eberhardt, M., 2012. Estimating panel time-series models with heterogeneous slopes.
development and ecological consequences: a comparative study of developed and Stata J. 12 (1), 61
developing economies. Technol. Forecast. Soc. Chang. 184, 122004. https://www.
–71. https://doi.org/10.1177/1536867X1201200105.
sciencedirect.com/science/article/abs/pii/S004016252200525X. 13 M. Irfan et Energy Economics al. 121 (2023) 106661
Loorbach, D., Frantzeskaki, N., Avelino, F., 2017. Sustainability transitions research:
Taskın, D., Vardar, G., Okan, B., 2020. Does renewable energy promote green economic
transforming science and practice for societal change. Annu. Rev. Environ. Resour.
growth in OECD countries? Sustain. Account. Manag. Pol. J. 11 (4), 771–798.
42 (1), 599–626. https://doi.org/10.1146/annurev-environ102014-021340.
https://doi.org/10.1108/SAMPJ-04-2019-0192.
Mumtaz, M.Z., Yoshino, N., 2021. Greenness index: IPO performance and portfolio
Tzeremes, P., Dogan, E., Alavijeh, N.K., 2023. Analyzing the nexus between energy
allocation. Res. Int. Bus. Financ. 57, 101398 https://doi.org/10.1016/j.
transition, environment and ICT: a step towards COP26 targets. J. Environ. Manag. ribaf.2021.101398.
326, 116598. https://www.sciencedirect.com/science/article/pii/S0301479
Nam, E., Jin, T., 2021. Mitigating carbon emissions by energy transition, energy 722021715.
efficiency, and electrification: difference between regulation indicators and
Ulucak, R., 2020. How do environmental technologies affect green growth? Evidence
empirical data. J. Clean. Prod. 300, 126962 https://doi.org/10.1016/j.
from BRICS economies. Sci. Total Environ. 712, 136504 https://doi.org/10.1016/j. jclepro.2021.126962. scitotenv.2020.136504.
Nasir, M.A., Ahmad, M., Ahmad, F., Wu, J., 2015. Financial and economic stability as
Ulucak, R., Khan, S.U.D., 2020. Determinants of the ecological footprint: role of
‘two sides of a coin’: non-crisis regime evidence from the UK based on VECM.
renewable energy, natural resources, and urbanization. Sustain. Cities Soc. 54,
J. Financ. Econ. Pol. https://doi.org/10.1108/JFEP-01-2015-0006.
101996 https://doi.org/10.1016/j.scs.2019.101996.
Ouyang, Y., Li, P., 2018. On the nexus of financial development, economic growth, and
Vo, D.H., Vo, A.T., Ho, C.M., Nguyen, H.M., 2020. The role of renewable energy,
energy consumption in China: new perspective from a GMM panel VAR approach.
alternative and nuclear energy in mitigating carbon emissions in the CPTPP
Energy Econ. 71, 238–252. https://doi.org/10.1016/j.eneco.2018.02.015.
countries. Renew. Energy 161, 278–292. https://doi.org/10.1016/j.
Ozturk, I., Acaravci, A., 2013. The long-run and causal analysis of energy, growth, renene.2020.07.093.
openness and financial development on carbon emissions in Turkey. Energy Econ.
Wang, Y., Zhi, Q., 2016. The role of green finance in environmental protection: two
36, 262–267. https://doi.org/10.1016/j.eneco.2012.08.025.
aspects of market mechanism and policies. Energy Procedia 104, 311–316. https://
Pao, H.T., Fu, H.C., 2013. The causal relationship between energy resources and
doi.org/10.1016/j.egypro.2016.12.053.
economic growth in Brazil. Energy Policy 61, 793–801. https://doi.org/10.1016/j.
Wang, Q., Li, S., Pisarenko, Z., 2020. Heterogeneous effects of energy efficiency, oil price, enpol.2013.06.113.
environmental pressure, R&D investment, and policy on renewable energy–evidence
Papadis, E., Tsatsaronis, G., 2020. Challenges in the decarbonization of the energy sector.
from the G20 countries. Energy 209, 118322. https://doi.org/10.1016/j.
Energy 205, 118025. https://doi.org/10.1016/j.energy.2020.118025. energy.2020.118322.
Pedroni, P., 2004. Panel cointegration: asymptotic and finite sample properties of pooled
Wang, W., Rehman, M.A., Fahad, S., 2022. The dynamic influence of renewable energy,
time series tests with an application to the PPP hypothesis. Econom. Theory 20,
trade openness, and industrialization on the sustainable environment in G-7
597–625. https://doi.org/10.1017/S0266466604203073.
economies. Renew. Energy 198, 484–491. https://www.sciencedirect.com/scienc
Pesaran, M.H., 2003. A Simple Panel Unit Root Test in the Presence of Cross Section
e/article/abs/pii/S0960148122012332.
Dependence, Cambridge Working Papers in Economics 0346. Faculty of Economics
WDI, T., 2021. World Development Indicators (DataBank).
(DAE), University of Cambridge.
Westerlund, J., 2007. Testing for error correction in panel data. Oxf. Bull. Econ. Stat. 69
Pesaran, M.H., 2004. General Diagnostic Tests for Cross-Sectional Dependence in Panels.
(6), 709–748. https://doi.org/10.1111/j.1468-0084.2007.00477.x.
University of Cambridge, Cambridge Working Papers in Economics, p. 435.
Xie, B., Rehman, M.A., Zhang, J., Yang, R., 2022. Does the financialization of natural
Pesaran, M.H., 2007. A simple panel unit root test in the presence of cross-section
resources lead toward sustainability? An application of advance panel granger non-
dependence. J. Appl. Econ. 22, 265–312. https://doi.org/10.1002/jae.951.
causality. Res. Policy 79, 102989. https://www.sciencedirect.com/science/artic
Rahman, M.M., Alam, K., 2021. Clean energy, population density, urbanization and le/abs/pii/S0301420722004329.
environmental pollution nexus: evidence from Bangladesh. Renew. Energy 172,
Xu, Y., Fan, X., Zhang, Z., Zhang, R., 2020. Trade liberalization and haze pollution:
1063–1072. https://doi.org/10.1016/j.renene.2021.03.103.
evidence from China. Ecol. Indic. 109, 105825 https://doi.org/10.1016/j.
Relva, S.G., da Silva, V.O., Gimenes, A.L.V., Udaeta, M.E.M., Ashworth, P., Peyerl, D., ecolind.2019.105825.
2021. Enhancing developing countries’ transition to a low-carbon electricity sector.
Xu, D., Sheraz, M., Hassan, A., Sinha, A., Ullah, S., 2022. Financial development,
Energy 220, 119659. https://doi.org/10.1016/j.energy.2020.119659.
renewable energy and CO2 emission in G7 countries: new evidence from non-linear
Sadorsky, P., 2010. The impact of financial development on energy consumption in
and asymmetric analysis. Energy Econ. 109, 105994 https://doi.org/10.1016/j.
emerging economies. Energy Policy 38 (5), 2528–2535. https://doi.org/10.1016/j. eneco.2022.105994. enpol.2009.12.048.
Yang, L., Ni, M., 2022. Is financial development beneficial to improve the efficiency of
Sarkar, B., Debnath, A., Chiu, A.S., Ahmed, W., 2022. Circular economy-driven two-stage
green development? Evidence from the “belt and road” countries. Energy Econ. 105,
supply chain management for nullifying waste. J. Clean. Prod. 339, 130513 https://
105734 https://doi.org/10.1016/j.eneco.2021.105734.
doi.org/10.1016/j.jclepro.2022.130513.
Yao, X., Tang, X., 2021. Does financial structure affect CO2 emissions? Evidence from
Shahbaz, M., Mutascu, M., Azim, P., 2013. Environmental Kuznets curve in Romania and
G20 countries. Financ. Res. Lett. 41, 101791 https://doi.org/10.1016/j.
the role of energy consumption. Renew. Sust. Energ. Rev. 18, 165–173. https://doi. frl.2020.101791.
org/10.1016/j.rser.2012.10.012.
Zafar, M.W., Qin, Q., Zaidi, S.A.H., 2020. Foreign direct investment and education as
Shahbaz, M., Nasir, M.A., Roubaud, D., 2018. Environmental degradation in France: the
determinants of environmental quality: the importance of post Paris agreement
effects of FDI, financial development, and energy innovations. Energy Econ. 74,
(COP21). J. Environ. Manag. 270, 110827 https://doi.org/10.1016/j.
843–857. https://doi.org/10.1016/j.eneco.2018.07.020. jenvman.2020.110827.
Singhania, M., Saini, N., 2021. Demystifying pollution haven hypothesis: role of FDI.
Zerbib, O.D., 2019. The effect of pro-environmental preferences on bond prices: evidence
J. Bus. Res. 123, 516–528. https://doi.org/10.1016/j.jbusres.2020.10.007.
from green bonds. J. Bank. Financ. 98, 39–60. https://doi.org/10.1016/j.
Smil, V., 2016. Examining energy transitions: a dozen insights based on performance. jbankfin.2018.10.012.
Energy Res. Soc. Sci. 22, 194–197. https://doi.org/10.1016/j.erss.2016.08.017.
Zhang, Y.J., 2011. The impact of financial development on carbon emissions: an
Sovacool, B.K., 2016. How long will it take? Conceptualizing the temporal dynamics of
empirical analysis in China. Energy Policy 39 (4), 2197–2203. https://doi.org/
energy transitions. Energy Res. Soc. Sci. 13, 202–215. https://doi.org/10.1016/j. 10.1016/j.enpol.2011.02.026. erss.2015.12.020.
Zhang, M., Zhang, S., Lee, C.C., Zhou, D., 2021. Effects of trade openness on renewable
Stern, N., 2007. Stern Review on the Economics of Climate Change. Available at: https://
energy consumption in OECD countries: new insights from panel smooth transition
webarchive.nationalarchives.gov.uk/20100407172811/http://www.hm-treasury.
regression modelling. Energy Econ. 104, 105649 https://doi.org/10.1016/j.
gov.uk/stern_review_report.htm. eneco.2021.105649.
Suitner, J., Ecker, M., 2020. "Making energy transition work": bricolage in Austrian
Zhu, X., Ding, Q., Chen, J., 2022. How does critical mineral trade pattern affect
regions’ path-creation. Environmental Innovation and Societal Transitions 36,
renewable energy development? The mediating role of renewable energy
209–220. https://doi.org/10.1016/j.eist.2020.07.005.
technological progress. Energy Econ. 112, 106164 https://doi.org/10.1016/j. eneco.2022.106164. 14
Document Outline
- What derives renewable energy transition in G-7 and E-7 countries? The role of financial development and mineral markets
- 1 Introduction
- 2 Literature review and theoretical framework
- 2.1 Literature review
- 2.2 Theoretical framework
- 3 Materials and methods
- 3.1 Data
- 3.2 Econometric modeling
- 3.2.1 CSD and slope heterogeneity tests
- 3.2.2 Unit root test
- 3.2.3 Cointegration test
- 3.2.4 CS-ARDL modeling
- 4 Results and discussion
- 5 Conclusions and policy implications
- CRediT authorship contribution statement
- Acknowledgments
- Appendix A Supplementary data
- References