Biến động cô hóa học Marketing - Tài liệu tham khảo | Đại học Hoa Sen
Biến động cô hóa học Marketing - Tài liệu tham khảo | Đại học Hoa Sen và thông tin bổ ích giúp sinh viên tham khảo, ôn luyện và phục vụ nhu cầu học tập của mình cụ thể là có định hướng, ôn tập, nắm vững kiến thức môn học và làm bài tốt trong những bài kiểm tra, bài tiểu luận, bài tập kết thúc học phần, từ đó học tập tốt và có kết quả
Môn: Nghiên cứu Marketing (MKT20001) 22 tài liệu
Trường: Trường Đại học Hoa Sen 5.3 K tài liệu
Tác giả:


Preview text:
Accepted Manuscript
Visual analytics for event detection: Focusing on fraud
Roger Almeida Leite, Theresia Gschwandtner, Silvia Miksch,
Erich Gstrein, Johannes Kuntner PII: S2468-502X(18)30054-8 DOI:
https://doi.org/10.1016/j.visinf.2018.11.001 Reference: VISINF 33 To appear in: Visual Informatics
Received date : 5 November 2018
Accepted date : 27 November 2018
Please cite this article as: R.A. Leite, T. Gschwandtner, S. Miksch et al., Visual analytics for event
detection: Focusing on fraud. Visual Informatics (2018),
https://doi.org/10.1016/j.visinf.2018.11.001
This is a PDF file of an unedited manuscript that has been accepted for publication. As a service to
our customers we are providing this early version of the manuscript. The manuscript will undergo
copyediting, typesetting, and review of the resulting proof before it is published in its final form.
Please note that during the production process errors may be discovered which could affect the
content, and all legal disclaimers that apply to the journal pertain.
Visual Analytics for Event Detection: Focusing on Fraud
Roger Almeida Leite1, Theresia Gschwandtner1, Silvia Miksch1,
Erich Gstrein2, & Johannes Kuntner3
1 Vienna University of Technology, Austria
2 s IT Solutions AT Spardat GmbH, Austria
3 Erste Group IT International, Austria Abstract
The detection of anomalous events in huge amounts of data is sought in many
domains. For instance, in the context of financial data, the detection of sus-
picious events is a prerequisite to identify and prevent attempts to defraud.
Hence, various financial fraud detection approaches have started to exploit
Visual Analytics techniques. However, there is no study available giving
a systematic outline of the different approaches in this field to understand
common strategies but also differences. Thus, we present a survey of exist-
ing approaches of visual fraud detection in order to classify different tasks
and solutions, to identify and to propose further research opportunities. In
this work, fraud detection solutions are explored through five main domains:
banks, the stock market, telecommunication companies, insurance compa-
nies, and internal frauds. The selected domains explored in this survey were
chosen for sharing similar time-oriented and multivariate data characteris-
tics. In this survey, we (1) analyze the current state of the art in this field;
(2) define a categorization scheme covering different application domains, vi-
sualization methods, interaction techniques, and analytical methods which
are used in the context of fraud detection; (3) describe and discuss each ap-
proach according to the proposed scheme; and (4) identify challenges and future research topics. Keywords:
Visual Knowledge Discovery, Time Series Data, Business and
Finance Visualization, Financial Fraud Detection.
Preprint submitted to Nuclear Physics B November 5, 2018 1. Introduction
The detection of events is an important task in many domains such as
detecting interesting changes in stock markets, detecting problems in health
parameters, or detecting financial fraud. Analyzing these events in a tem-
poral context fosters further insights such as frequency, trends, and changes.
While event detection is aimed at identifying any type of event (not necessar-
ily anomalous events), outlier detection focuses on patterns and samples that
do not conform to expected behaviour, i.e. anomalies or outliers (CBK09).
Once an event is identified it can be classified, which is usually done in a
domain-specific way. In the case of fraud detection, we are interested in
events that could be classified as fraud. For instance, the purchase of a car
might cause the transaction of a high amount of money that is unusual for
the respective bank account, and thus, it might be classified as an outlier
transaction. Such transactions of high amounts of money require special
attention before being executed in order to avoid fraudulent schemes such
as hackers trying to use someones credit card for their own benefit. How-
ever, not every fraudulent event can be classified as an outlier, sometimes
attacks are hidden in known patterns in order to avoid detection by simple
rule-based approaches. The well renowned Oxford Dictionary defines fraud
as “wrongful or criminal deception intended to result in financial or personal
gain” 1. However, in this survey we focus on fraudulent events of different
applications domains that have direct financial impact on a person or an
institution, and all data necessary to identify this fraud is electronically pro-
cessed. Hence, we do not address types of fraud and data that are not directly
related to financial loss such as malicious events identified in unstructured
text or malware traffic in system networks, which are largely covered in other surveys (WSJ*14; 20115).
The domains we consider in this survey share similar data characteris-
tics. For example, monitoring calls, stocks, bank transactions, as well as
employees are tasks that involve data with multivariate and time-oriented
aspects. Both aspects require sophisticated exploration techniques and, by
consequence, are subject of interest to the Visual Analytics (VA) community.
In addition, Kielman et al. (KTM09) describe fraud detection as an open VA
problem that requires visual exploration, discovery, and analysis. However,
1 http://www.oxforddictionaries.com/definition/english/fraud (accessed January 4, 2017) 2
many of the current solutions involve mainly data mining techniques. VA ap-
proaches have the potential to improve these solutions by integrating human
analysis into the process by means of visual representations and interaction
techniques (KMS*08). Despite that, VA approaches are barely explored in the field of fraud detection.
Besides its challenging nature, visual fraud event detection has also a
strong social and financial importance. For instance, fraudulent schemes
such as ‘money laundering’, or ‘straw person’ should be detected and fought
as fast as possible by financial systems. Governments, banks, and other fi-
nancial institutions that provide credit and money transaction services are
always interested in improving operation monitoring and fraud detection.
Software environments handling sensitive data such as financial operation
management systems, systems for insurance evaluation, or companies’ inter-
nal control systems, need to be in constant evaluation to detect ever-changing
fraudulent attempts, to provide risk management, and, thus, to avoid catas- trophic consequences.
In this article, we present a survey of existing visualization techniques
used for fraud detection in different application domains. We describe and
discuss each approach according to our categorization scheme, covering appli-
cation domains, visualization methods, utilized interaction techniques, and
analytical methods. Finally, we elaborate on the benefits and shortcomings of
these approaches and identify open challenges and future research directions. 2. Literature Research
The scope of our literature research was defined by these three instances:
keywords, time period, and publication media and databases. We used the
following attributes and databases to search for relevant work:
Keywords used in the search were: “fraud visualization”, “visual analyt-
ics”, “visualization”, “visual mining”, “information visualization”.
Time period. The definition of the time range was set to the period from 1997 to the year of 2018.
Publication media and databases that were used: IEEE TVCG, VIS,
VizSec, EuroVis, PacificVIS, Information Visualization (published by
SAGE), Computer & Graphics (published by Elsevier), EuroVA, ABI 3
Database, Academic Search Premier, ACM, Business Source Premier, Emerald Full text Science.
Aiming for a better understanding of the fraud detection scenario, we
did not only include papers which follow a pure VA approach in this sur-
vey. We also included articles from target application domains which utilize
visualization techniques as part of their solution. 2.1. Data, User, and Tasks
In this section, we define our survey target studies with respect to the data, users, and tasks (MA14).
Data. All selected approaches tackle multivariate and time-oriented aspects in their data set(s).
User. The actual users of the selected approaches vary with the application
domain, but they share similar tasks. With ’user’ we refer to the person
who is in charge of identifying fraudulent attempts within multivariate
time-oriented data. Possible users are: investigators (CLG*08), mar-
ket makers (KSH*99), business users (HXD03), analysts (DLMP11; HLN09), and others.
Task. The common task is to identify fraudulent events within multivariate
time-oriented data. Subsequent tasks depend on the application do-
main and may include stopping the fraudulent behaviour in order to avoid future financial damage. 2.2. Contributions
In our survey, we intend to guide and motivate future research in the field
of event detection. Our main contributions are:
• a classification of existing approaches with respect to application do-
mains, visualization methods, interaction techniques, and analytical method;
• a brief presentation of each approach;
• a comparative assessment of these approaches;
• the identification of open challenges and possible future research direc- tions in the field; 4 3. Related Work
Temporal event detection is a vast subject. It is relevant in different fields,
such as: biology, security, finances, sales, social networks, and disease moni-
toring. One recent example is the survey provided by Atefeh, et al. (AK13)
that presents techniques for event detection from Twitter streams. The au-
thors discuss the problem of analyzing Twitter content, and they classify
the existent techniques by event type, detection task, and detection method.
Guided by text stream visualizations, another example of an event detection survey is presented by ˇ
Silic, et al. (SB10). In this article, a new aspects of
method comparison by data type, text representation, and temporal drawing approach are presented.
In 2002, Bolton and Hand (RJB02) published a review about fraud de-
tection approaches. They described the available tools for statistical fraud
detection and identified the most used technologies in four areas of fraud de-
tection: credit card fraud, money laundering, telecommunication fraud, and
computer intrusion. In the same sense, Kou, et al. (KLSH04) presented a sur-
vey about techniques for identifying the same types of fraud as in (RJB02).
The techniques are classified according to the different fraud detection types.
Some of the techniques described are: outlier detection, neural networks, ex-
pert systems, model-based reasoning, data mining, state transition analysis, and information visualization.
Surveys that focus specifically on data mining techniques for fraud de-
tection research were conducted, for instance, by Ngai, et al. (NHW*11),
who presents a classification scheme for data mining techniques. Phua, et al.
(PLSG10) formalizes the main types and subtypes of known fraud. Sharma
et al. (SP13) not only classify data mining techniques, but also propose a
framework for fraud detection data mining techniques. The survey presented
by Sithic, et al. (SB13) is focused on using data mining for insurance fraud detection.
When looking on surveys of visual approaches for fraud detection, we
identified FinanceVis (DML14) which is a browser for searching papers re-
lated to financial data visualization. More than 85 papers are integrated in
the browser 2. “Data visualization for fraud detection”, by Dilla, et al. (DR15),
is perhaps the most recent work that tackles fraud detection with VA. This
paper presents a theoretical framework to predict when and how the analysts
2 http://financevis.net (accessed February 4, 2016) 5
should apply VA techniques. They evaluated various visualization techniques
and concluded that different visualizations support different cognitive pro-
cesses. In addition, the authors also suggest future challenges for this research area.
Ko et al. (KCA*16) presented a survey of visualizations and VA ap-
proaches for exploring financial data in general. Financial data experts were
interviewed concerning their preferences of data sources, automated tech-
niques, visualizations, and interaction methods. Despite presenting many
event detection works, this survey does not cover any fraud detection ap-
proach. The main goal of this survey is to support researchers with designing
better systems to reach dedicated goals.
In summary, the existing surveys do not tackle our overall visions and
needs: On the one hand, they are mainly data mining-oriented and utilize
visualization only as visual aid for input and output data. On the other hand,
the more visualization-oriented surveys among them are very general from
the application point view, and neglect the specific characteristics of temporal
event detection. Finally, despite focusing on event detection, the text and
Twitter-oriented surveys focus on totally different data types, namely text,
documents, and document collections. In contrast to that, our survey is
oriented towards the particular nature and characteristics of financial fraud
event detection in multivariate time-oriented data. The main propose of
our survey is to analyze financial fraud detection in application domains
with similar characteristics (e.g., insurance data registers, bank transactions,
telecommunication companies, stock market logs, and companies’ internal
systems), which was not tackled yet. 4. Categorization Scheme
Based on the “Visual Analytics: Definition, Process and Challenges”
book (KAF*08) we categorize the existing work with respect to three as-
pects: supported application domains, visualization methods, and interac-
tion techniques. The classification of fraud detection papers based on their
main application domains facilitates future comparisons and trends in the
fraud detection area. Methods that represent data visually are one of the
core proposes of the VA area (MA14). As a consequence, we also classify the
found approaches with respect to the chosen visualizations. One of the core
aspects of VA is the combination of visualization and human factors. Thus,
by classifying interaction techniques we support a better understanding of 6
how analysts interactively explore the data to gain insights about fraudulent events.
4.1. Supported Application Domains
We characterize the identified application domains together with their specific tasks.
Telecommunication fraud detection. Although the percentage of
fraudulent mobile usage is small with respect to the omnipresence of mo-
bile telecommunication, the costs of these frauds are significant. There are
different types of telecommunication fraud that cause enormous harm. For
instance, cloned chips not only cause financial injury for the company, but
also considerately harms the reputation of the company since the company
could not keep the information of clients safe. In this respect, the domains of
telecommunication, financial health, and public health are of similar nature.
Stock Market fraud detection. Stock market, or sharing market,
is the network of economic transactions made by sellers and buyers con-
cerning shares of the ownership of companies. NASDAQ (NAS) is a well
known example of a stock market. Frauds such as late-trade report, anti
market integrity behavior, and best execution beat are described by Kirk-
land et al. (KSH*99). Not only well defined frauds were considered in this
work. New pattern recognition and pattern changes can also lead to the
identification of suspicious behavior. Therefore, they also included solutions involving pattern detection.
Insurance fraud detection. Fraudulent acts in the insurance sector
usually include a malicious analyst who simulates some damage, alternates
data, or conducts any other kind of fraud. However, the identification of such
acts is a hard task, tackled only by a small number of approaches.
Bank fraud detection. Financial management systems need to be in
constant evaluation to avoid frauds and to provide risk limitation. Fraudulent
schemes such as ‘money laundering‘, or ‘straw persons‘ must be identified
and fought as fast as possible. Thus, banks, and other financial institutions
that provide credit and money transaction services have a strong interest in
improving operation monitoring and fraud detection systems.
Internal fraud detection. Securing and protecting information is a
critical task within companies. To sell or edit confidential data from compa-
nies usually causes severe damage. Also know as “occupational fraud”, this
type of fraud results not only in straight economic loss, but also harms the 7
reputation of the company among employees, clients, and financial institu-
tions. When it comes to companies internal access violation, identifying the
person who committed the fraud is difficult, since these frauds could also
be committed by people who do not belong to the company (e.g., crackers).
However, in most cases, it is done by an insider employee. These internal
attacks can occur by an employee that has privileged credential access, an
employee that has access to someone else’s credential, or an employee who hacks the system. 4.2. Visualization Methods
Visualization techniques take advantage of the human perception system
and allow analysts to more easily derive insights about data. For instance,
instead of exhaustively looking into tables to identify data characteristics, an
analyst is able to see, explore, and understand a large amount of information
by using visualization techniques. However, the efficiency of these techniques
varies with respect to different tasks. The following list of visualization tech-
niques are used in the identified fraud detection approaches:
Line plots. One of the most popular visual representations - line plots
- are graphs that displays numerical values along continuous dimensions by
using lines. For instance, in Figure 4 (C) each line represents transactions
clustered by keyword variations and shows the sum of the respective trans-
actions’ amounts (y-axis) during a certain period of time (x-axis). Line plots
well suited for the detection of outliers and to analyze periodic patterns and
similarities. Special attention has to be paid to the handling of missing val-
ues, to not lead to wrong impressions.
Node-link Diagrams. These diagrams illustrate relations (represented
by links) between entities (represented by nodes). The same network, can
be represented by different layouts. Some of them are: forced-based layout,
spectral layout, layered graph drawing, arc diagrams, circular layout, and
dominance drawing. The goal of this technique is to facilitate the under-
standing of systems and networks by representing usability, costs, flows, and
connections. However, data sets that change over the time are hard to rep-
resent due to the constant deletion and creation of nodes and links that the
technique would impose in some cases. A node-link diagram can be seen in Figure 1, and in Figure 4 (D).
Bar charts. Rectangles (bars) are used to represent different entities,
where the height or the width encode quantitative values. For example, in
Figure 2 (F), we have an example of stacked bar charts that is being utilized 8
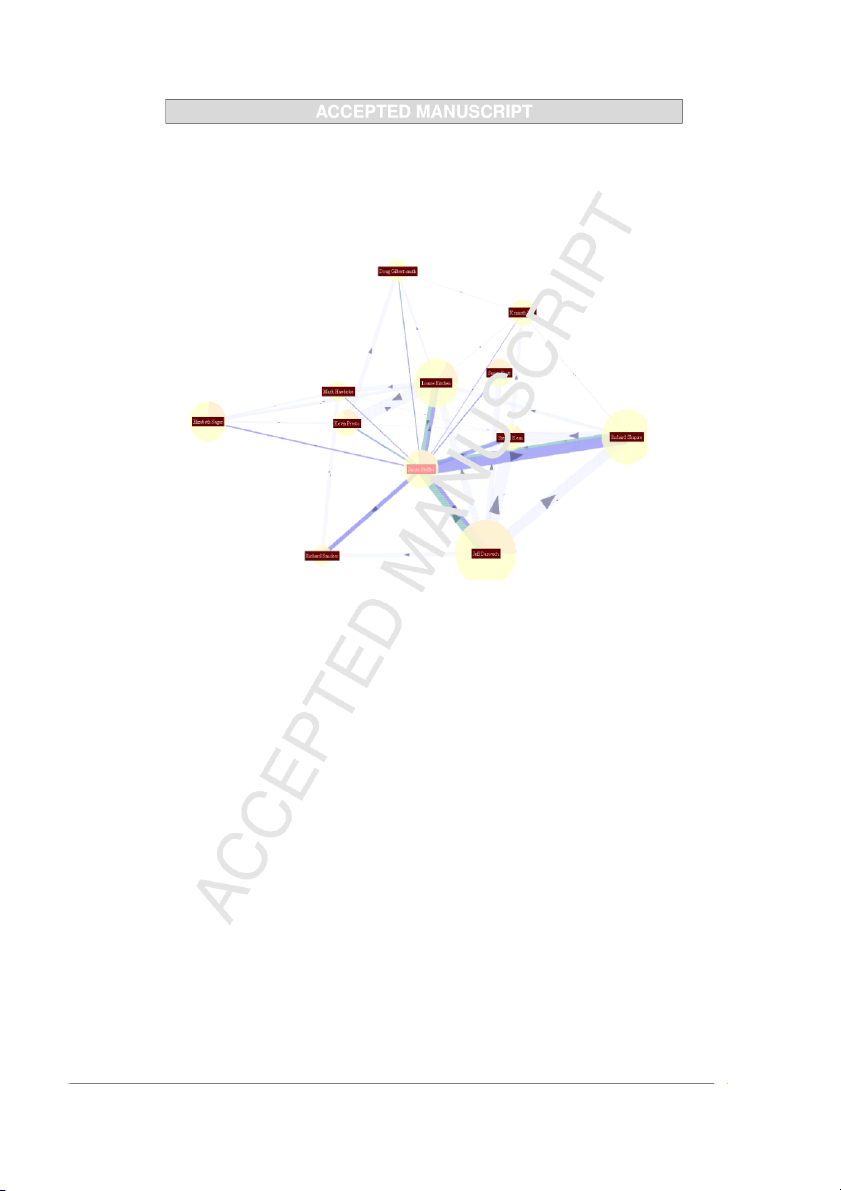
Figure 1: This node-link diagram from (HLN09) represents a trading pattern network.
Each node is a trader and each edge encodes a trading relationship.
for ranking. This visualization technique is well suited to represent relative
differences. There are different types of bar charts such as horizontal bar
charts, stacked bar charts, and range bar charts that were classified equally in this category.
Scatter plots. These are graphs where each sample is represented by a
point or symbol. Each point or symbol position is defined according to two
dimensions, or two generated features of these samples. Those graphs are
useful to illustrate trends and correlations.
Pixel-oriented Diagrams. These visualizations are well suited for the
exploration and analysis of massive data sets. The main idea is to map data
objects to pixels in order to be able to represent as many samples as the
screen resolution allows (K*00). One example can be seen in Figure 3 (B),
each pixel encodes a sample, representing data from a period of 5 years being 9
represented in the same visualization. However, a data item is not limited
to be represented by one pixel, for instance if you zoom in the pixel-oriented
diagram. This technique is usually used to highlight data clusters, patterns,
and outliers. This type of visualization is sensitive to the chosen color palette.
Tree Maps. By using nested rectangles, this technique visualizes hier-
archical data. In fraud detection, this visualization technique is mainly used
to represent ranking relationships and to categorize ’normal’ and ’suspicious’ cases.
Heat Maps. This graphical representation represents values by colors.
In fraud detection this technique is usually used to visually query for patterns
or outliers in a large amount of data. One example of this technique can be seen in Figure 4 (A).
Radar Charts. The idea of radar charts is to display multiple related
dimensions in a radial visualization. This allows the analyst to compare
quantities. Radar charts can also be used to represent periodical events, as
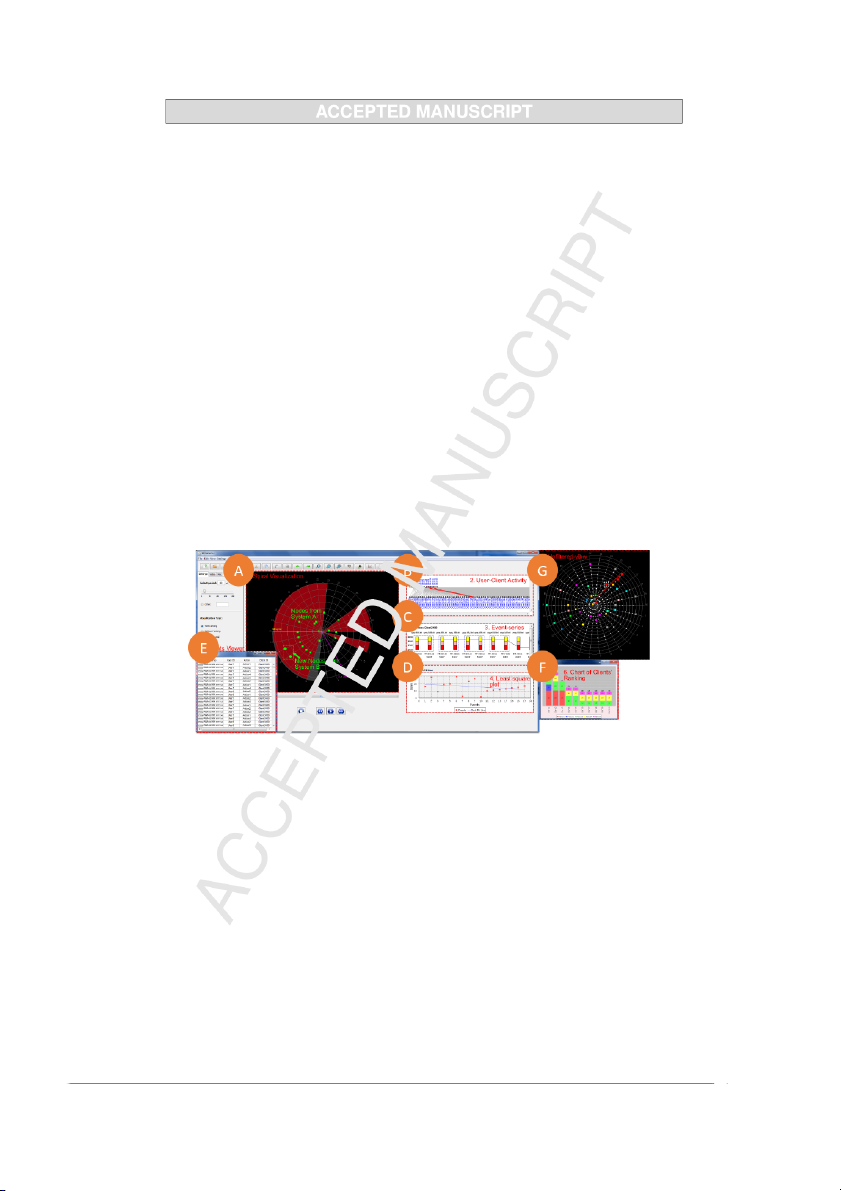
can be seen in Figure 2 (A) and Figure 2 (G). Figure 2:
This is a visualization for internal data analysis proposed by (ASS13).
(A) and (G) are radar charts that display periodical patterns. Each spiral represents
a month. (B) displays the user-client activities while (C) shows the event times. A mix-
ture of scatter plot and line plot is presented in (D) to determine relations between days
of the month and events. View (E) displays raw data, and view (F) shows a stacked bar
chart that ranks clients based on the sum of predefined factors.
Parallel Coordinates. This technique uses a similar concept as Radar
Charts to display multiple dimensions. However, here the dimensions are 10
laid out side-by-side, and not in a radial format. Unlike radar charts, parallel
coordinates are not used to display time.
Box Plots. This technique is used to represent and analyze features of
groups of samples. Box Plots represent the median, upper quartiles, and
lower quartiles by rectangles. They can also be extended to indicate vari-
ability trough vertical lines that extend the rectangle box. Box Plots are
often used to identify outliers, that are usually represented as dots outside
the boxes, or the vertical lines.
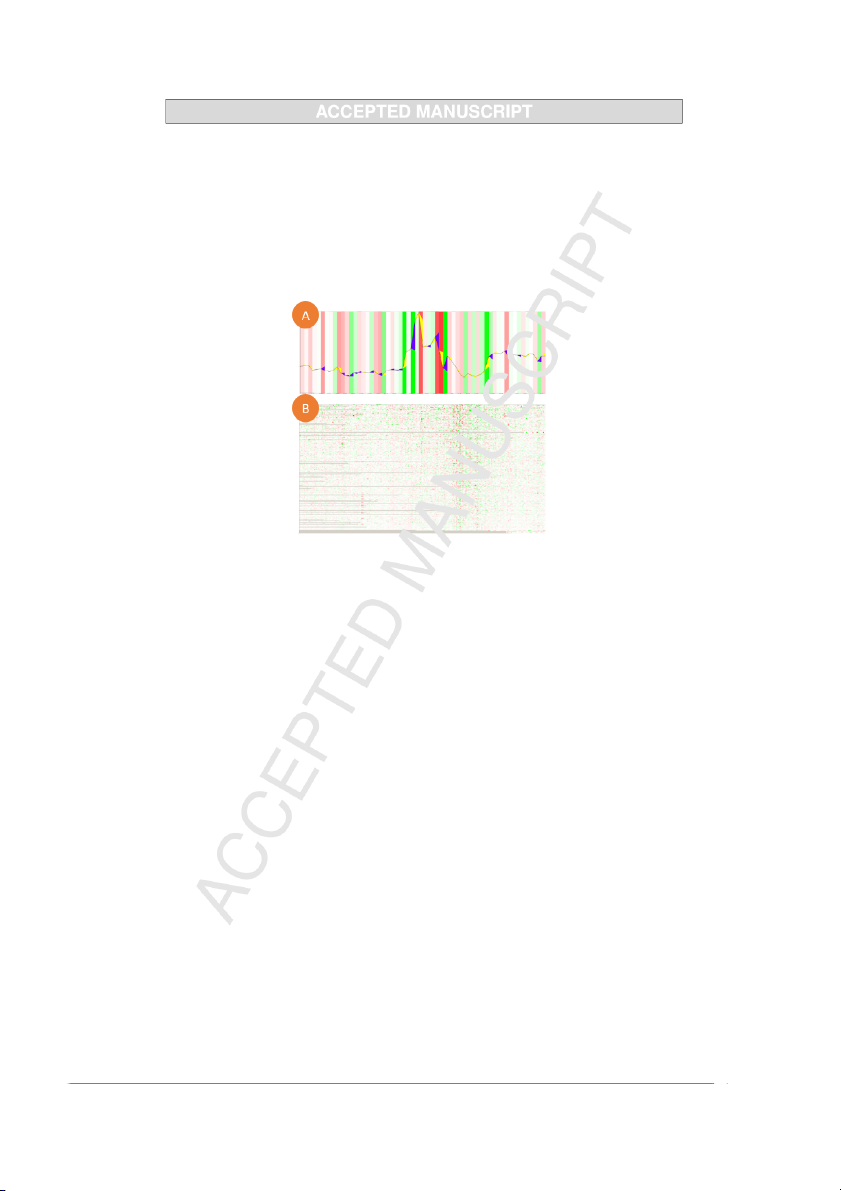
Polygons. Proposed in (SWK*11), polygons aim to visualize correla-
tions between individual share performances. This visualization technique
can be generated by using trapezoids or triangles (see Figure 3 (A)).
3D visualizations. There are quite some fraud detection approaches
that use 3D visualizations for their tasks. While 3D visualizations can ex-
press an extra dimension if compared to 2D techniques, two characteristics of
this type of visualization may confuse the analyst, leading him/her to wrong
analysis: occlusion and perspective misunderstanding. Some 2D techniques
are also just presented in 3D. For example, Figure 5 (A) is a 3D represen-
tation of Figure 5 (B). However, we also found approaches utilizing real 3D
representations (see Figure 7). 4.3. Interaction Techniques
When it comes to VA, the interaction technique employed by a solution
is a determinant factor. It has a strong influence on how analysts will ex-
plore the proposed technique as well as on the usability of the approach.
When developing a VA solution, the interaction techniques should be chosen
in accordance with the visualization techniques and tasks (AMST11). De-
termining this set of techniques is a critical task during visualization design.
It impacts the quality of the analysts’ insights and the efficiency of the so-
lution. We emphasize the selection of the appropriate interaction techniques
as a critical task of fraud detection VA projects.
Based on Yi‘s definition of interaction (YaKSJ07) (called users‘ intents)
and the enhancements made by (AMST11), we consider:
Selection. An analyst who spots an item or a temporal period of interest
can select and highlight this region. Highlighting visual elements is an useful
feature during data analysis, and also to aid the explanation of insights.
Exploration. This interaction technique shows extra information about
the data. When it comes to large, time-oriented, and multivariate data
sets, visualizations that aggregate information are common, but not always 11
justified. For those massive (large data sets), and/or complex (multivariate)
representations, analysts need to interactively explore different parts of the
data set in order to have a better overview of the content. Examples of
exploration usage are visiting, investigating of different time intervals, or changing the visual encoding.
Reconfigure. This interaction displays a different arrangement of data
items. A distinct arrangement of the data can highlight very different fea-
tures. For example, in case a analyst wants to analyze different time-oriented
aspects, he or she can arrange the elements in linear time or periodical time.
Encode. By encoding the analyst gets different representations of the
same data. This interaction allows the analyst to adapt the visual encoding
to suit different tasks. Some data sets have many interesting dimensions to be
evaluated. In order to cover multivariate data without increasing the visual
complexity of the visualization, the encode technique allows the analyst to
address different data dimensions to different visual features each time. For
instance, an analyst can use it to verify a hypothesis when looking at the
same data in another visual encoding.
Abstract/Elaborate. These are related to the aggregation level of the
visualization. We group these two interaction techniques into one category
due to their similar nature. Different data representation scenarios are more
efficient depending on the task. For some tasks, such as short period analy-
sis, the analyst needs to inspect certain items in detail. To do so, he or she
increases the degree of data detail in the visualization. This is called data
“elaboration”. For other tasks, however, a schematic representation may be
sufficient and could lead to faster results. For tasks when this functionality
helps or is needed, the interaction works ordering information aggregation
to the visualization elements. This is called data “abstraction”. Switching
between different time granularities is one example of these interaction tech-
niques. Zoom in and zoom out are another example of interaction techniques within this category.
Filter. By filtering, the visualization shows only the data that satisfies a
specific condition. This interaction is used when the analyst is searching for
specific information in the data, or when he or she is trying to verify a certain
hypothesis about the data set. By the usage of filter rules, elements out of
interest are excluded from the visual representation. This feature allows the
analyst to unclutter the view, and, as a consequence, to focus on the current
task. In Figure 4 (B) a bar chart is displayed, which allows the user find to
similar events by specifying filter rules based on already existent events. 12
Connect. This interaction shows or highlights items that are related
to each other. For example, when an insight is found in a data set, the
analysts can verify if similar or related behavior appears in other parts of
the data. This feature is suited to find, compare, and evaluate similarities
or relationships. In time-oriented data this interaction technique helps to
discover if a pattern is seasonal (has a determined frequency) or if it rather
appears at irregular intervals.
Undo/Redo. These techniques allow analysts to return to previous
analysis states. We group both in the same category due to their similar
nature. During a VA process, analysts have to navigate through different data
dimensions, time periods, and levels of granularity. In case a hypothesis or
query did not lead to the expected results, this interaction helps the analysts
to return to an early state without losing time by being forced to deconstruct the scenario.
Change Configuration. This technique allows the analyst to adjust
the interface. Besides adapting the visualization to the tasks and data at
hand, the analyst may also want to configure the overall system that provides
the visual representation. This interaction may affect various levels of the
system, from ”set the windows arrangement”, until ”manipulate the amount of memory to be used”.
No Interaction. An example of visualizations without interaction is a
classical static visualization. In this classification, we consider all visualiza-
tion techniques that do not provide interactive features. 4.4. Analytical Methods
In Keim‘s model (KAF*08), analytical methods are considered in paral-
lel with interactive visualizations. Analytical methods vary a lot between
the different approaches, however, we identified different ways of combining
visualizations with analytical methods.
Pre-Processing. Approaches that first utilize analytical methods such
as automatic algorithms of search, statistical methods, detection, or cluster-
ing, and subsequently use visualizations to present the results.
Post-Processing. Approaches that use visualization techniques in or-
der to understand, select, or observe the data before applying an analytical method.
Integrated. Approaches that allow a ’back-and-forth’ between visual-
ization techniques and automatic analysis. 13
Pure Visualizations. Some approaches do not integrate any form of
automatic analysis. Those approaches visualize the raw data without provid-
ing analytical methods for further analysis (in this report we do not consider
approaches that do not provide any kind of visualization). 5. Approaches Summary
We structure this section according to the application domains that are
tackled. These are (1) telecommunication, (2) stock market, (3) insurance,
(4) bank, and (5) internal fraud. For each application domain we outline
existing approaches related to VA in fraud detection. It is important to high-
light that, besides being organized by application domains, some approaches
are hybrid, which means they belong to more than one category. 5.1. Telecommunication
Adaptive Fraud Detection (FP97) is one of the pioneer papers in fraud
detection from 1997. This technique is considered hybrid, because of it is
tailored to bank fraud and telecommunication fraud detection. Moreover,
it is a data mining-oriented and uses line plots to aid during the analysis
process. Using a rule-learning algorithm, a set of monitors are generated to
profile legitimate customer behavior.
By using a node-link diagrams, bar charts, and line charts, Kenneth
Cox, et al. (CEWB97) propose group analysis as well as individual analysis
for telecommunication fraud detection. This is one of the firsts works which
use VA techniques in the context of fraud detection. The main idea is to
build visual interfaces that allow for the exploration of the data. Clustering
techniques are used to improve the node-link visualizations during interac-
tion. This is the only work from the telecommunication domain that allows
for an integrated visual and automated analysis.
Hollmen, et al. (HT99) present an online fraud detection system based
on a hierarchical regime-switching generative model. In this paper line plots
support analysts to determine the probability of detection and of false alarms.
With this information, the analysts are able to decide which alarm is worth
further effort, and which alarm can be discarded. The methods were devel-
oped by using and analyzing real mobile communication network data.
Hilas, et al. (HS05), present an approach to fraud detection in telecommu-
nication based on a machine learning method that generates user profiling. 14
Further analysis is done by using line plots in order to compare different user
profiles and, thus, identify strange behaviors.
Becker et al. (BVW12) presents a review of the history of fraud detection
from a big company. The authors also describe classes of fraud in the domain,
and propose VA models that support fraud detection of in each of different classes.
The most recent work found in this domain was (MMR17). The authors
present the design and implementation of Kerberos, a system to detect frauds
over Voice over IP networks. This work is a rather analytical approach that
aims for real-time detection of frauds. Kerberos allows the construction of
pre-defiened detection rules and the configuration of alarms. This work was
experimentally evaluated using real-world data and presents good perfor-
mance with different configurations.
Besides (MMR17), we could not find many recent papers dealing with
fraud detection in the telecommunication domain. Although the major part
of the selected papers from the telecommunication domain being not recent,
we still consider the approaches to be relevant in this context, and thus, we include them in this survey. 5.2. Stock Market
Using 2D and 3D visualization techniques, ADS (KSH*99) combines fea-
ture discovery and fraud detection for market data. This approach uses
diverse visualizations, interaction techniques, and data mining techniques.
Its main objectives are: regular monitoring of the stock market, pattern
detection, generating alerts for suspicious cases, and knowledge discovery
concerning the stock market transactions.
Aiming to aid traders to find trading patterns in market data, Nes-
bitt, et al. (NB04) use visualizations (i.e., 3D plots, bar charts, and line
plots) to look for patterns in stock market data. Besides not being a fraud
detection oriented article, this solution fits to the fraud detection problem
and, due to that, was considered for this survey.
Sanz Merino, et al. (MSK*06) present an empirical study of five different
visualization techniques for stock market data. Their study advises that line
plots and recursive patterns are better suited for retrospective data analysis,
but pixel techniques are also useful to find patterns in large data sets.
Huang, et al. (HLN09) present a new VA approach for stock market secu-
rity. They describe a two-stage process with each stage utilizing different vi-
sualization techniques: (1) 3D treemaps for monitoring market performance, 15
and (2) node-link diagrams for behavior driven analysis of trading networks
(see Figure 1). This approach may also help to identify future fraud plans.
Figure 3: Visualizations from (SWK*11): (A) Polygons visualization for correlation anal-
ysis and pattern detection. The correlation is represented by yellow and violet “slope
polygons”. Positive correlations between the share and the sector index are represented
by yellow polygons, while negative correlations are encoded by violet polygons. (B) rep-
resents 222 stocks of the oil sector for a period of 5 years.
Schaefer, et al. (SWK*11) support an interactive analysis of financial data
that contains the stock prices variation over a long period of time, and sector
indices information. Line plots coupled with a proposed visualization called
polygons aim to explore patterns and trends (see Figure 3 (A)). Pixel-based
visualizations are also used to visually explore large amounts of data (see
Figure 3 (B)). The proposed tool aids the analysts in detecting frauds, an-
alyzing performances of the historical stock price, and decision making in
the financial market. The main contribution of the approach is the integra-
tion of different views and the design of two new visualizations. However,
the solution does not provide any automatic algorithms to aid the identifica-
tion of interesting events. Thus, we classify this work as pure visualization approach.
When using node-link diagrams to visualize large entity-relationship data
sets, some scalability problems such as visibility, usability, and high degree
of nodes are likely to appear. Louvain, et al. (GLS*13) propose a clustering 16
algorithm to support these scenarios by using visual aggregation techniques
and easily tailorable components.
Bitcoin is considered a currency by many, even being a digital one. On
stock markets and forex markets, its price is driven by supply and demand.
An anomaly detection approach is proposed by (PL16) in order to prevent
bitcoin owners from loss. The analysis of the results from three unsupervised
learning methods (K-means, Mahalanobis distance, and Unsupervised Sup-
port Vector Machine) is supported by two different types of graphs (line plots
and scatter plots). Also aiming to detect suspicious activities on the bitcoin
market, (MMT16) used k-means and trimmed k-means in combination with
scatter plots in order to improve the detection rate.
Fraud detection is not the only task tackled by the major part of the
papers in this domain. These works usually focus on monitoring and querying
for known patterns that also aim to identify new behaviors. Once identified,
patterns are interpreted and classified as suspicious or not. 5.3. Insurance
Artis, et al. (AAG02) uses a Spanish automobile insurance market database
to indicate the performance of binary choice models for fraud detection. In
this work, line plots are used to estimate the probability of fraud for particu-
lar types of claims. This paper not only estimate frauds, but also presents an
estimation of the probability of detection efficiency of the proposed model.
He et al. (HXD03) presented a cluster-based local outlier detection sys-
tem. They proposed an algorithm for discovering outliers which outper-
formed the existing methods. This work presents scatter plots in order to
visualize the different clusters that are found by the algorithm (i.e., a pre-
processing approach). This is a flexible technique suited to discover criminal
activities in electronic commerce, credit cards, marketing, and costumer seg- mentation.
Phua et al. (PAL04), explores three existing classification algorithms and
suggests a new hybrid solution using automatic algorithms for fraud detection
by using meta-learning. Bar charts and line plots are used to assist in the
comparison of the different techniques.
Furlan, et al. (FB08) present a holistic approach focused on activities of
fraud management: deterrence, prevention, detection, investigation, sanc-
tion, redress, and monitoring. This work is based in a health care data set.
Bar charts are used in this work to analyze the time spent on each specific task. 17
Lovro, et al. (SFB11) uses social network analysis data in order to detect
automobile insurance fraud. The solution uses node-link diagrams to describe
fraudulent networks. When a new fraud is detected, the proposed system
allows self-calibration in order to adapt to new fraudulent schemes. The
authors suggest that the system could also be used in other domains.
Yi, et al. (SYL14) detects health insurance fraud by using a data set
about medical expense in China. Besides proposing a discrete choice model
to identify predictive factors of fraudulent claims, this paper also addresses
limitations of using the discrete choice model. In this paper, line plots are
used to describe the influence of different metric specifications on the pro-
posed fraud detection algorithm.
A VA approach is proposed by (CNY*17) for loan guarantee network
risk management. In this work, the authors present five analysis tasks that
were defined in collaboration with financial experts and, for solving those,
an interactive node-linked diagram. Credit risk evaluation is a major phase
during an insurance evaluation and this work supports insurance managers during the decision workflow.
The fraud detection tasks in the insurance domain vary with respect to
the insurance type. Most of the selected approaches are based on health care
and the automobile industry. To detect fraud, this domain is more focused on
analyzing data value variations and outliers rather than analyzing networks.
All identified studies from the insurance domain use automated methods
before representing the results visually. Thus, they all are classified as pre- processing approaches. 5.4. Bank
Kirkos, et al. (KSM07) explore the performances of data mining classifi-
cation techniques to identify fraudulent companies. The decision tree of the
model is represented by using a binary tree with bar charts inside each node
to represent the decision degree.
WireVis (CGK*07) is focused on detecting frauds in bank transactions, in
particular in money laundering. It proposes a set of visualizations displayed
as a multiview system that allows the analyst to interactively explore the
data. For each account transaction, keywords are analyzed and explored by
various visual means, including heat maps, bar charts, line plots, and node-
link diagrams. The different views are connected so that selecting a node
in the node-link diagram provokes a filter on all other views. A view of the
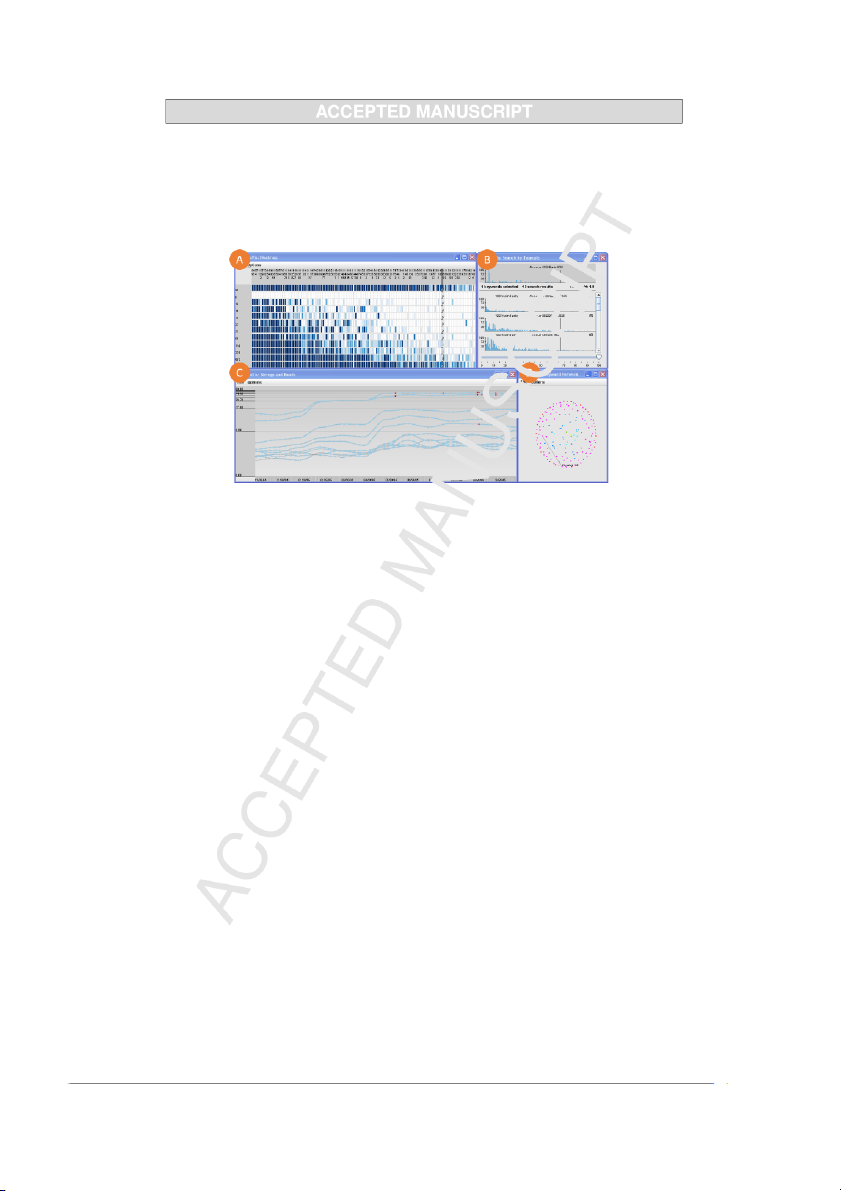
proposed system can be seen in Figure 4. 18
Figure 4: WireVis (CGK*07): (A) shows a heat map that reveals relationships between
accounts and keywords, (B), search by example, is a bar chart view that allows the user to
select an event and filter data by similarity, (C) shows the dimension of time (x-axis) and
transactions amount (y-axis) by using a line plot where each string represents a cluster of
accounts, and (D) a keyword network view, that shows relationships between keywords.
One year later, Chang, et al. (CLG*08) enhanced WireVis (CGK*07) by
concentrating the examples and results on wire transaction data. Suspicious
behavior could be found more easily as well as global trends. Multiview
analysis allows analysts to get the whole picture of relationships between
accounts, keywords, time, and patterns of activity. Both VA solutions were
created in collaboration with Bank of America.
VisForFraud (DGDLP10) is a VA system for financial crimes identifica-
tion. In order to discover potential illegal actor networks, the analyst is
supported by visualizations and multiple interaction techniques. The ac-
tors‘ network activities are analyzed by using interactions such as selection,
elaboration, filtering, and connection on the top of a network diagram visu- alization.
Due to its similarity with bank fraud, we include credit card frauds in
this section. In this context, Sakoda, et al. (SNI*10) present a VA tool for
assisting rule definition for fraud detection. In this VA solution, colored
scatter plots are displayed in 2D and 3D visualization, those can be seen in Figure 5.
VISFAN (DLMP11) is an interactive network visualization system for 19
Tài liệu liên quan:
-

Bài giảng về Tầm quan trọng của cửa hàng vật lý trong chiến lược quản lý Omni Channel môn Nghiên cứu Marketing | Trường Đại học Hoa Sen
49 25 -
Bài giữa kỳ Nghiên cứu Marketing - Tài liệu tham khảo | Đại học Hoa Sen
362 181 -

Nghiên cứu và thu thập các dữ liệu về Marketing p2 - Tài liệu tham khảo | Đại học Hoa Sen
272 136 -
Nghiên cứu và thu thập các dữ liệu về Marketing - Tài liệu tham khảo | Đại học Hoa Sen
293 147 -
International Journal of Bank Marketing - Tài liệu tham khảo | Đại học Hoa Sen
300 150