Chapter 2b: descriptive stats, tabular & graphical displays môn Xác suất thống kê| Trường Đại học Ngoại Thương
Summarizing Data for Two Variables Using TablesData Visualization: Best Practices in Creating Effective Graphical Displays. Tài liệu giúp bạn tham khảo, ôn tập và đạt kết quả cao. Mời đọc đón xem!
Môn: Xác suất thống kê (FTU) 355 tài liệu
Trường: Trường Đại học Ngoại Thương 1.1 K tài liệu
Tác giả:


Preview text:
entials of deSrlide n s by John Business Statistics (6e) Loucks
on, Sweeney, Williams, Camm, Cochran St. Edward’s 7 Cengage Learning University by John Loucks wards University
age Learning. May not be scanned, copied or duplicated, or posted to a publicly accessible website, in whole or in part, except for use as permitted in a license distributed with a certain product or service or
a password-protected website or school-approved learning management system for classroom use.
Statistics for Business and Economic apter 2, Part B
scriptive Statistics: Tabular and Graphical Displays
mmarizing Data for Two Variables Using Tables
mmarizing Data for Two Variables Using Graphical Displays
a Visualization: Best Practices in Creating Effective Graphical Displa
age Learning. May not be scanned, copied or duplicated, or posted to a publicly accessible website, in whole or in part, except for use as permitted in a license distributed with a certain product or service or
a password-protected website or school-approved learning management system for classroom use.
Statistics for Business and Economic
mmarizing Data for Two Variables sing Tables
us far we have focused on methods that are used to summarize the data for ne variable at a time.
en a manager is interested in tabular and graphical methods that will help
nderstand the relationship between two variables.
sstabulation is a method for summarizing the data for two variables.
age Learning. May not be scanned, copied or duplicated, or posted to a publicly accessible website, in whole or in part, except for use as permitted in a license distributed with a certain product or service or
a password-protected website or school-approved learning management system for classroom use.
Statistics for Business and Economic osstabulation
rosstabulation is a tabular summary of data for two variables. sstabulation can be used when:
one variable is categorical and the other is quantitative,
both variables are categorical, or
both variables are quantitative.
left and top margin labels define the classes for the two variables.
age Learning. May not be scanned, copied or duplicated, or posted to a publicly accessible website, in whole or in part, except for use as permitted in a license distributed with a certain product or service or
a password-protected website or school-approved learning management system for classroom use.
Statistics for Business and Economic osstabulation mple: Finger Lakes Homes
The number of Finger Lakes homes sold for each style and price for the
past two years is shown below. Price Home Style
Range Colonial Log Split A-Frame Total < $250,000 18 6 19 12 55 > $250,000 12 14 16 3 45 Total 100 30 20 35 15
age Learning. May not be scanned, copied or duplicated, or posted to a publicly accessible website, in whole or in part, except for use as permitted in a license distributed with a certain product or service or
a password-protected website or school-approved learning management system for classroom use.
Statistics for Business and Economic osstabulation mple: Finger Lakes Homes
Insights Gained from Preceding Crosstabulation
•The greatest number of homes (19) in the sample are a split-level style
and priced at less than $250,000.
•Only three homes in the sample are an A-Frame style and priced at $250,000 or more.
age Learning. May not be scanned, copied or duplicated, or posted to a publicly accessible website, in whole or in part, except for use as permitted in a license distributed with a certain product or service or
a password-protected website or school-approved learning management system for classroom use.
Statistics for Business and Economic
osstabulation: Row or Column Percentages
nverting the entries in the table into row percentages or column
ercentages can provide additional insight about the relationship between e two variables.
age Learning. May not be scanned, copied or duplicated, or posted to a publicly accessible website, in whole or in part, except for use as permitted in a license distributed with a certain product or service or
a password-protected website or school-approved learning management system for classroom use.
Statistics for Business and Economic osstabulation: Row Percentages mple: Finger Lakes Homes Price Home Style
Range Colonial Log Split A-Frame Total < $250,000 32.73 10.91 34.55 21.82 100 > $250,000 26.67 31.11 35.56 6.67 100
Note: row totals are actually 100.01 due to rounding.
(Colonial and > $250K)/(All > $250K) x 100 = (12/45) x 100
age Learning. May not be scanned, copied or duplicated, or posted to a publicly accessible website, in whole or in part, except for use as permitted in a license distributed with a certain product or service or
a password-protected website or school-approved learning management system for classroom use.
Statistics for Business and Economic
osstabulation: Column Percentages mple: Finger Lakes Homes Price Home Style
Range Colonial Log Split A-Frame < $250,000 60.00 30.00 54.29 80.00 > $250,000 40.00 70.00 45.71 20.00 Total 100 100 100 100
(Colonial and > $250K)/(All Colonial) x 100 = (12/30) x 100
age Learning. May not be scanned, copied or duplicated, or posted to a publicly accessible website, in whole or in part, except for use as permitted in a license distributed with a certain product or service or
a password-protected website or school-approved learning management system for classroom use.
Statistics for Business and Economic
osstabulation: Simpson’s Paradox
a in two or more crosstabulations are often aggregated to produce a ummary crosstabulation.
must be careful in drawing conclusions about the relationship between the
wo variables in the aggregated crosstabulation.
ome cases the conclusions based upon an aggregated crosstabulation can
e completely reversed if we look at the unaggregated data. The reversal of
onclusions based on aggregate and unaggregated data is called Simpson’s aradox.
age Learning. May not be scanned, copied or duplicated, or posted to a publicly accessible website, in whole or in part, except for use as permitted in a license distributed with a certain product or service or
a password-protected website or school-approved learning management system for classroom use.
Statistics for Business and Economic
mmarizing Data for Two Variables ing Graphical Displays
most cases, a graphical display is more useful than a table for recognizing atterns and trends.
playing data in creative ways can lead to powerful insights.
tter diagrams and trendlines are useful in exploring the relationship between wo variables.
age Learning. May not be scanned, copied or duplicated, or posted to a publicly accessible website, in whole or in part, except for use as permitted in a license distributed with a certain product or service or
a password-protected website or school-approved learning management system for classroom use.
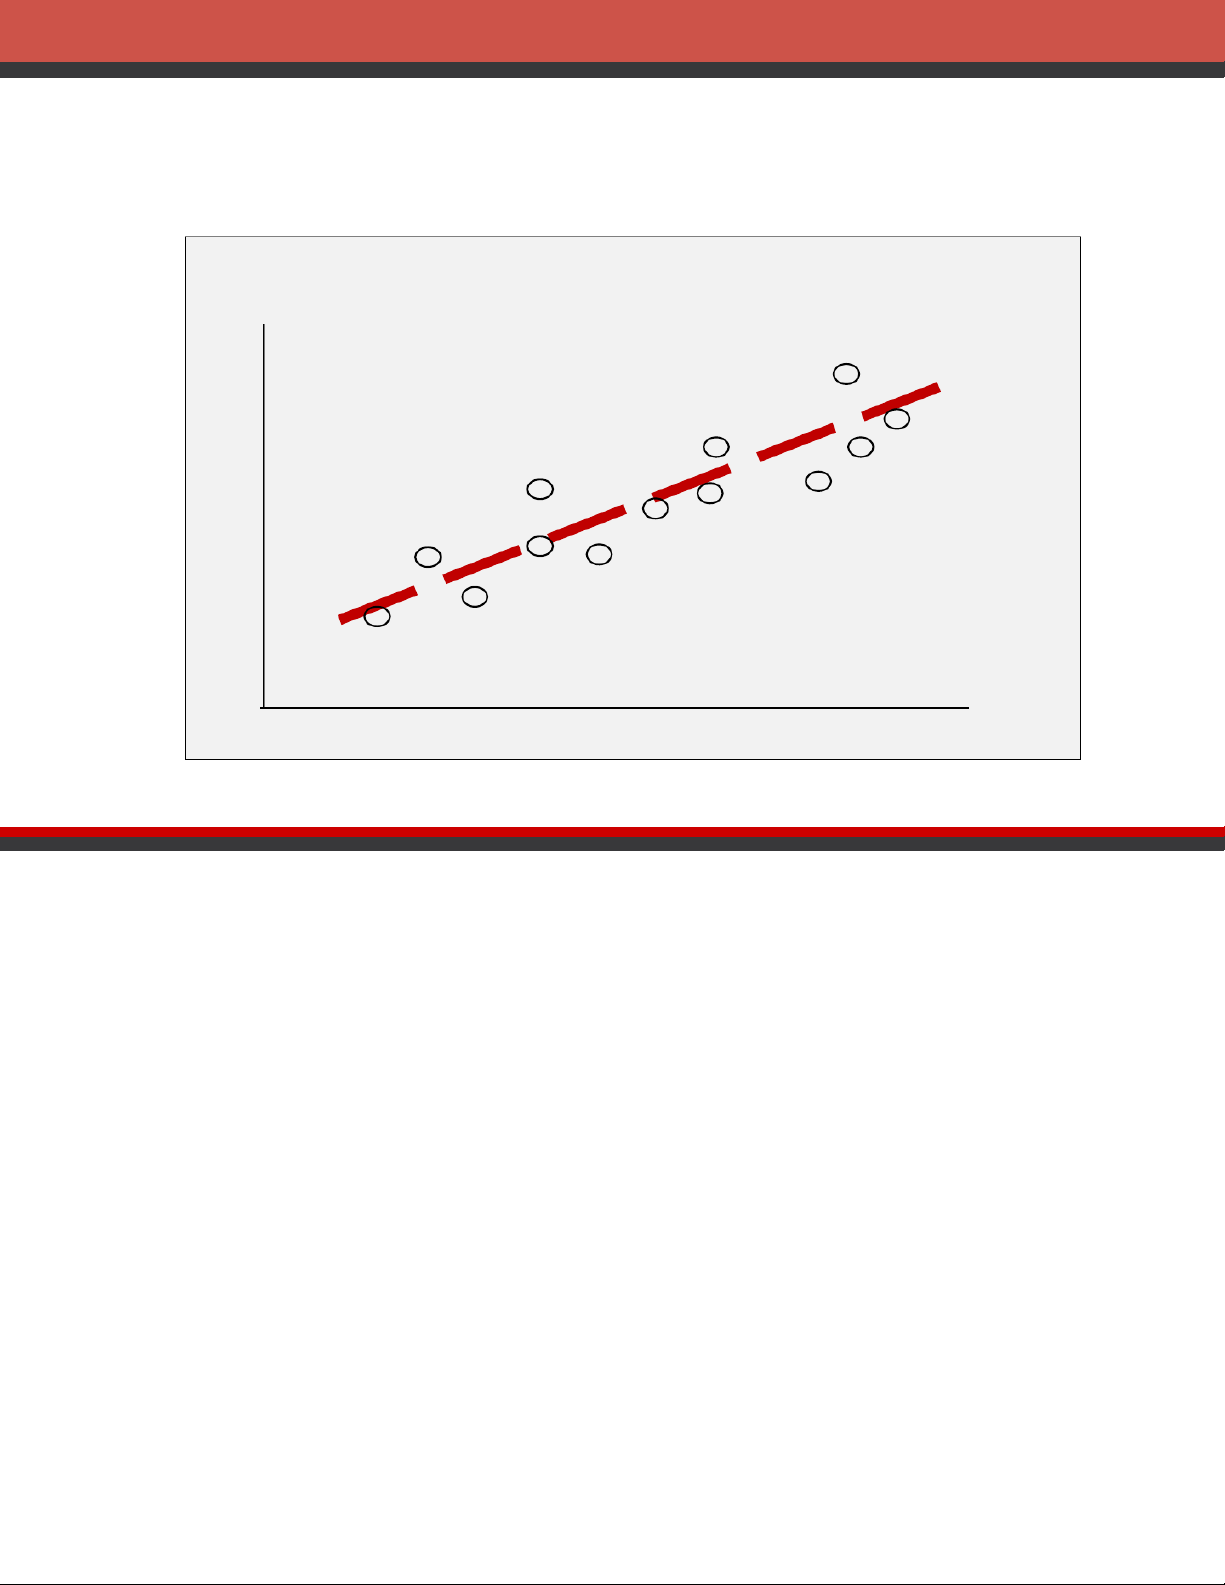
Statistics for Business and Economic atter Diagram and Trendline
catter diagram is a graphical presentation of the relationship between two uantitative variables.
e variable is shown on the horizontal axis and the other variable is shown on e vertical axis.
general pattern of the plotted points suggests the overall relationship etween the variables.
endline provides an approximation of the relationship.
age Learning. May not be scanned, copied or duplicated, or posted to a publicly accessible website, in whole or in part, except for use as permitted in a license distributed with a certain product or service or
a password-protected website or school-approved learning management system for classroom use.
Statistics for Business and Economic atter Diagram ositive Relationship y x
age Learning. May not be scanned, copied or duplicated, or posted to a publicly accessible website, in whole or in part, except for use as permitted in a license distributed with a certain product or service or
a password-protected website or school-approved learning management system for classroom use.
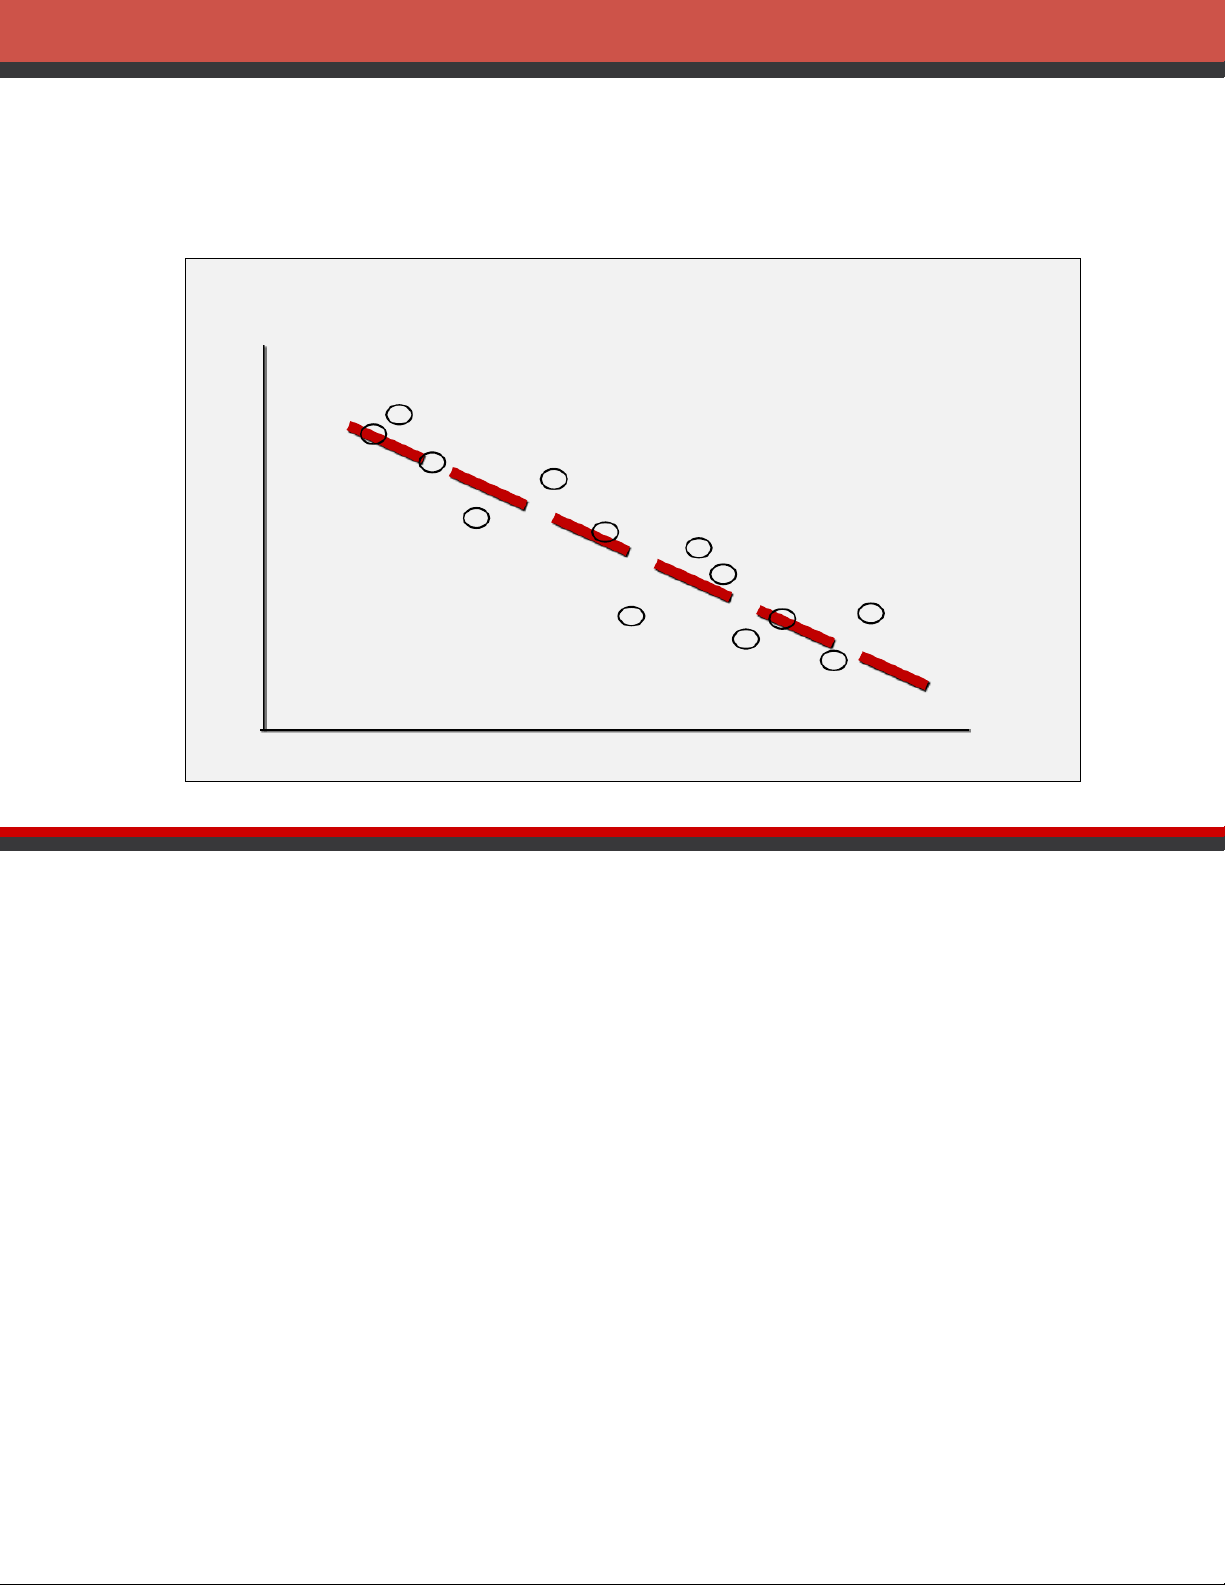
Statistics for Business and Economic atter Diagram Negative Relationship y x
age Learning. May not be scanned, copied or duplicated, or posted to a publicly accessible website, in whole or in part, except for use as permitted in a license distributed with a certain product or service or
a password-protected website or school-approved learning management system for classroom use.
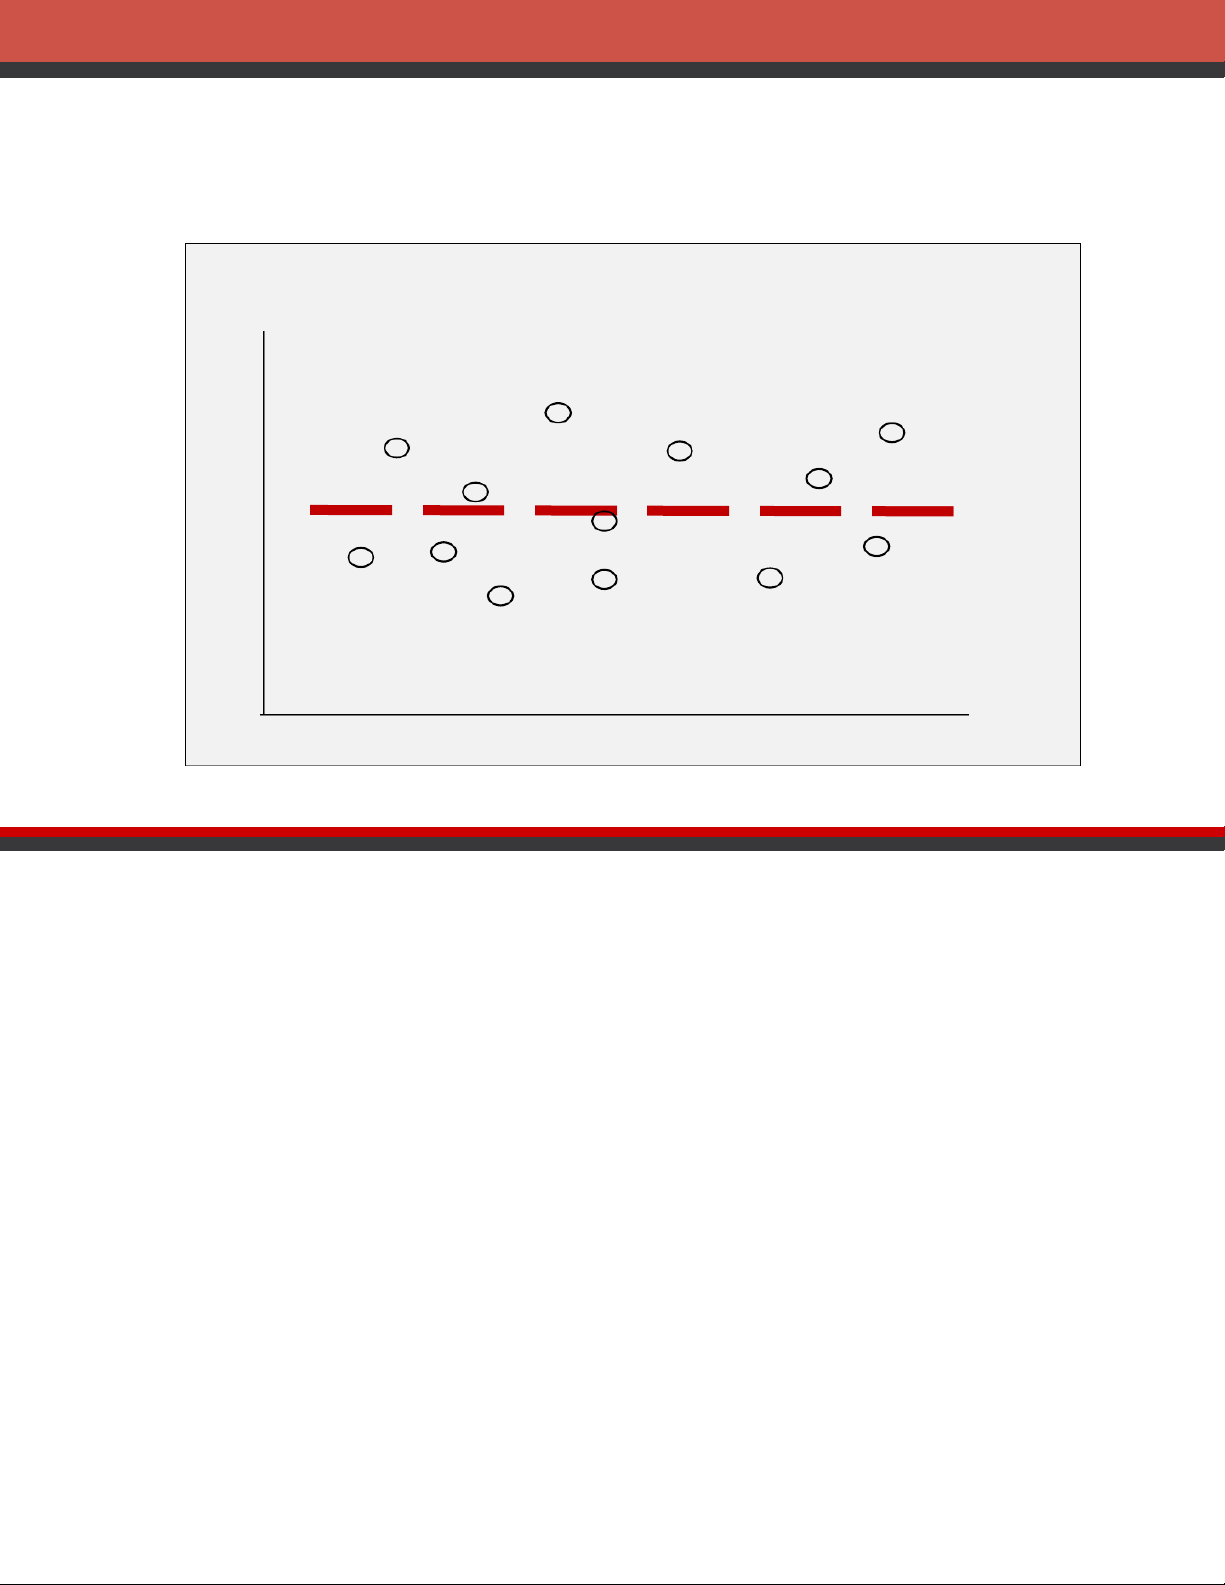
Statistics for Business and Economic atter Diagram Apparent Relationship y x
age Learning. May not be scanned, copied or duplicated, or posted to a publicly accessible website, in whole or in part, except for use as permitted in a license distributed with a certain product or service or
a password-protected website or school-approved learning management system for classroom use.
Statistics for Business and Economic atter Diagram mple: Panthers Football Team
The Panthers football team is interested in investigating the relationship,
if any, between interceptions made and points scored. x= Number of y= Number of Interceptions Points Scored 1 14 3 24 2 18 1 17 3 30
age Learning. May not be scanned, copied or duplicated, or posted to a publicly accessible website, in whole or in part, except for use as permitted in a license distributed with a certain product or service or
a password-protected website or school-approved learning management system for classroom use.
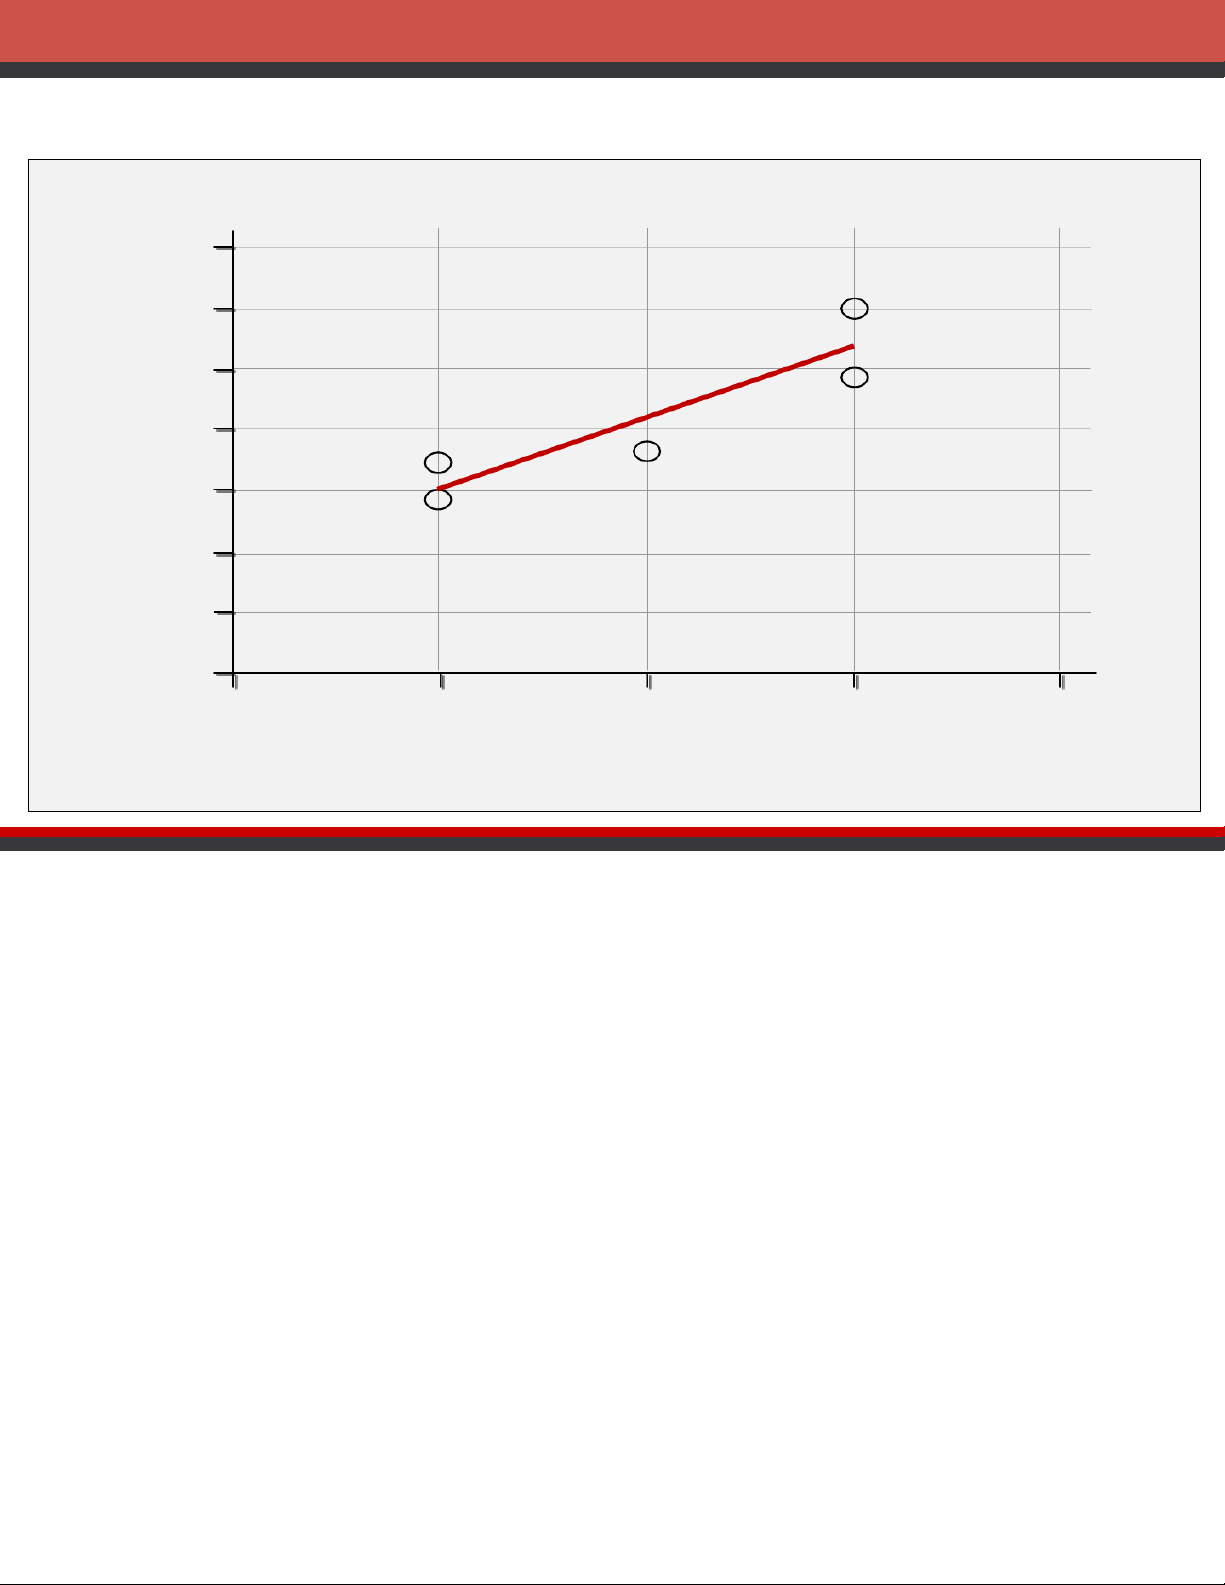
Statistics for Business and Economic atter Diagram and Trendline y 35 30 25 20 15 10 5 Number of Points Scored 0 x 12 3 4 Number of Interceptions
age Learning. May not be scanned, copied or duplicated, or posted to a publicly accessible website, in whole or in part, except for use as permitted in a license distributed with a certain product or service or
a password-protected website or school-approved learning management system for classroom use.
Statistics for Business and Economic ample: Panthers Football Team
ghts Gained from the preceding Scatter Diagram
The scatter diagram indicates a positive relationship between the number of
interceptions and the number of points scored.
Higher points scored are associated with a higher number of interceptions.
The relationship is not perfect; all plotted points in the scatter diagram are not on a straight line.
age Learning. May not be scanned, copied or duplicated, or posted to a publicly accessible website, in whole or in part, except for use as permitted in a license distributed with a certain product or service or
a password-protected website or school-approved learning management system for classroom use.
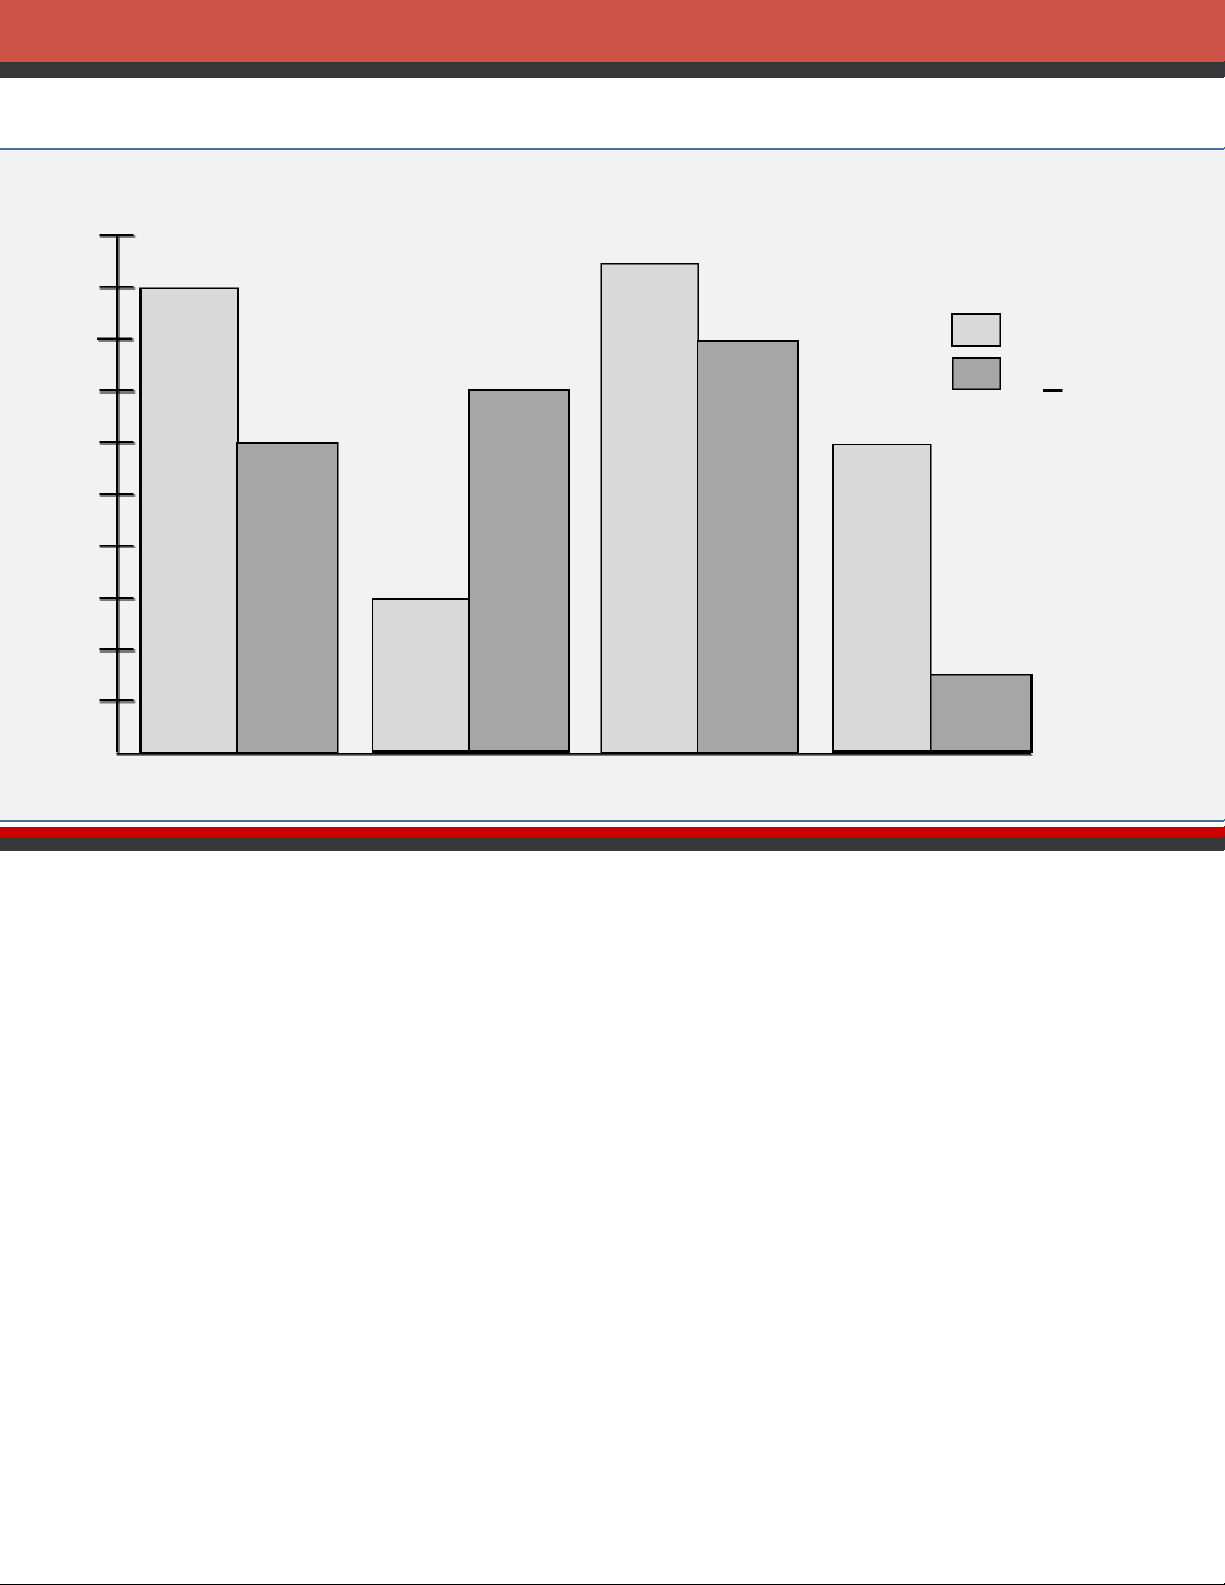
Statistics for Business and Economic de-by-Side Bar Chart
de-by-side bar chart is a graphical display for depicting multiple bar charts n the same display.
h cluster of bars represents one value of the first variable.
h bar within a cluster represents one value of the second variable.
age Learning. May not be scanned, copied or duplicated, or posted to a publicly accessible website, in whole or in part, except for use as permitted in a license distributed with a certain product or service or
a password-protected website or school-approved learning management system for classroom use.
Statistics for Business and Economic de-by-Side Bar Chart Finger Lake Homes 20 18 16 < $250,000 14 > $250,000 12 10 Freq 8 uency 6 4 2 Home Styl
Colonial Log Split-Level A-Frame
age Learning. May not be scanned, copied or duplicated, or posted to a publicly accessible website, in whole or in part, except for use as permitted in a license distributed with a certain product or service or
a password-protected website or school-approved learning management system for classroom use.
Tài liệu liên quan:
-

Bảng giá trị phân phối thống kê poisson và student môn Xác suất thống kê| Trường Đại học Ngoại Thương
27 14 -

Bảng giá trị quyết định thống kê wilcoxon rank-sum test môn Xác suất thống kê| Trường Đại học Ngoại Thương
29 15 -

Bài 1 Định nghĩa cổ điển về xác suất môn Xác suất thống kê| Trường Đại học Ngoại Thương
26 13 -

Exercises for probability & statistics môn Xác suất thống kê| Trường Đại học Ngoại Thương
26 13 -

Đề thi cuối kỳ lý thuyết môn Xác suất thống kê| Trường Đại học Ngoại Thương
27 14