

Preview text:
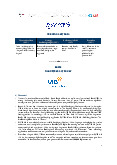
Dependent Independent ANOVA Coefficient Adjusted Result Variable Variable (s) F Sig. Beta Sig. R2 Perceived Accepted .235 .000 Prices H1 Perceived Accepted .207 .003 Credibility H2 Purchase Perceived 75.83 Accepted .000b .466 .000 .568 Intention Quality 3 H3 Perceived Rejected -.102 .122 Usefulness H4 Perceived Rejected .036 .579 Ease of Use H5
Test of Homogeneity of Variances Levene Statistic df1 df2 Sig. PI Based on Mean 2.800 3 281 .040 Based on Median 2.424 3 281 .066 Based on Median and with 2.424 3 252.668 .066 adjusted df Based on trimmed mean 2.352 3 281 .073 ANOVA PI Sum of Squares df Mean Square F Sig. Between Groups 5.207 3 1.736 2.768 .042 Within Groups 176.199 281 .627 Total 181.406 284 Multiple Comparisons Dependent Variable: PI LSD Mean Difference 95% Confidence Interval (I) Income (J) Income (I-J) Std. Error Sig. Lower Bound Upper Bound 1.0 2.0 -.0382 .1070 .722 -.249 .173 3.0 .4114* .1663 .014 .084 .739 4.0 -.0454 .1684 .788 -.377 .286 2.0 1.0 .0382 .1070 .722 -.173 .249 3.0 .4496* .1601 .005 .135 .765 4.0 -.0072 .1623 .965 -.327 .312 3.0 1.0 -.4114* .1663 .014 -.739 -.084 2.0 -.4496* .1601 .005 -.765 -.135 4.0 -.4568* .2062 .028 -.863 -.051 4.0 1.0 .0454 .1684 .788 -.286 .377 2.0 .0072 .1623 .965 -.312 .327 3.0 .4568* .2062 .028 .051 .863
*. The mean difference is significant at the 0.05 level. Descriptives PI
95% Confidence Interval for Mean N Mean Std. Deviation Std. Error Lower Bound Upper Bound Minimum Maximum 1.0 93 3.858 .6294 .0653 3.728 3.988 2.2 5.0 2.0 133 3.896 .8902 .0772 3.744 4.049 1.0 5.0 3.0 30 3.447 .9138 .1668 3.105 3.788 1.0 5.0 4.0 29 3.903 .6248 .1160 3.666 4.141 2.6 5.0 Total 285 3.837 .7992 .0473 3.744 3.930 1.0 5.0


