đsdẻdfhdgjakmsạhsndsakjasadasdsadsad
sss
Môn: Tâm lý học giáo dục 393 tài liệu
Trường: Trường Đại học Sư Phạm Hà Nội 3.7 K tài liệu
Tác giả:


Preview text:
Sonkaya and Öcal BMC Public Health (2024) 24:3347 BMC Public Health
https://doi.org/10.1186/s12889-024-20904-z RESEARCH Open Access
Young people’s attitudes toward marriage,
gender roles, and related factors
Attitudes toward marriage, gender roles
Zehra İncedal Sonkaya1* and Nursel Üstündağ Öcal2 Abstract
Background In this study, the effects of university students’ sociodemographic characteristics and their thoughts on
marriage on their attitudes towards marriage and gender roles were discussed.
Methods A cross-sectional descriptive study was designed, involving a sample of 1082 university students. The data
for this study were collected using a socio-demographic questionnaire, the Inönü Marital Attitude Scale (IMAS), and
the Gender Roles Attitude Scale (GRAS). The data were analyzed with descriptive statistics, Kruskal Wallis Test, and Pearson Correlation analysis.
Results The mean age of the participants was 20.53 ± 1.96 years, 67.9% were female and 32.1% were male. The
participants’ mean GRAS total score was 144.93 ± 26.62, and the mean IMAS score was 71.80 ± 16.42. Significant
gender-based differences were observed in IMAS and GRAS total/subscale scores (p < 0.001). Furthermore, societal
gender roles were found to be significantly correlated with participants’ income, views on the distribution of authority
between spouses, and opinions on domestic violence. A significant positive correlation was observed between
students’ IMAS total scores and GRAS egalitarian gender role subscale scores (r = 0.108, p < 0.001). Moreover, IMAS total
scores were found to be significantly negatively correlated with GRAS total and female gender role, gender role in
marriage, traditional gender role, and male gender role subscale scores (r=-0.252, p < 0.001).
Conclusions The participating students’ gender role total scores were found to be very high. Accordingly, as parents
of the future, young people are the group that needs to be prioritized, and it is essential to promote their positive
attitudes towards marriage and gender equality.
Keywords Marriage attitudes, Gender roles, Attitudes of young people, University students *Correspondence: Zehra İncedal Sonkaya zehra.incedal@amasya.edu.tr
1Department of Health Care, Sabuncuoğlu Serefeddin Health Services
Vocational School, Amasya University, Amasya, Turkey
2Vocational School of Health, Yozgat Bozok University, Yozgat, Turkey
© The Author(s) 2024. Open Access This article is licensed under a Creative Commons Attribution-NonCommercial-NoDerivatives 4.0
International License, which permits any non-commercial use, sharing, distribution and reproduction in any medium or format, as long as you
give appropriate credit to the original author(s) and the source, provide a link to the Creative Commons licence, and indicate if you modified the
licensed material. You do not have permission under this licence to share adapted material derived from this article or parts of it. The images or
other third party material in this article are included in the article’s Creative Commons licence, unless indicated otherwise in a credit line to the
material. If material is not included in the article’s Creative Commons licence and your intended use is not permitted by statutory regulation or
exceeds the permitted use, you will need to obtain permission directly from the copyright holder. To view a copy of this licence, visit h t t p :/ / c r e a t i
v e c o m m o n s .o r g / li c e n s e s / b y - n c - n d / 4 .0 / .
Content courtesy of Springer Nature, terms of use apply. Rights reserved.
Sonkaya and Öcal BMC Public Health (2024) 24:3347 Page 2 of 10 Introduction
However, patterns of inequality between the male and
The concept of family is the most fundamental build-
female genders are sometimes noticeable particularly in
ing block of society and is an important value that best working life, social life, as well as family and marital life.
reflects society. The family is a crucial environment This model of inequality in this field sometimes impedes
where a child is raised, grows up, takes the first steps and hinders women, in particular, from advancing their
towards participating in life as a member of society, and social status. This not only negatively affects women’s
shapes his/her future. Marriage has an incontrovert-
social status, but also their perception of health and qual-
ible value and importance in the formation of the fam-
ity of life. As a result of this model of inequality, women
ily structure. The transfer of social, cultural, and religious have been compelled to lag behind men in numerous
values related to society to future generations can only be areas and a gender disparity has arisen. However, as
ensured through healthy family dynamics and marriage women’s education levels rise, their participation in the
[1]. Family is the smallest building block of society and a workforce increases, and in turn leads to a shift in tradi-
structure that best reflects the values and normative rules tional gender roles in favor of women [4]. of society [2].
As the backbone of society, the attitudes of young
The concept of gender refers to the identification of one people toward marriage and gender inequality are very
as male or female, determined by physiological, biologi-
important. Their negative attitudes in this regard can
cal characteristics, and genetic traits [3]. This distinction erode moral values, negatively impact health and the
should be regarded as a difference in terms of gender, economy, and ultimately contribute to the deterioration
rather than as inequality [4]. Gender is a biological con-
of social and cultural structures [14]. Determining the
cept that signifies the distinction between individuals marriage and gender roles attitudes of university youth,
as either female or male. In social terms, the concept who are guardians and heirs of cultural values, is essen-
of gender refers to the socially determined personality tial for preventing social fracture [1].
traits, roles, and responsibilities assigned to women and
Society’s approach to marriage and its relationship with
men within their respective societies. It also includes the gender is a subject that has been examined by research-
status of women and men in society, as well as society’s ers at various times. In this context, Sassler and Schoen
perceptions of individuals and associated expectations. (1999) determined in a study that adherence to tradi-
Men and women’s roles according to gender are classi-
tional gender roles, uncertainty and disagreements about
fied as traditional and egalitarian roles. Roles attributed women’s position in the home negatively affect women’s
to women in traditional roles consist of non- egalitarian attitudes towards marriage. However, it was determined
accountabilities such as being responsible for domes-
that men who strongly adhere to traditional gender roles
tic affairs and not being active in professional life. Roles are much more likely to marry [15]. Another study by
attributed to men in traditional roles consist of account-
Barber and Axinn found that gender roles play a deter-
abilities such as being the head of the house and also mining role in women’s marital attitudes and that gen-
responsible for breadwinning. Egalitarian roles, however, der role attitudes have a very strong effect on marriage
are equal sharing of accountabilities in family, profes-
in early adulthood [16]. As the years passed, women
sional, social and educational life [5, 6].
became more involved in education and business life,
Social gender is influenced by the culture of the soci-
which led to changes in their attitudes towards marriage.
ety in which individuals live [7, 8]. The concept of societal A study conducted in 2013 revealed that women first
gender varies across societies. While certain behaviors focused on their careers and then took the initiative to
are deemed appropriate for men, others are desired and get married [17]. When we look at the studies conducted
expected of women; the social values and expectations in our country, it is seen that university students have a
are important in this differentiation [9]. However, gender more positive view on marriage and family life and have a
roles are shaped within a multi-layered system. In this traditional view on issues such as family life and relation-
system, male individuals are taught, especially by their ships [18].
fathers, to stay away from harsh, aggressive and weak
Accordingly, this study aims at examining the relation-
emotions. When the same boy becomes an adult, he may ship between gender roles and marriage attitudes of uni-
have difficulty expressing his feelings because he sees the versity students, who are future health professionals and
difficulties and problems he experiences in his romantic expected to serve as role models for society through their
relationships as a sign of weakness [10–12]. lifestyle.
The Universal Declaration of Human Rights states that Research hypotheses
all women and men have equal rights to life, health, edu-
cation, and work without discrimination [13]. It has been
• - There is a positive relationship between gender
stated that there is no room for inequality concerning
roles and sub-dimensions of university students and
the rights outlined in the Declaration of Human Rights. their marital attitudes.
Content courtesy of Springer Nature, terms of use apply. Rights reserved.
Sonkaya and Öcal BMC Public Health (2024) 24:3347 Page 3 of 10
• - The determined sociodemographic characteristics
190 and 38, respectively. The scale included five gender
of university students significantly affect their marital roles namely, egalitarian gender role, female gender role, attitudes.
gender role in marriage, traditional gender role, and male
• - The determined sociodemographic characteristics
gender role. A scale score of 95 or above indicates that
of university students and their gender roles
the participant has egalitarian attitudes towards gender significantly affect them.
roles. On the other hand, a score below 95 suggests that
the participant has traditional attitudes towards gender
roles. Cronbach α internal consistency coefficients for Materials and methods
the sub-dimensions of the scale are 0.80 for the female
A cross-sectional descriptive study was designed.
gender role, 0.78 for the egalitarian gender role, marital
The population of this study consisted of students gender role and traditional gender role, and 0.72 for the
attending YYY University Vocational School of Health male gender role.
Services and XXX University Health Services Vocational
School during the 2021–2022 academic year. Sampling Statistical analysis
was not performed with the aim of reaching the entire The R program ver. 2.15.3 (R Core Team, 2013) was
population. A total of 1082 university students partici-
employed for statistical analyses. The study data were
pated. Data were collected by researchers through face-
reported using measures such as minimum, maximum,
to-face interviews with participants.
mean, standard deviation, median, first quartile, third
In this study, participants’ sociodemographic char-
quartile, frequency, and percentage. The conformity of
acteristics and thoughts about marriage constituted quantitative data to a normal distribution was assessed
independent variables, while gender role attitudes and using the Shapiro-Wilk test and graphical analysis. Inde-
marriage attitudes constituted dependent variables.
pendent samples t-test was conducted to evaluate vari-
ables with a normal distribution between two groups. For Data collection tools
normally distributed variables between more than two
The data for this study were collected using a socio-
groups, a one-way analysis of variance (ANOVA) was
demographic questionnaire prepared by the researchers performed. On the other hand, the Kruskal-Wallis test
(16 items), the Inönü Marital Attitude Scale (21 items), was performed for non-normally distributed variables
and the Gender Roles Attitude Scale (38 items). The between more than two groups. Cronbach’s alpha coef-
socio-demographic questionnaire included a total of 16 ficient was considered to assess the internal consistency,
questions, with 6 questions measuring the participants’ and statistical significance was considered when p < 0.05.
characteristics and 10 questions measuring attitudes
towards marriage and gender roles. Results
The sociodemographic findings of the participants
Inönü Marital attitude scale (IMAS) The scale was are shown in Table 1. The mean age of the participants
developed to determine the attitudes of young adults was 20.53 ± 1.96 years, 67.9% were female and 32.1%
towards marriage. The validity and reliability of the scale were male. The participants’ mean GRAS total score
were examined by Bayaoğlu and Atlı [19]. The scale con-
was 144.93 ± 26.62, and the mean IMAS score was
sisted of 21 items rated on a 5-point Likert-type scale; 71.80 ± 16.42.
Strongly disagree [1], Seldom agree [2], Somewhat agree
The students stated that the ideal age of marriage was
[3], Agree [4], and Strongly agree [5]. Higher scores indi-
24.67 ± 2.27 years for women and 26.80 ± 2.55 years for
cate more positive attitudes toward marriage, whereas men. Of the students, 68.7% believe that couples should
lower scores indicate negative attitudes toward marriage. decide on marriage together, while 30.9% believe that
The scale does not have a cutoff value [19]. The reliability decisions about marriage should involve both fami-
values of the scale were found between 0.87 and 0.90.
lies and couples. Furthermore, 73% of the participants
Gender Roles Attitude Scale (GRAS): The scale was reported becoming disenchanted with marriage upon
developed to measure the attitudes of young adults witnessing violence between couples. The students’ opin-
toward societal gender roles by Zeyneloğlu [20]. The ions on marriage are shown in Table 2.
scales consisted of 38 items rated on a 5-point Likert-
Table 3 presents the comparison of students’ mean
type scale. Participants’ responses were scored as follows: GRAS total, GRAS subscale, and IMAS total scores with
‘Strongly disagree’ as one point, ‘Disagree’ as two, ‘Unde-
independent variables. No significant relationship was
cided’ as three, ‘Agree’ as four, and ‘Strongly agree’ as found between age and GRAS Egalitarian, Female, Tra-
five points. Twelve items were scored directly, while the ditional, and Male gender role subscale scores, GRAS
remaining 26 items were reverse-scored. The highest and total scores, and IMAS total scores (p > 0.05). Positive
lowest scores that can be obtained from the scale were correlations were observed between respondents’ ideal
Content courtesy of Springer Nature, terms of use apply. Rights reserved.
Sonkaya and Öcal BMC Public Health (2024) 24:3347 Page 4 of 10
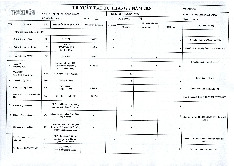
Table 1 Participants’ sociodemographic characteristics and
Table 2 Participants’ thoughts on marriage mean scale scores Thoughts n % Characteristic n % Min-Max Mean ± sd
How did your parents get married? (Median)
Arranged marriage, without prior knowledge of each 254 23.5 Age (years) 18–35 (20) 20.53 ± 1.96 other Gender
Arranged meeting and mutual approval 520 48.1 Female 735 67.9
Met each other and agreed to marry 268 24.8 Male 347 32.1 Elopement 40 3.7 Income Level
How should a marriage decision be made? High 401 37.0 Couples should decide together 743 68.7 Moderate 600 55.5
Parents and relatives should decide together 5 0.5 Low 81 7.5
Parents and couples should decide together 334 30.9
Marital Status of Parents
Factors affecting the decision to marry* Married 1014 93.7
Completion of individual education 787 72.7 Divorced 52 4.8 Economic independence 823 76.1 Living 16 1.5 Attainment of marriageable age 785 72.6 separately Having a recognized profession 669 61.8 Family Type Reaching physical maturity 686 63.4 Nuclear 830 76.7 Fulfillment of dowry needs 155 14.3 family
Distribution of authority between spouses Extended 215 19.9
There should be no authority between spouses 206 19.0 family
Woman should have the authority 46 4.3 Fragmented 37 3.4 family Man should have authority 50 4.6 Relationship status Decisions must be made jointly 780 72.1 No 637 58.9
Causes of family problems* relationship Chronic diseases 123 11.4 In a 426 39.4 Affair 790 73.0 relationship
Abuse (economic, physical, sexual) 614 56.7 Engaged 9 0.8 Unemployment 489 45.2 Married 10 0.9
Bad habits (smoking, alcohol, substance abuse, gambling, 636 58.8 Ideal marriage age for 18–35 (25) 24.67 ± 2.27 etc.) women Economic difficulties 589 54.4 Ideal marriage age for 18–35 (27) 26.80 ± 2.55 Infertility 422 39.0 men Children 268 24.8 GRAS Egalitarian 8–40 (33) 32.45 ± 6.59 Cultural differences 557 51.5 total and gender role Social differences 457 42.2 sub-scale Female gen- 12–40 (28) 28.26 ± 6.17
What is your opinion about marriage? scores der role I am afraid of marriage 421 38.9 Gender role 10–40 (36) 33.10 ± 6.94 I am not afraid of marriage 661 61.1 in marriage Relationship status Traditional 8–40 (28) 28.49 ± 6.99 gender role No relationship 637 58.9 Male gender 6–30 (24) 22.63 ± 5.85 In a relationship 426 39.4 role Engaged 9 0.8 Total scale 65–190 (149) 144.93 ± 26.62 Married 10 0.9 IMAS Mean Score 21–105 (72) 71.80 ± 16.42
How does news about domestic violence affect your views on marriage?
It makes me feel disenchanted with marriage 790 73.0
age of marriage for women and GRAS Egalitarian gender I believe women are at fault 46 4.3
role (r = 0.263, p < 0.001), Female gender role (r = 0.323, I think problems will decrease with a love marriage 219 20.2
p < 0.001), Gender role in marriage (r = 0.182, p < 0.001), I believe having children will reduce the problem of 27 2.5
Traditional gender role (r = 0.241, p < 0.001), Male gender violence
role (r = 0.236, p < 0.001) sub-scale and total scale scores *Participants marked more than one option
(r = 0.302, p < 0.001). On the contrary, a negative signifi-
cant relationship was identified between respondents’
ideal age of marriage for women and IMAS total scores
(r=-0.225, p < 0.001). Similarly, positive relationships were
Content courtesy of Springer Nature, terms of use apply. Rights reserved.
Sonkaya and Öcal BMC Public Health (2024) 24:3347 Page 5 of 10
Table 3 Comparison of the mean GRAS total, GRAS subscale, and IMAS total scores with independent variables Variable Egalitarian Female Gender Traditional Male GRAS Total IMAS Gender Gender role in Gender Gender Role Role marriage Role Role Gender Female 33.79 ± 6.4 30.3 ± 5.46 35.3 ± 6.12
30.84 ± 6.38 24.24 ± 5.25 154.46 ± 23.45 69.47 ± 16.11 Male 29.6 ± 6.06
23.96 ± 5.33 28.46 ± 6.25 23.5 ± 5.47
19.24 ± 5.61 124.76 ± 21.14 76.74 ± 16 Test score (t) 10.236 18.115 16.902 19.516 13.936 20.813 -6.942 ap < 0.001* < 0.001* < 0.001* < 0.001* < 0.001* < 0.001* < 0.001*
Place/institute where data was collected Amasya
34.62 ± 5.43 30.41 ± 5.73 35.49 ± 5.79 30.68 ± 6.79 24.53 ± 4.82 155.72 ± 23.11 69.55 ± 16.57 Yozgat
29.97 ± 6.92 25.82 ± 5.73 30.39 ± 7.14 25.99 ± 6.36 20.47 ± 6.17 132.65 ± 25 74.36 ± 15.88 Test score (t) 12.165 13.133 12.778 11.669 11.947 15.688 -4.857 ap < 0.001* < 0.001* < 0.001* < 0.001* < 0.001* < 0.001* < 0.001* Income Level Very high 27 (21, 32) 25 (23, 29) 26 (24, 34) 28 (23, 30) 21 (18, 25) 121 (113, 134) 72 (64, 84) High 33 (30.5, 29 (25, 34) 36 (31, 39) 30 (23, 35) 24 (19, 28) 151 (129, 169) 77 (63, 84) 39.5) Moderate 34 (29, 38) 29 (24, 33) 36 (30, 39) 29 (24, 34)
24 (18.5, 27) 152 (128, 167) 70 (61, 81.5) Low 33 (27, 37) 28 (23, 32) 36 (27, 39) 25 (23, 33) 25 (18, 26) 152 (117, 161) 76 (63, 85) Very low 26 (19, 27) 20 (12, 23) 22 (22, 25) 20 (16, 25) 15 (10, 16) 103 (87, 106) 71 (63, 98) Test score (χ2) 73.649 41.162 85.563 35.166 38.057 77.805 12.397 bp < 0.001* < 0.001* < 0.001* < 0.001* < 0.001* < 0.001* 0.015* Marital status of parents Married 33 (28, 38) 28 (24, 33) 36 (29, 39) 28 (24, 34) 24 (18, 27) 149 (124, 167) 73 (63, 84) Divorced 31 (26, 37) 29 (24, 34)
38 (24.5, 40) 34 (24, 35.5) 26 (18, 28) 159 (114, 170) 69 (60.5, 80.5) Living separately 31 (23, 36) 23.5 (21,
29 (21, 32.5) 21 (20, 26.5) 18 (15, 21) 113.5 (112, 76.5 (67.5, 26.5) 134) 83) Test score (χ2) 4.661 7.881 7.797 11.313 6.448 8.974 4.449 bp 0.097 0.019* 0.020* 0.003* 0.040* 0.011* 0.108 Family type Nuclear family
32.84 ± 6.56 28.33 ± 6.33 33.34 ± 6.96 28.69 ± 7.18 22.72 ± 5.98 145.92 ± 26.84 72.38 ± 16.12 Extended family 31.67 ± 6.28 28.1 ± 5.46 32.66 ± 6.67 27.8 ± 6.19
22.62 ± 5.17 142.84 ± 24.59 70.08 ± 17.94 Fragmented family
28.16 ± 7.12 27.62 ± 6.67 30.38 ± 7.38 27.97 ± 6.99 20.76 ± 6.46 134.89 ± 30.82 68.89 ± 12.84 Test value (F) 11.015 0.325 3.809 1.503 2.003 3.891 2.283 cp < 0.001* 0.723 0.022* 0.223 0.135 0.021* 0.102 Form of marriage:
Arranged marriage, without prior knowledge of 31.61 ± 6.91 28.29 ± 6.32 32.38 ± 7.29 27.87 ± 7.32 22.4 ± 6.33 142.56 ± 28.07 71.98 ± 15.46 each other
Arranged meeting and mutual approval 32.9 ± 6.08
28.33 ± 5.78 33.79 ± 6.42 29.19 ± 6.6
23.08 ± 5.53 147.27 ± 24.63 71.01 ± 16.84
Met each other and agreed to marry
32.56 ± 7.13 27.98 ± 6.83 32.74 ± 7.38 27.81 ± 7.44 22.15 ± 5.95 143.24 ± 28.78 72.94 ± 16.76 Elopement
31.08 ± 6.56 29.18 ± 5.54 31.28 ± 7.34 27.85 ± 6.07 21.63 ± 5.72 141 ± 25.37 73.4 ± 14.33 Test value (F) 2.786 0.501 3.810 3.354 2.140 2.680 0.966 cp 0.040* 0.682 0.010* 0.018* 0.093 0.046* 0.408
How should a marriage decision be made?
Couples should decide together 32 (28, 38) 28 (24, 34) 36 (28, 39) 28 (23, 34) 24 (18, 27) 149 (121, 168) 73 (62, 83)
Parents and relatives should decide together 26 (20, 26) 27 (25, 28) 28 (28, 39) 28 (27, 39) 23 (23, 28) 129 (129, 155) 54 (54, 65)
Parents and couples should decide together 34 (30, 38) 27 (23, 32) 35.5 (30, 39) 29 (24, 34) 24 (19, 27) 149.5 (127, 72 (64, 84) 167) Test value (χ2) 5.922 10.916 0.256 1.281 0.850 0.168 7.118 bp 0.052 0.004* 0.880 0.527 0.654 0.919 0.028*
Distribution of authority between spouses
There should be no authority between spouses 31.8 ± 7.29
28.64 ± 6.33 33.32 ± 6.56 29.5 ± 6.54
23.14 ± 5.71 146.39 ± 25.92 69.27 ± 19.61
Woman should have the authority
33.43 ± 6.23 28.61 ± 6.12 34.87 ± 7.68 29.67 ± 7.37 24.46 ± 5.77 151.04 ± 26.01 64.3 ± 15.8 Man should have the authority
29.26 ± 4.84 21.56 ± 7.39 26.28 ± 5.71 20.3 ± 4.77 17.34 ± 6.8 114.74 ± 24.03 80.3 ± 15.58
Content courtesy of Springer Nature, terms of use apply. Rights reserved.
Sonkaya and Öcal BMC Public Health (2024) 24:3347 Page 6 of 10
T able 3 (continued) Variable Egalitarian Female Gender Traditional Male GRAS Total IMAS Gender Gender role in Gender Gender Role Role marriage Role Role Both sides must have authority
32.76 ± 6.45 28.57 ± 5.81 33.38 ± 6.84 28.68 ± 6.88 22.73 ± 5.66 146.12 ± 25.86 72.37 ± 15.28 Test value (F) 5.572 21.807 18.454 26.682 16.399 24.466 9.834 cp 0.001* < 0.001* < 0.001* < 0.001* < 0.001* < 0.001* < 0.001* Opinion about marriage I am afraid of marriage
31.45 ± 7.29 28.83 ± 5.77 33.27 ± 7.05 29.86 ± 6.85 22.93 ± 5.75 146.35 ± 26.54 65.79 ± 16.9 I am not afraid of marriage 33.08 ± 6.02 27.9 ± 6.39 33 ± 6.87
27.61 ± 6.95 22.45 ± 5.91 144.03 ± 26.66 75.63 ± 14.91 Test value (t) -3.826 2.425 0.642 5.211 1.330 1.393 -9.766 ap < 0.001* 0.015* 0.521 < 0.001* 0.184 0.164 < 0.001* Relationship status No relationship 33 (29, 38) 28 (23, 33) 36 (29, 39) 29 (24, 34) 24 (19, 27) 149 (124, 167) 70 (60, 82) In a relationship 33 (28, 39) 28 (24, 34) 36 (28, 39) 28 (23, 33) 24 (18, 27) 149 (119, 167) 77 (64, 85) Engaged 32 (24, 34) 24 (21, 27) 24 (21, 26) 24 (19, 28) 18 (11, 21) 114 (106, 118) 66 (63, 78) Married 33 (30, 40) 29.5 (17, 34) 31 (20, 40) 26 (14, 33) 24 (16, 25) 137.5 (97, 169) 75.5 (59, 79) Test value (χ2) 3.243 3.670 7.404 9.908 7.763 5.859 33.277 bp 0.356 0.299 0.060 0.019* 0.051 0.119 < 0.001*
How does news about domestic violence affect your views on marriage?
It makes me feel disenchanted with marriage 34 (29, 39) 30 (25, 34) 37 (30, 39) 30 (25, 35) 25 (20, 28) 156.5 (131, 70 (60, 81) 169) I believe women are at fault 27 (25, 34) 23 (16, 26) 25 (22, 32) 24 (19, 27) 19 (14, 23) 117 (101, 133) 71 (63, 98)
I think problems will decrease with a love 32 (28, 36) 26 (22, 30) 32 (27, 37) 26 (21, 32) 21 (15, 26) 133 (114, 156) 82 (71, 88) marriage
I believe having children will reduce the prob- 34 (25, 37) 23 (20, 25) 33 (28, 34) 24 (19, 27) 20 (17, 25) 136 (112, 143) 83 (78, 94) lem of violence Test value (χ2) 42.811 101.242 100.371 98.324 62.596 103.442 95.594 bp < 0.001* < 0.001* < 0.001* < 0.001* < 0.001* < 0.001* < 0.001*
r = Pearson correlation coefficient, *p < 0.05
a Independent samples t-test, results are presented as mean ± standard deviation
b Kruskal-Wallis test, results are presented as median (first quartile, third quartile)
c One-way analysis of variance, results are presented as mean ± standard deviation
Table 4 Correlations between participants’ attitudes toward
Statistically significant gender-based differences were
gender roles and attitudes toward marriage
found in the GRAS total, GRAS subscale, and IMAS total IMAS
scores (p < 0.001). Women exhibited higher scores on the r p
GRAS subscale and total scores, whereas their IMAS
GRAS - Egalitarian gender role 0.108 < 0.001*
total score was lower compared to men.
GRAS - Female gender role -0.276 < 0.001*
The correlation between the participants’ total and
GRAS - Gender role in marriage -0.206 < 0.001*
sub-dimension scores of gender roles and their marital
GRAS - Traditional gender role -0.398 < 0.001*
attitudes is shown in Table 4. There was a statistically sig- GRAS - Male gender role -0.259 < 0.001*
nificant positive correlation between participants’ IMAS GRAS - Total -0.252 < 0.001*
total scores and GRAS Egalitarian gender role (r = 0.108,
p < 0.001) subscale scores. On the other hand, IMAS total
determined between respondents’ ideal age of marriage scores were found to be negatively correlated with Female
for men and GRAS Egalitarian gender role (r = 0.246, gender role (r=-0.276, p < 0.001), Gender role in marriage
p < 0.001), Female gender role (r = 0.337, p < 0.001), Gen-
(r=-0.206, p < 0.001), Traditional gender role (r=-0.398,
der role in marriage (r = 0.202, p < 0.001), Traditional gen-
p < 0.001), Male gender role (r=-0.259, p < 0.001) subscale
der role (r = 0.284, p < 0.001), Male gender role (r = 0.244, and total scale (r=-0.252, p < 0.001) scores (Table 4).
p < 0.001) sub-scale and total scale scores (r = 0.319,
p < 0.001). A negative significant correlation was deter- Discussion
mined between respondents’ ideal age of marriage for When the subscale scores were examined according
men and IMAS total scores (r=-0.271, p < 0.001).
to gender in the study, it was seen that the total gender
role scores and all subscale scores of female students
Content courtesy of Springer Nature, terms of use apply. Rights reserved.
Sonkaya and Öcal BMC Public Health (2024) 24:3347 Page 7 of 10
were higher than those of male students and the differ-
of this classification, they identify with the group they
ence was statistically significant (p < 0.001). The highest place themselves in. As a result of this identification, their
score obtained from the GRAS scale (40 points) indi-
social identities are formed. The fact that students belong
cates that the student has a “modern” attitude towards to different cultures, the geography they live in and the
gender roles, while the lowest score (8 points) indicates groups they belong to are the main determinants in the
that the student has a “traditional” attitude towards gen-
emergence of sexist approaches [29, 30].
der roles [20]. Kök et al. found that female students had
Examination of the GRAS scale scores based on the
more egalitarian attitudes than male students [21]. The income of the participants indicated that students with
same study reported significant gender-based differences very low income had significantly lower GRAS total and
in the egalitarian, gender role in marriage, traditional, subscale scores (p < 0.001). Furthermore, the GRAS scale
and male gender role scores. Our results are consistent scores were evaluated based on the marital status of par-
with the literature findings. Bayezit reported that women ents. Accordingly, participants whose parents were mar-
had higher egalitarian gender role scores than men, ried had higher egalitarian gender role scores, whereas
with a mean GRAS total score of 137.89 ± 17.41 [22]. In those whose parents were divorced had higher GRAS
a study by Akgül involving gender Z, the mean GRAS total and female gender role, gender role in marriage,
total score was found to be 164.21 ± 23.13 [23]. Further-
traditional gender role, and male gender role subscale
more, in a study by Koca involving university students, scores.
the mean egalitarian, gender role, and GRAS total scores
Of the students, 68.7% believe that marriage should be
were reported to be 35.79 ± 4.20 and 151.04 ± 21.34 [24]. decided by the couples and 73% stated that they become
The results obtained from the research show that the par-
disenchanted with marriage when they hear news about
ticipants’ GRAS total and subscale score distributions are violence between couples. Akbaş et al. reported that similar to the literature.
74.6% of women considered the ideal marriage age to be
Kerkez et al. found a significant gender-based differ-
24 years and above, while 77% of men reported it to be
ence in the total Gender Role Scale scores of students 25–29 years [1]. Among the students, 95.2% stated that
(p < 0.05) [25]. We found that female students had higher they themselves should decide whom to marry, 68.5%
egalitarian and traditional attitudes than male students commented that the decision to marry was most influ-
(p < 0.001). Previous studies also reported similar find-
enced by having economic freedom, and 59.9% stated
ings, women mostly support egalitarian gender role more that they were not afraid of marriage.
than men [26, 27]. Based on the findings, it can be argued
In this study, the mean Inönü Marital Attitude Scale
that participants generally adopted modern/egalitarian score of the students was found to be 71.80 ± 16.42 attitudes toward gender roles.
with a distribution interval of 21–105 (72). Akbaş et al.
Examination of the GRAS scale scores based on the reported the mean Inönü Marital Attitude Scale score of
universities where the study was conducted revealed the students as 77.85 ± 15.403, with a distribution inter-
that students studying in Amasya had statistically sig-
val of 22–105 [1]. In a study by Fışkın and Sarı involv-
nificant higher GRAS total and subscale scores compared ing a sample of 820 students, attitudes towards marriage
to those studying in Yozgat (p < 0.001). These differences were found to be positive with a mean scale score of
between the scale scores can be attributed to cultural and 73.31 ± 18.32 [31].
economic differences in the places where students grow
The mean Inönü Marital Attitude Scale score of the
up, live, and study. Amasya’s historical and cultural heri-
male students was found to be significantly higher than
tage bears the traces of a rich and deep past. With this those of female students. In the study of Fışkın and
structure, hosting many local and foreign tourists con-
Sarı involving a sample of college students from a dif-
tributes to increasing the socio-cultural levels of indi-
ferent university, the marriage attitude scores of male
viduals living in that region. In this context, it is also an and female students were found to be 76.44 ± 17.27 and
expected result that students studying in Amasya will 72.17 ± 18.57, respectively [31]. The increased socioeco-
have a more egalitarian attitude. In addition, this differ-
nomic interdependency of women, their development in
ence can also show the meanings that families give to the socio-cultural aspects, and their active participation in
concept of gender in different cultures. Social Identity working life may contribute to more negative attitudes
Theory, which is frequently emphasized in the literature of women towards marriage compared to men. Another
to understand the gender culture created by the fam-
reason why women have more negative attitudes towards
ily, reveals how individuals play these gender roles. In marriage may be that men do not seek support due to the
this theory put forward by Tajfel and Turner, individu-
possibility of being stigmatized for seeking help in cases
als define and evaluate themselves by taking into account of problems that arise in marriage due to their mascu-
the social group they are a member of [28]. As a result line gender role [32]. Traditional masculine norms force
of this evaluation, they classify themselves and as a result men to correct themselves without the help of others and
Content courtesy of Springer Nature, terms of use apply. Rights reserved.
Sonkaya and Öcal BMC Public Health (2024) 24:3347 Page 8 of 10
to suppress the expression of their emotions [33]. On
Statistically significant differences were observed in
the other hand, women’s constant role as constructors, the students’ marital attitude scores according to their
taking on problems on their own, receiving psychologi-
romantic relationship status (p < 0,001). Students who do
cal support and being alone when necessary negatively not have a romantic relationship exhibited lower marital
affects women’s attitudes towards marriage.
attitude scores compared to those who are married or in
Examination of the students’ IMAS scores based on the a romantic relationship.
marital status of parents revealed that students whose
A significant positive correlation was observed between
parents were separated had higher scores than those students’ IMAS total scores and GRAS egalitarian gen-
whose parents were married or divorced. Akbaş et al. der role scores. In the study by Yalçın et al. involving 307
reported similar results, with higher mean IMAS scores university students, similar findings were reported. They
among students with parents who had religious and civil identified a significant positive correlation between stu-
marriages; however, this difference was found to be not dents’ attitudes toward marriage and egalitarian gender statistically significant [1].
roles (r = 0.12 and p < 0.05) [38]. In addition, in the study
Furthermore, in a study conducted by Cuthbert and conducted by Akpınar and Kırlıoğlu with individuals
Amadu (2014) to examine college students’ attitudes working in various public institutions such as universi-
toward marriage and building a family, students were ties, courthouses, and social service organizations, it was
found to have no positive thoughts about marriage. determined that attitudes towards gender roles signifi-
However, the authors stated that among students with cantly predicted marital adjustment (F = 2,712; p < 0,05).
positive attitudes towards marriage, certain factors such However, they found that the change in the division of
as education and ethnicity affect their thoughts about labor in marriages from egalitarian to traditional caused
marriage [34]. A previous study involving a sample of a decrease in the marital happiness of female spouses
325 college students reported that students had positive [39]. Another study found that the lack of an egalitarian
attitudes towards marriage but marriage decisions are attitude by one of the spouses significantly reduces the
influenced by current family dynamics [35]. Moreover, a quality of marriage [40].
survey of Iranian youth found that although the major-
ity had positive views on marriage, marriage rates among Conclusion
young people were found to be declining [36]. In our Although separate studies have been conducted on mar-
study involving youth, although some participants stated riage attitudes and gender roles with university students
that they were disenchanted with marriage, the marital in Turkey, this study is quite important in terms of con-
attitude scores of those who believed that having children sidering these two variables together. The effect of our
reduces marital problems and positively affects marriage gender roles, which are shaped by the geography we live
were found to be higher. A literature survey revealed that in and the cultural values we have, on marriage attitudes
studies conducted in countries with different sociocul-
and their relationship with sociodemographic variables
tural backgrounds reported results differing from ours. In are revealed in this study. In addition, revealing the atti-
a study involving 7 European countries, having children tudes of this group, which will be employed in the health
was found to have no effect on marriage attitudes [37].
sector that serves all segments of society, towards mar-
Regarding the distribution of authority between riage and gender roles constitutes another important
spouses, the marital attitude scores of the students who aspect of the study.
believed that the male should have the authority were
This study examined young individuals’ attitudes
higher, and this difference was statistically significant. toward marriage and societal gender roles based on
Based on these findings, it is considered that young indi-
certain sociodemographic variables. The participating
viduals in our sample have more traditional attitudes students exhibited very high total gender role scores.
towards marriage. Previous studies examining Turk-
However, students’ views on marriage attitudes are
ish culture and marriage attitudes also reported similar similar to those in the literature. Furthermore, women results [31].
supported egalitarian gender roles more than men. Lit-
Examination of students’ IMAS scores based on the erature findings suggest that in order to change the tra-
marriage types of their parents indicated that the mean ditional perspective on gender roles and provide young
scores of students whose parents met themselves and people with an egalitarian perspective, it is necessary to
agreed to marry or eloped were higher than those whose identify their attitudes towards gender roles. Neverthe-
parents had an arranged marriage; however, this differ-
less, young individuals were found to have high marital
ence was not statistically significant. Students whose par-
attitude scores and they’re open to marriage. Participants’
ents had an arranged marriage exhibited lower marital opinions on marriage, distribution of authority between
attitude scores than other students.
spouses, and domestic violence indicated that they are
more inclined to the traditional view. In this regard, as
Content courtesy of Springer Nature, terms of use apply. Rights reserved.
Sonkaya and Öcal BMC Public Health (2024) 24:3347 Page 9 of 10
parents of the future, young people are the group that 3. Gershman H. The volution of gender identity. Bull N Y Acad Med. 1967;43(11):1000–18.
needs to be prioritized, and it is essential to address their 4. Aylaz R, Güneş G, Uzun Ö, et al. Opinions of university students on gender
negative social prejudices and traditional taboos regard-
roles. STED. 2014;23(5):183–9.
ing marriage and gender equality. Due to the time and 5. Akin A, Demirel S. Toplumsal cinsiyet kavramı ve sağlığa etkileri [Concept
of gender and its effects on health]. Cumhuriyet Universitesi Tip Fakultesi
cost constraints, the study was conducted only with
Dergisi Halk Sagligi Ozel Eki. 2003;25(4):73–82.
students from the health department of two different 6. Kimberly A, Mahaffy K. The gendering of adolescents’ childbearing and
universities. Therefore, to generalize the findings to the
educational plans: reciprocal effects and the influence of social context. Sex
Roles. 2002;46(11/12):403–17.
entire society, new studies should be conducted with 7. Öngen B, Aytaç S. Attitudes of university students regarding to gender roles
larger sample groups in different regions. Additionally,
and relationship with life values. Istanbul J Sociol Stud. 2013;(48):1–18.
addressing other demographic characteristics in these 8. Yılmaz DV, Zeyneloğlu S, Kocaöz S, et al. Views on gender roles of university
students. J Hum Sci. 2009;6(1):775–92.
studies will contribute to a more detailed understanding 9. Esen E, Soylu Y, Siyez DM, et al. Examination of gender perception of univer- of the topic.
sity students according to sex and sex roles. E-International J Educational Res.
2017;8(1):46–63. https:/ /doi.or g/10.19 160/ 5000197327.
10. Addis ME, Reigeluth CS, Schwab JR. Social norms, social construction, and the Limitations
psychology of men and masculinity. In APA Handbook for the Psychology of
This study has several limitations. First, the cross-sec-
Men and Masculinities (Eds SR Wester, J Wong). 2016, 81–104. Washington
tional nature of the study precludes any claim of causality.
DC, American Psychological Association.
11. Good GE, Thomson DA, Brathwaite AD. Men and therapy: critical concepts,
Secondly, the data were collected in only two universi-
theoretical frameworks, and research recommendations. J Clin Psychol.
ties in the Black Sea region of Turkey and may not allow 2005;61:699–711.
generalization of the results to all university students in 12. Kantar A, Yalçın İ. Masculinity and seeking psychological help: a review based
on Social Identity Theory. Psikiyatride Güncel Yaklaşımlar. 2023;15(4):677–86.
Turkey. Therefore, a longitudinal study on university stu-
13. World Health Organization (WHO). Gender and health, technical paper.
dents’ marriage attitudes, gender roles, and related fac- Switzerland; 1998. pp. 5–20. tors is encouraged.
14. Karabacak A, Ciftci M. Examination of the relationship between marital atti-
tudes and irrational romantic relationship beliefs of university students. Stud Psychol. 2016;36(2):25–43. Acknowledgements
15. Sassler S, Schoen R. The effect of attitudes and economic activity on mar- Not applicable.
riage. J Marriage Fam. 1999;61(1):147–59.
16. Barber JS, Axinn WG. Gender role attitudes and marriage among young Author contributions
women. Sociol Q. 1998;39(1):11–31.
Conceptualization: İSZ; Data curation: İSZ; Formal analysis: İSZ; ÜÖN;
17. Berı N, Berı A. Perception of single women towards marriage, career and
Investigation: İSZ; ÜÖN; Methodology: İSZ; ÜÖN; Project administration: İSZ;
education. Eur Acad Res. 2013;1(6):855–69.
ÜÖN; Writing - original draft: İSZ; and Writing - review & editing: İSZ; ÜÖN.
18. Bener Ö, Günay G. Gençlerin evlilik ve aile yaşamına ilişkin tutumları. Karabük
Üniversitesi Sosyal Bilimler Enstitüsü Dergisi. 2013;3(1):1–16. Funding
19. Bayoğlu F, Atli A. Inonu Marriage attitude scale: validity and reliability analysis.
No funding was used to support this research and/or the preparation of the
Ege Eğitim Dergisi. 2014;15(2):397–415. https:/ /doi.or g/10.12 984/ eed.79063. manuscript.
20. Zeyneloğlu S. Ankara’da hemşirelik öğrenimi gören üniversite öğrencilerinin
toplumsal cinsiyet rollerine ilişkin tutumları. Doktora Tezi, Hacettepe Üniversi- Data availability
tesi Sağlık Bilimleri Enstitüsü. Ankara; 2008.
No datasets were generated or analysed during the current study.
21. Kök G, Karaman S, Özer E, et al. Evaluation of the relationship between atti-
tudes towards gender roles and attitudes towards dating violence of a group Declarations
of university students. J Hacettepe Univ Fac Nurs. 2022;9(2):167–76. h t t p s :/ / d
o i . o r g / 1 0 .3 1 1 2 5 / h u n h e m s ir e .1 1 6 7 2 8 6 .
Ethics approval and consent to participate
22. Bayezit G. A study about the attitudes -sociology- education students
Before conducting the study, Amasya University ethics committee approval
towards the gender roles in-sociocultural factors (Bingol University Practice).
was obtained (dated 16.02.2022 and numbered 30/23), and informed consent
J Bingöl Stud. 2021;8(1):67–100. https:/ /doi.or g/10.53 440/ bad.1012856.
was received from all participants.
23. Akgül H. Examination of the attitudes of X, Y and Z generation individuals
regarding gender roles. Int J Educational Spectr. 2022;4(1):31–42. h t t p s :/ / d o i . Consent for publication
o r g / 1 0 .4 7 8 0 6 / ij e s a c a d e m ic .1 0 3 9 1 8 0 . Not applicable.
24. Koca M. The connection of gender role attitudes of the unıversity students
to the satisfaction with life and aggression. Pamukkale Univ J Social Sci Inst. Competing interests
2021;42123–40. https:/ /doi.or g/10.30 794/ pausbed.648399.
The authors declare no competing interests.
25. Kerkez M, Argun D, Güneş Ş et al. Genç yetişkin bireylerin toplumsal cinsiyete
ilişkin tutumları. International Conference on Engineering, Natural and Social Sciences. 2023;1:700–705.
Received: 10 September 2024 / Accepted: 29 November 2024
26. Çimen ÖF, Bulut Serin N. University students’ attitudes towards gender
roles predicting their value orientation. Participatory Educational Res. 2021;8(4):171–85.
27. Geçici F, Göllüce A, Güvenç E, et al. The attitudes of the university stu-
dents’ regarding the gender roles. Suleyman Demirel Univ J Health Sci. References
2017;8(1):21–7. https:/ /doi.or g/10.22 312/ sdusbed.303098.
1. Akbaş M, Sürücü ŞG, Köroğlu CO, et al. Factors affecting marriage attitudes of
28. Tajfel H, Billig M, Bundy RP. el al. Social categorization and intergroup behav-
university students. Cukurova Med J. 2019;44(1):93–100. h t t p s :/ / d o i . o r g / 1 0 .1 7
iour. European Journal of Social Psychology. 1971;1:149–177.
8 2 6 / c u m j. 4 4 1 0 2 2 .
29. Tajfel H. Social categorization, English manuscript of La catégorization sociale.
2. Günay G, Bener Ö. Attitudes of young adults towards marriage and family life.
Introduction à La Psychologie Sociale. 1972;1.
Karabük Univ J Inst Social Sci. 2013;3(1):1–16. https:/ /doi.or g/10.14 230/ joiss9.
Content courtesy of Springer Nature, terms of use apply. Rights reserved.
Sonkaya and Öcal BMC Public Health (2024) 24:3347 Page 10 of 10
30. Tajfel H, Turner JC. An integrative theory of intergroup conflict. In: Austin WG,
37. Vergauwen J, Neels K, Wood J. Educational differentials in cohabitors’ mar-
Worchel S, editors. The social psychology of intergroup relations. Monterey,
riage intentions at different childbearing stages in seven European countries.
CA: Brooks/Cole; 1979. pp. 33–47.
Soc Sci Res. 2017;6:5253–267.
31. Fiskin G, Sarı E. Evaluation of the relationship between youth attitudes
38. Yalçın H, Arslan Kılıçoğlu E, Acar A. Youth attitudes towards marriage and
towards marriage and motivation for childbearing. Child Youth Serv Rev.
gender roles. J Int Social Res. 2017;10(52). 2021;121:1–6.
39. Akpınar B, Kırlıoğlu M. Bazı değişkenler açısından evlilik uyumunun incelen-
32. Kantar A, Yalçın İ. Masculine gender role stress and attitudes towards seeking
mesi ve toplumsal cinsiyet rolleri tutumunun evlilik uyumuna etkisi. Selçuk
psychological help: serial mediation by self-stigma and self-compassion. Curr
Üniversitesi Sosyal Bilimler Meslek Yüksekokulu Dergisi. 2020;23(2):736–46. Psychol. 2024;43:6114–24.
40. Bowen GL, Orthner DK. Sex-role congruency and marital quality. J Marriage
33. Komiya N, Good GE, Sherrod NB. Emotional openness as a predictor of col- Fam. 1983; 223–30.
lege students’ attitudes toward seeking psychological help. J Couns Psychol. 2000;47:138–43.
34. Cuthbert KMB, Amadu AM. Attitude towards marriage and family formation
among Ghanaian tertiary students: a study of university for development Publisher’s note
studies. J Asian Dev Stud. 2014;3(2):122–34.
Springer Nature remains neutral with regard to jurisdictional claims in
35. Görkem A, Bengisoy A. Investigating the attitude of pcg university
published maps and institutional affiliations.
students towards their parents and towards marriage. High Educ Stud. 2018;8(1):18–24.
36. Keshavarz M, Shariati M, Ebadi A, et al. Desire and attitude to marriage among
unmarried Iranian youth: a qualitative study. Int J Women’s Health Reprod Sci. 2018;6(4):425–31.
Content courtesy of Springer Nature, terms of use apply. Rights reserved. Terms and Conditions
Springer Nature journal content, brought to you courtesy of Springer Nature Customer Service Center GmbH (“Springer Nature”).
Springer Nature supports a reasonable amount of sharing of research papers by authors, subscribers and authorised users (“Users”), for small-
scale personal, non-commercial use provided that all copyright, trade and service marks and other proprietary notices are maintained. By
accessing, sharing, receiving or otherwise using the Springer Nature journal content you agree to these terms of use (“Terms”). For these
purposes, Springer Nature considers academic use (by researchers and students) to be non-commercial.
These Terms are supplementary and will apply in addition to any applicable website terms and conditions, a relevant site licence or a personal
subscription. These Terms will prevail over any conflict or ambiguity with regards to the relevant terms, a site licence or a personal subscription
(to the extent of the conflict or ambiguity only). For Creative Commons-licensed articles, the terms of the Creative Commons license used will apply.
We collect and use personal data to provide access to the Springer Nature journal content. We may also use these personal data internally within
ResearchGate and Springer Nature and as agreed share it, in an anonymised way, for purposes of tracking, analysis and reporting. We will not
otherwise disclose your personal data outside the ResearchGate or the Springer Nature group of companies unless we have your permission as
detailed in the Privacy Policy.
While Users may use the Springer Nature journal content for small scale, personal non-commercial use, it is important to note that Users may not:
1. use such content for the purpose of providing other users with access on a regular or large scale basis or as a means to circumvent access control;
2. use such content where to do so would be considered a criminal or statutory offence in any jurisdiction, or gives rise to civil liability, or is otherwise unlawful;
3. falsely or misleadingly imply or suggest endorsement, approval , sponsorship, or association unless explicitly agreed to by Springer Nature in writing;
4. use bots or other automated methods to access the content or redirect messages
5. override any security feature or exclusionary protocol; or
6. share the content in order to create substitute for Springer Nature products or services or a systematic database of Springer Nature journal content.
In line with the restriction against commercial use, Springer Nature does not permit the creation of a product or service that creates revenue,
royalties, rent or income from our content or its inclusion as part of a paid for service or for other commercial gain. Springer Nature journal
content cannot be used for inter-library loans and librarians may not upload Springer Nature journal content on a large scale into their, or any
other, institutional repository.
These terms of use are reviewed regularly and may be amended at any time. Springer Nature is not obligated to publish any information or
content on this website and may remove it or features or functionality at our sole discretion, at any time with or without notice. Springer Nature
may revoke this licence to you at any time and remove access to any copies of the Springer Nature journal content which have been saved.
To the fullest extent permitted by law, Springer Nature makes no warranties, representations or guarantees to Users, either express or implied
with respect to the Springer nature journal content and all parties disclaim and waive any implied warranties or warranties imposed by law,
including merchantability or fitness for any particular purpose.
Please note that these rights do not automatically extend to content, data or other material published by Springer Nature that may be licensed from third parties.
If you would like to use or distribute our Springer Nature journal content to a wider audience or on a regular basis or in any other manner not
expressly permitted by these Terms, please contact Springer Nature at
onlineservice@springernature.com