How to Write A Graph - Business English | Trường Đại học Hùng Vương
How to Write A Graph - Business English | Trường Đại học Hùng Vương được sưu tầm và soạn thảo dưới dạng file PDF để gửi tới các bạn sinh viên cùng tham khảo, ôn tập đầy đủ kiến thức, chuẩn bị cho các buổi học thật tốt. Mời bạn đọc đón xem!
Môn: Business English( TA1901) 89 tài liệu
Trường: Trường Đại học Hùng Vương 164 tài liệu
Tác giả:


Preview text:
HOW TO WRITE A GRAPH
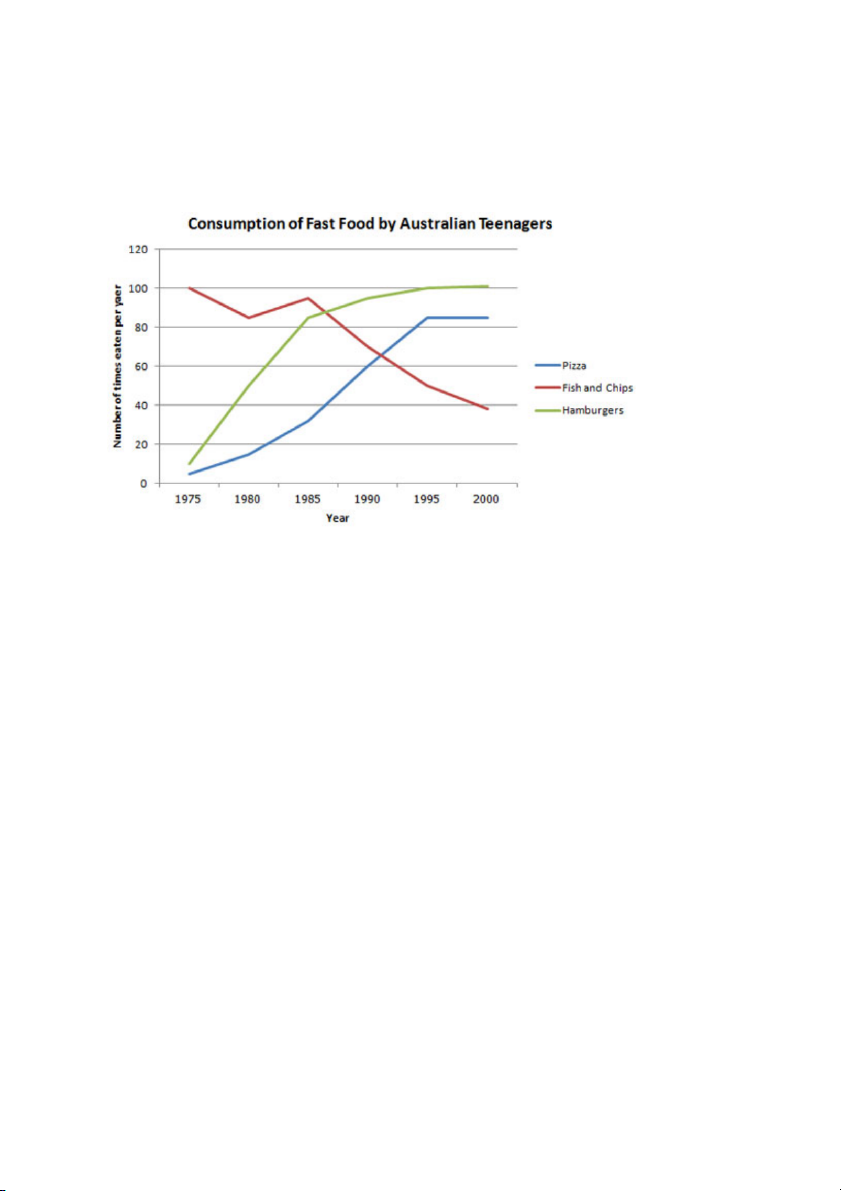
The line graph below shows changes in the amount and type of fast food consumed by
Australian teenagers from 1975 to 2000.
Summarize the information by selecting and reporting the main features and make comparisons where relevant.
Write at least 150 words. There are three basic things Introduce the graph
You need to begin with one or two sentences that state what the task shows. To do
this, paraphrase the title of the graph, making sure you put in a time frame if there is one.
Here is an example for the above line graph:
The line graph compares the fast food consumption of teenagers in Australia
between 1975 and 2000, a period of 25 years.
You can see this says the same thing as the title, but in a different way. Give an overview
You also need to state what the main trend or trends in the graph are. Don’t give
detail such as data here – you are just looking for something that describes what is happening overall.
One thing that stands out in this graph is that one type of fast food, fish and chips,
fell over the period, whilst the other two increased, so this would be a good overview. Here is an example:
Overall, the consumption of fish and chips declined over the period, whereas the
amount of pizza and hamburgers that were eaten increased.
→ This covers the main changes that took place over the whole period.
You may sometimes see this overview as a conclusion. It does not matter if you put it in
the conclusion or the introduction, but you should provide an overview in one of these places. Give the detail 1
When giving more specific detail in the body paragraphs, you must make reference to the data.
- The key to organizing your body paragraphs is to group data together where there are patterns.
- To do this you need to identify any similarities and differences. Look at the
graph – what things are similar and what things are different?
→ As we have already identified in the overview, the consumption of fish and
chips declined over the period, whereas the amount of pizza and hamburgers that were eaten increased.
→ So it is clear that pizza and hamburgers were following a similar pattern, but
fish and chips were different. On this basis, you can use these as your ‘groups’, and focus
one paragraph on fish and chip and the other one on pizza and hamburgers.
Here is an example of the first paragraph:
In 1975, the most popular fast food with Australian teenagers was fish and
chips, being eaten 100 times a year. This was far higher than Pizza and hamburgers,
which were consumed approximately 5 times a year. However, apart from a brief rise
again from 1980 to 1985, the consumption of fish and chips gradually declined over
the 25 year timescale to finish at just under 40.
As you can see, the focus is on fish and chips. This does not mean you should not
mention the other two foods, as you should still make comparisons of the data as the questions asks.
The second body then focuses on the other foods:
In sharp contrast to this, teenagers ate the other two fast foods at much higher
levels. Pizza consumption increased gradually until it overtook the consumption of fish
and chips in 1990. It then levelled off from 1995 to 2000. The biggest rise was seen in
hamburgers as the occasions they were eaten increased sharply throughout the 1970’s
and 1980’s, exceeding that of fish and chips in 1985. It finished at the same level that
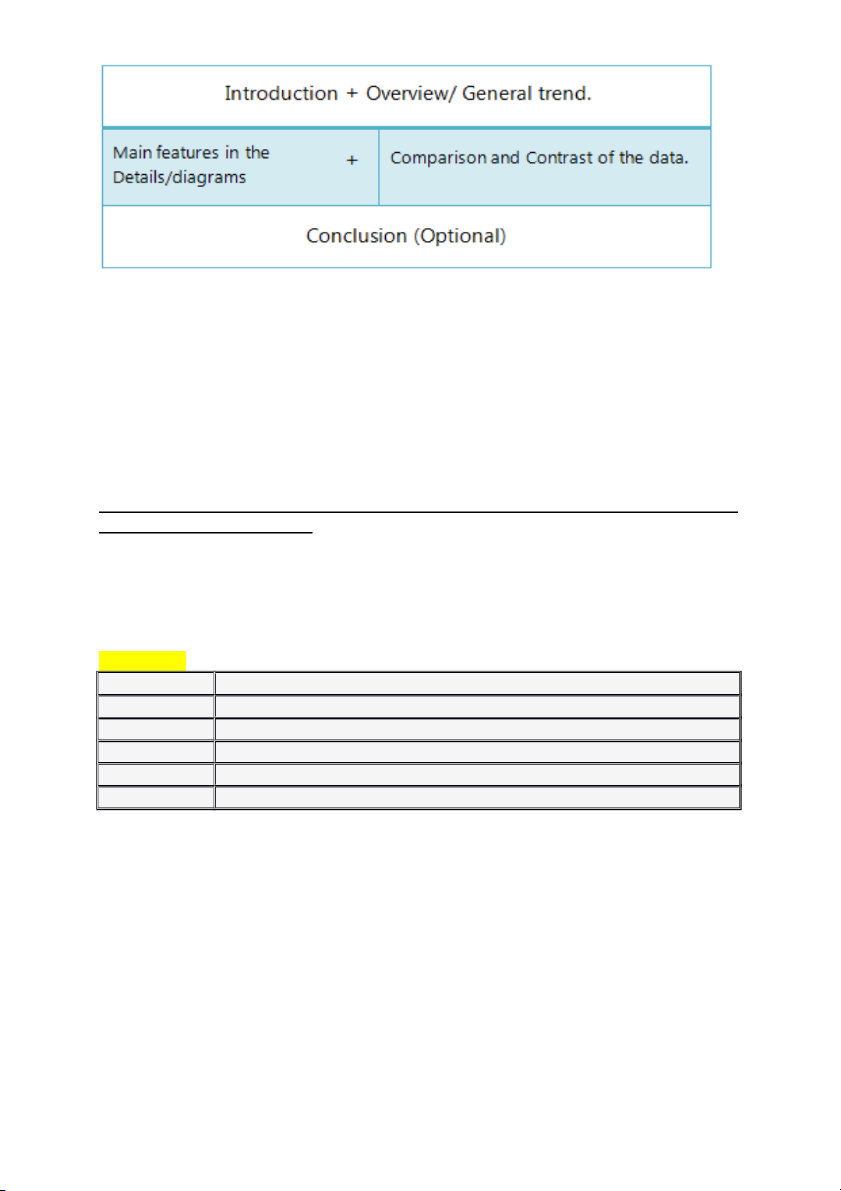
fish and chips began, with consumption at 100 times a year. OUT LINE 1. Introduction:
Introduction (never copy word for word from the question) + Overview/ General trend
(what the diagrams indicate at a first glance). 2. Reporting Details:
+ Main features in the Details
+ Comparison and Contrast of the data. (Do not give all the figures.)
+ Most striking features of the graph. 3. Conclusion:
Conclusion (General statement + Implications, significant comments)
[The conclusion part is optional.] 2 Tips:
1. Write introduction and General trend in the same paragraph. Some students prefer to
write the 'General Trend' in a separate paragraph and many teachers suggest both of them
be written in a single paragraph. Unless you have a really good reason to write the
general trend in the second paragraph, try to write them both in the first paragraph.
However, this is just a suggestion, not a requirement.
2. Your 'Introduction (general statement + overall trend/ general trend) should have 75 - 80 words.
3. DO NOT give numbers, percentages or quantity in your general trend. Rather give the
most striking feature of the graph that could be easily understood at a glance. Thus it is suggested to AVOID -
"A glance at the graphs reveals that 70% male were employed in 2001 while 40 thousand women in this year had jobs."
And use a format /comparison like the following:
"A glance at the graphs reveals that more men were employed than their female
counterpart in 2001 and almost two-third females were jobless in the same year. "
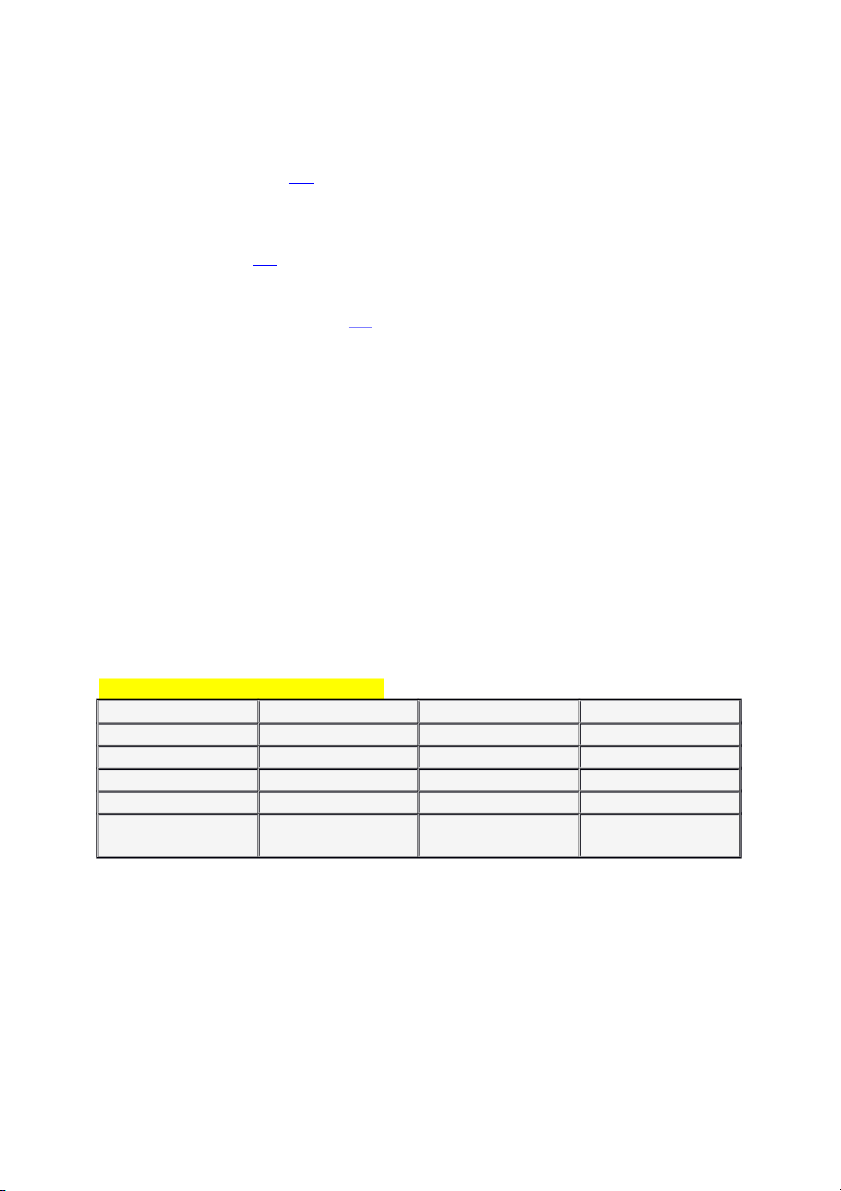
Words and phrases used in writing graph I. Up Verbs Verbs Example soar
the use of water soared in March leap
the prices leapt to 90% in one year climb
populations climbed to over one million by 1980 rocket
use of cars rocketed in the first decade surge
a surge of migration is seen in November Notes:
“Soar “and “rocket” are both very strong words that describe large rises. “Rocket” is
more sudden. You probably do not need to qualify these verbs with adverbs.
“Leap” shows a large and sudden rise. Again, you probably do not need to qualify it with an adverb.
“Climb” is a relatively neutral verb that can be used with the adverbs below. VOCABULARY 3
1. soar /sɔːr/ [intransitive]: if the value, amount or level of something soars, it rises very quickly= rocket
→ soaring costs/prices/temperatures
E.g. Air pollution will soon soar above safety levels. / Unemployment has soared to 18 per cent. 2. rocket / r ˈ k
ɑː ɪt/ (+ adv./prep.): to increase very quickly and suddenly = shoot up
E.g. rocketing prices / Unemployment has rocketed up again. / The total has rocketed
from 376 to 532. / Sales have rocketed by 213 percent.
3. leap (in something) (from…) (to…): to increase suddenly and by a large amount = shoot up
E.g. The shares leapt in value from 476p to close at 536p. / The company saw pre-tax
profits leap to £14.5 million in 2004.
→ leap in something (n)
E.g. a leap in prices / a dramatic leap in the number of people out of work
→ leap (from something) (to something) (n): a leap from $632 to $735
4. climb (+ adv./prep.) (v): to increase in value or amount
E.g. The paper's circulation continues to climb. / Interest rates climbed to 8 per cent. /
The temperature had climbed above 30 degrees. / Prices have climbed sharply in recent
months. / Membership is climbing steadily.
→ climb (n): an increase in value or amount
E.g. the dollar’s climb against the euro / the upward climb of interest rates / a steady
climb in the cost of travel 5. surge /s rd ɜː /
ʒ (v): (of prices, profits, etc.) to suddenly increase in value
E.g. Share prices surged. / Inflation surged 2 500 per cent in 2016. / Profits from
cigarettes surged to $225m last year.
→ surge in/of something (n): sudden increase in the amount or number of something
E.g. a surge in consumer spending / We are having trouble keeping up with the recent
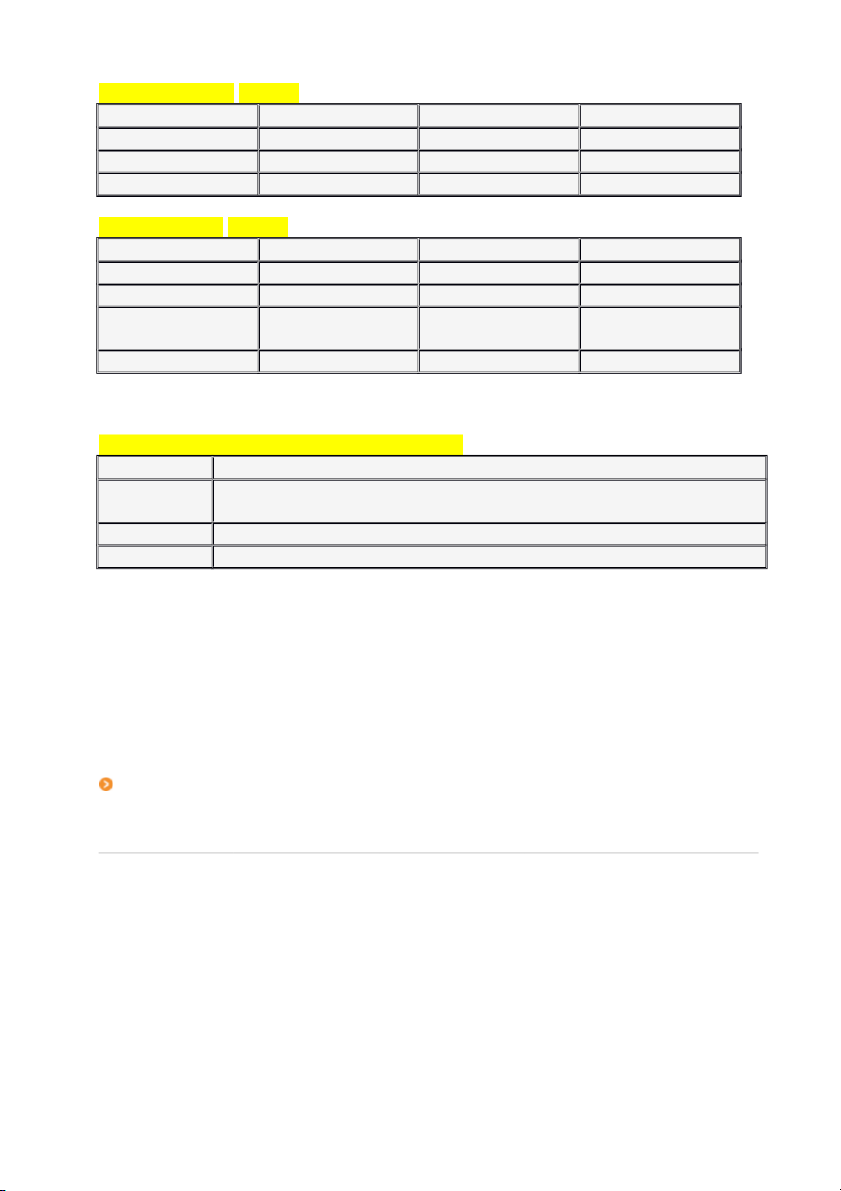
surge in demand. / After an initial surge of interest, there has been little call for our II. Down verbs Verbs Example sink
The cost of housing sunk after 2008 slip back
Use of electricity slipped back to 50 in May dip Divorce rate dipped in the 60s drop
A drop in crime can be seen last year plummet
Tourists to the city plummets after September plunge
Our income has plunged dramatically Notes:
- “Plummet” is the strongest word here. It means to fall very quickly and a long way.
- “Drop” and “drop” are normally used for fairly small decreases
- “Slip back” is used for falls that come after rises
- “Drop” and “Dip” are also frequently used as nouns: “a slight dip” “a sudden drop” VOCABULARY 4
1. sink [intransitive]: to decrease in amount, volume, strength, etc.
E.g. The pound has sunk to its lowest recorded level against the dollar.
2. slip back (v): if sth slips back, it falls after a period of rising
E.g. Use of electricity slipped back to 50 in May 3. dip (+ adv
./prep.) [intransitive, transitive]: to go downwards or to a lower level; to
make something do this = fall
E.g. The sun dipped below the horizon. / Sales for this quarter have dipped from 38.7 million to 33 million.
→ dip in something (n): a decrease in the amount or success of something, usually for only a short period = fall
E.g. Share prices have taken a slight dip. / a sharp dip in profits
4. drop (in something) (by something) [intransitive, transitive]: to become or make
something weaker, lower or less = fall
E.g. Shares dropped in price by 14p. The temperature has dropped considerably. / Error
rates have dropped dramatically.
- drop by something: The price of shares dropped by 14p.
- drop against something: The dollar dropped sharply against the euro.
→ drop in something [countable, usually singular]: a fall or reduction in the amount, level or number of something
E.g. a dramatic / sharp/steep drop in profits / We've seen a 15 per cent drop in price since May.
- drop against something: The pound has suffered a big drop against the euro.
5. plummet (by) sth /ˈpl m ʌ t/
ɪ (v): to go down in amount or value very quickly and suddenly = plunge
E.g. House prices have plummeted in recent months.
E.g. First-half advertising revenues plummeted 13%, compared with the same period a year ago.
- plummet to sth: The food retailer's shares plummeted 17.5p to 227.5p.
6. plunge (v) (of prices, temperatures, etc.) to decrease suddenly and quickly
E.g. This year profits plunged by 40 per cent.
III. Adjectives and adverbs of Degree Adjective Example Adverb Example Significant
A significant change Significantly Changed significantly Dramatic A dramatic shift Dramatically Shifts dramatically Sudden A sudden rise Suddenly Has risen suddenly Substantial A substantial gain Substantially Gained substantially Sharp A sharp decrease Sharply Had decreased sharply Notes:
- “sudden” and “sharp” can be used for relatively minor changes that happen quickly
- “spectacular” and “dramatic” are very strong words only used for big changes
- “substantial” /səb stæn ˈ
ʃ l/ (adj): large in amount, value or importance = “considerable”
E.g. substantial sums of money / a substantial change 5 Steady Adjectives/adverbs Adjective Example Adverb Example Consistent A consistent flow Consistently Flowed consistently Steady A steady movement Steadily Moved steadily Constant Constant shift Constantly Sifted constantly Small adjectives/adverbs Adjective Example Adverb Example Slight A slight rise Slightly Rose slightly Gradual A gradual fall Gradually Has fallen gradually Marginal A marginal change Marginally Had changed marginally Modest A modest increase Modestly Increases modestly Notes:
- “marginal” is a particularly useful word for describing very small changes
Adjectives used to describe more general trends Adjective Example Upward
By looking at the five data points, there appears to be a clear upward pattern in prices Downward
Over the past quarter century there is a downward trend in use of pesticides Overall
The overall shift in the market seems to favour the use of nuclear power Notes:
- “overall” can be used to describe changes in trend over the whole period: very useful in introductions and conclusions
- “upward” and “downward” are adjectives: the adverbs are “upwards” and “downwards”
IV. The general format for writing academic writing task 1 is as follows:
Introduction + Basic/ General Trends + Details Description + Summary (optional).
Each part has a specific format and therefore being equipped with the necessary
vocabulary will help you answer the task 1 efficiently and will save a great deal of time.
Vocabulary for the Introduction Part: Starting Presentation Verb Description Type
The/ the given / diagram / table / shows / the comparison of… the supplied / figure / represents / the differences… the presented / illustration / depicts / the changes... the shown / the graph / chart / enumerates / the number of… provided flow chart / illustrates / information on… picture/ presents/ gives / data on… 6 presentation/ pie provides / the proportion of… chart / bar graph/ delineates/ the amount of… column graph / outlines/ information on... line graph / table describes / data about... data/ data / delineates/ comparative data... information / expresses/ the trend of... pictorial/ process denotes/ the percentages of... diagram/ map/ compares/ shows the ratio of... pie chart and contrast / how the... table/ bar graph indicates / figures and pie chart ... / gives data on / gives information on/ presents information about/ shows data about/ demonstrates/ sketch out/ summarises... VOCABULARY
1. enumerate sth /ɪˈnu məre ː t/
ɪ (formal): to name things on a list one by one
E.g. She enumerated the main points.
2. delineate sth /dɪˈlɪnieɪt/ (formal): to describe, draw or explain something in detail
E.g. Our objectives need to be precisely delineated. / The ship's route is clearly delineated on the map.
3. sketch something (out): to give a general description of something, giving only the basic facts = outline
E.g. She sketched out her plan for tackling the problem.
4. ratio of A to B / re ˈ ɪʃiə /
ʊ (n): the relationship between two groups of people or things
that is represented by two numbers showing how much larger one group is than the other
E.g. What is the ratio of men to women in the department?
E.g. The ratio of applications to available places currently stands at 100:1. Example :
1. The diagram shows employment rates among adults in four European countries from 1925 to 1985.
2. The given pie charts represent the proportion of male and female employees in 6 broad
categories, dividing into manual and non-manual occupations in Australia, between 2010 and 2015.
3. The chart gives information about consumer expenditures on six products in four
countries namely Germany, Italy, Britain and France.
4. The supplied bar graph compares the number of male and female graduates in three
developing countries while the table data presents the overall literacy rate in these countries. 7
5. The bar graph and the table data depict the water consumption in different sectors in five regions.
6. The bar graph enumerates the money spent on different research projects while the
column graph demonstrates the fund sources over a decade, commencing from 1981.
7. The line graph delineates the proportion of male and female employees in three
different sectors in Australia between 2010 and 2015.
* Vocabulary for the General Trend Part:
In general, In common, Generally speaking, Overall, It is obvious, As is observed, As a
general trend, As can be seen, As an overall trend, As is presented, It can be clearly seen
that, At the first glance, it is clear, At the onset, it is clear that, A glance at the graphs reveals that... Example:
1. In general, the employment opportunities increased till 1970 and then declined throughout the next decade.
2. As is observed, the figures for imprisonment in the five mentioned countries show no
overall pattern, rather shows the considerable fluctuations from country to country.
3. Generally speaking, citizens in the USA had a far better life standard than that of remaining countries.
4. As can be seen, the highest number of passengers used the London Underground
station at 8:00 in the morning and at 6:00 in the evening.
4. Generally speaking, more men were engaged in managerial positions in 1987 than that
of women in New York this year.
5. As an overall trend, the number of crimes reported increased fairly rapidly until the
mid-seventies, remained constant for five years and finally, dropped to 20 cases a week after 1982.
6. At a first glance, it is clear that more percentages of native university pupils violated
regulations and rules than the foreign students did during this period.
7. At the onset, it is clear that drinking in public and drink driving were the most
common reasons for US citizens to be arrested in 2014.
8. Overall, the leisure hours enjoyed by males, regardless of their employment status,
was much higher than that of women.
V. Vocabulary to Start the Report Body:
Just after you finish writing your 'Introduction' (i.e. General Statement + General
overview/ trend), you are expected to start a new paragraph to describe the main features
of the diagrams. This second paragraph is called the 'Body Paragraph / Report Body".
You can have a single body paragraph/ report body or up to 3, (not more than 3 in any
case) depending on the number of graphs provided in the question and the type of these graphs.
There are certain phrases you can use to start your body paragraph and following is a list of such phrases ---
1. As is presented in the diagram(s)/ graph(s)/ pie chart(s)/ table...
2. As (is) shown in the illustration... 3. As can be seen in the... 4. As the diagrams suggest... 5. According to the... 8 6. Categorically speaking...
7. Getting back to the details...
8. Now, turning to the details...
9. The table data clearly shows that...
10. The diagram reveals that... 11. The data suggest that...
12. The graph gives the figure...
13. It is interesting to note that...
14. It is apparently seen that... 15. It is conspicuous that...
16. It is explicitly observed that... 17. It is obvious...
18. It is clear from the data...
19. It is worth noticing that...
20. It is crystal clear/ lucid that...
21. It can be clearly observed that...
22. It could be plainly viewed that...
23. It could be noticed that... 24. We can see that... PHẦN THAM KHẢO THÊM
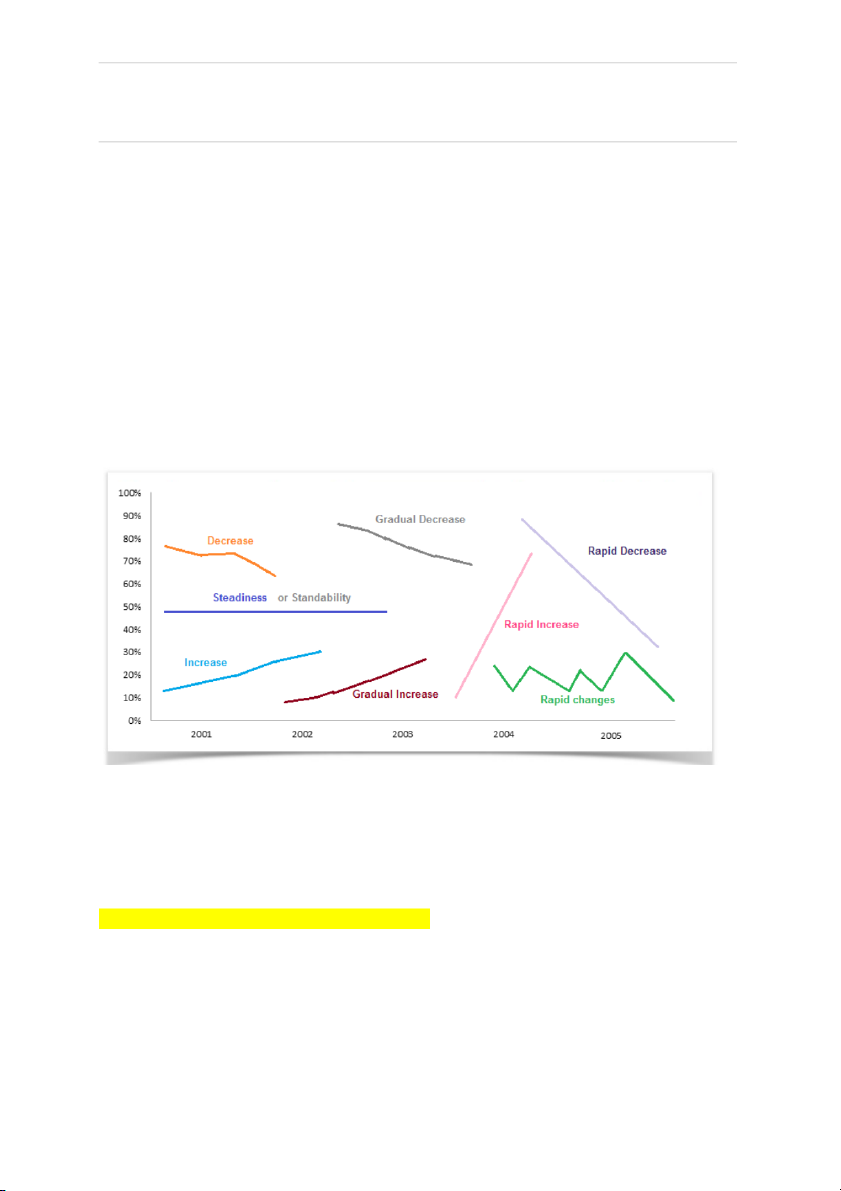
Vocabulary to show the changes: Trends Verb form Noun Form Increase
rise / increase / go up / uplift / a rise / an increase / an
rocket(ed) / climb / upsurge / soar/ upward trend / a growth / a shot up/ improve/ jump/ leap/ leap / a jump / an move upward/ skyrocket/ soar/ improvement/ a climb. surge. Decrease
fall / decrease / decline / plummet / a fall / a decrease / a
plunge / drop / reduce / collapse / reduction / a downward
deterioriate/ dip / dive / go down / trends /a downward
take a nosedive / slum / slide / go tendency / a decline/ a into free-fall.
drop / a slide / a collapse / a downfall. Steadiness
unchanged / level out / remain a steadiness/ a plateau / a
constant / remain steady / plateau / stability/ a static
remain the same / remain stable / remain static Gradual an upward trend / an upward increase ------------ tendency / a ceiling trend 9 Gradual a downward trend / a decrease ------------ downward tendency / a descending trend Standability/ level(ed) off / remain(ed) Flat
constant / remain(ed) unchanged / No change, a flat, a plateau.
remain(ed) stable / prevail(ed)
consistency / plateaued / reach(ed) a plateau / stay(ed) uniform /immutable / level(ed) out/
stabilise/ remain(ed) the same. Examples:
1. The overall sale of the company increased by 20% at the end of the year.
2. The expenditure of the office remained constant for the last 6 months but the profit rose by almost 25%.
3. There was a 15% drop in the ratio of student enrollment in this University.
4. The population of the country remained almost the same as it was 2 years ago.
5. The population of these two cities increase significantly in the last two decades and it
is expected that it will remain stable during the next 5 years. Tips:
1. Use 'improve' / 'an improvement' to describe a situation like economic condition or
employment status. To denote numbers use other verbs/nouns like increase.
2. Do not use the same word/ phrase over and over again. In fact, you should not use a
noun or verb form to describe a trend/change more than twice; once is better!
3. To achieve a high band score you need to use a variety of vocabulary as well as sentence formations.
Vocabulary to represent changes in graphs: Type of Adverb form Adjective form Change 10 Rapid change dramatically / rapidly /
dramatic / rapid / sharp / quick /
sharply / quickly / hurriedly / hurried / speedy / swift / speedily / swiftly / significant / considerable / significantly/ considerably / substantial / noticable. substantioally / noticably. Moderate moderately / gradually /
moderate / gradual / progressive change progressively / sequentially. / sequential. Steady change steadily/ ceaselessly. steady/ ceaseless. Slight change slightly / slowly / mildly /
slight / slow / mild / tedious. tediously. Example:
1. The economic inflation of the country increased sharply by 20% in 2008.
2. There was a sharp drop in the industrial production in the year 2009.
3. The demand for new houses dramatically increased in 2002.
4. The population of the country dramatically increased in the last decade.
5. The price of the oil moderately increased during the last quarter but as a consequence,
the price of daily necessity rapidly went up.
Vocabulary to represent frequent changes in graphs:
Type of Change Verb form Noun form
Rapid ups and wave / fluctuate / oscillate / waves / fluctuations / downs vacillate / palpitate oscillations / vacillations / palpitations Example:
1. The price of the goods fluctuated during the first three months in 2017.
2. The graph shows the oscillations of the price from 1998 to 2002.
3. The passenger number in this station oscillates throughout the day and in early
morning and evening, it remains busy.
4. The changes of car production in Japan shows a palpitation for the second quarter of the year.
5. The number of students in debate clubs fluctuated in different months of the year and
rapid ups and downs could be observed in the last three months of this year. Tips:
1. 4. DO NOT try to present every single data presented in a graph. Rather pick 5-7 most
significant and important trends/ changes and show their comparisons and contrasts.
2. The question asks you to write a report and summarise the data presented in graphs(s).
This is why you need to show the comparisons, contrasts, show the highest and lowest
points and most striking features in your answer, not every piece of data presented in the diagram(s).
Types of Changes/ Differences and Vocabulary to present them: 11
Great change / Huge difference: Adjectives Adverbs
Overwhelming Overwhelmingly Substantial Substantially Enormous Enormously
Big change / Big difference: Adjectives Adverbs Significant Significantly Considerable Considerably
Medium change / Moderate difference: Adjectives Adverbs Somewhat Somewhat Moderate Moderately
Minor change / Small difference: Adjectives Adverbs Fractional Fractionally Marginal Marginally Slight Slightly
Dates, Months & Years related vocabulary and grammar:
» From 1990 to 2000, Commencing from 1980, Between 1995 and 2005, After 2012.
» By 1995, In 1998, In February, Over the period, During the period, During 2011.
» In the first half of the year, For the first quarter, The last quarter of the year, During the first decade.
» In the 80s, In the 1980s, During the next 6 months, In the mid-70s, Next 10 years,
Previous year, Next year, Between 1980 - 1990.
» Within a time span of ten years, within five years.
» Next month, Next quarter, Next year, Previous month, Previous year. » Since, Then, From.
Percentage, Portion and Numbers: Percentages:
10% increase, 25 percent decrease, increased by 15%, dropped by 10 per cent, fall at
50%, reached to 75%, tripled, doubled, one-fourth, three-quarters, half, double fold,
treble, 5 times higher, 3 timers lower, declined to about 49%, stood exactly at 43%. Fractions: 4% = A tiny fraction. 24% = Almost a quarter. 25% Exactly a quarter. 26% = Roughly one quarter.
32% Nearly one-third, nearly a third.
49% = Around a half, just under a half. 50% Exactly a half. 51% = Just over a half. 73% = Nearly three quarters.
77% = Approximately three quarter, more than three-quarter. 12
79% = Well over three quarters. Proportions:
2% = A tiny portion, a very small proportion.
4% = An insignificant minority, an insignificant proportion.
16% = A small minority, a small portion. 70% = A large proportion.
72% = A significant majority, A significant proportion.89% = A very large proportion. 89% = A very large proportion.
Words/ Phrases of Approximation - Vocabulary: » Approximately » Nearly » Roughly » Almost » About » Around » More or less » Just over » Just under » Just around » Just about » Just below » A little more than » A little less than.
What criteria would a band 9 graph response satisfy? Task Achievement:
A) Fully satisfies all the requirements of the task.
B) Clearly presents a fully developed response.
What will be assessed by the examiner?
a) How appropriately, accurately and relevantly you fulfil your task requirements.
b) How accurately you write your report and how appropriately you present the data
(compare/ contrast/ show the most striking trends/ features/ data.) Coherence and Cohesion:
A) Uses cohesion in such a way that it attracts no attention.
B) Skillfully manages paragraphing.
What will be assessed by the examiner?
a) No misinterpretation and presentation of data and trend.
b) How well you organise your paragraphs.
c) Overall clarity and fluency of your report and message.
d) How well you have organised and liked the information, data and ideas in your writing.
e) Logical sequencing and appropriate use of linking devices between and within your sentences. Tips:
1. Do not incorporate more than 3-4 paragraphs.
2. Do not use a single paragraph to describe everything. 13
3. The conclusion part is optional. If you think that you have already written more than
170 words and have nothing to say, you can skip the conclusion. 14
Tài liệu liên quan:
-
Reading 10 Aggregate Output, Prices - Business English | Trường Đại học Hùng Vương
308 154 -
Reading 9 The Firm and Market Structures - Business English | Trường Đại học Hùng Vương
275 138 -
Reading 8 Topics in Demand - Business English | Trường Đại học Hùng Vương
273 137 -
Reading 7 Introduction to Linear Regression - Business English | Trường Đại học Hùng Vương
281 141 -
Reading 3 Probability Concepts - Business English | Trường Đại học Hùng Vương
302 151