IRENA_Green_hydrogen_cost_2020


Preview text:
GREEN HYDROGEN COST REDUCTION SCALING UP ELECTROLYSERS TO MEET THE 1.5°C H CLIMATE GOAL O 2 2
GREEN HYDROGEN COST REDUCTION © IRENA 2020
Unless otherwise stated, material in this publication may be freely used, shared, copied, reproduced, printed and/or stored,
provided that appropriate acknowledgement is given of IRENA as the source and copyright holder. Material in this publication
that is attributed to third parties may be subject to separate terms of use and restrictions, and appropriate permissions from
these third parties may need to be secured before any use of such material. ISBN: 978-92-9260-295-6
Citation: IRENA (2020), Green Hydrogen Cost Reduction: Scaling up Electrolysers to Meet the 1.5⁰C Climate Goal,
International Renewable Energy Agency, Abu Dhabi. Acknowledgements
This report benefited from input and review of the following experts: Katherine Ayers and Egil Rasten (NEL), Karan Bagga
(ThyssenKrupp), Bart Biebuyck and Mirela Atanasiu (FCH JU), Luigi Crema and Martina Trini (Bruno Kessler Foundation), Tim
Karlsson (IPHE), Ruud Kempener (European Commission), Francesco Massari (XBEC), Corky Mittelsteadt (Giner ELX), Samir
Rachidi (IRESEN), Jan-Justus Schmidt (Enapter), Toshiyuki Shirai (METI/Japan), Andrew Smeltz (Denora), Denis Thomas
(Cummins-Hydrogenics), Kasper Tipsmark (Green Hydrogen Systems), Eveline Weidner (EU JRC) and Frank Wouters (EU-GCC
clean energy council). Emanuele Bianco, Paul Durrant, Barbara Jinks, Seungwoo Kang, Paul Komor and Stephanie Weckend
(IRENA) also provided valuable inputs.
The report was edited by Jonathan Gorvett.
Authors: Emanuele Taibi, Herib Blanco and Raul Miranda (IRENA) and Marcelo Carmo (Forschungszentrum Jülich).
The study was supervised by Dolf Gielen and Roland Roesch (IRENA).
Report available online: www.irena.org/publications
For questions or to provide feedback: publications@irena.org
IRENA is grateful for the support of the German Federal Ministry for Economic Affairs and Energy (BMWI) of the Federal
Republic of Germany and the Ministry of Economy, Trade and Industry (METI) of Japan in producing this publication. Disclaimer
This publication and the material herein are provided “as is”. All reasonable precautions have been taken by IRENA to verify
the reliability of the material in this publication. However, neither IRENA nor any of its officials, agents, data or other third-
party content providers provides a warranty of any kind, either expressed or implied, and they accept no responsibility or
liability for any consequence of use of the publication or material herein.
The information contained herein does not necessarily represent the views of all Members of IRENA. The mention of specific
companies or certain projects or products does not imply that they are endorsed or recommended by IRENA in preference to
others of a similar nature that are not mentioned. The designations employed and the presentation of material herein do not
imply the expression of any opinion on the part of IRENA concerning the legal status of any region, country, territory, city or
area or of its authorities, or concerning the delimitation of frontiers or boundaries. 2 FOREWORD
While 2020 may be remembered for the tragic COVID-19 crisis, it has also
been an unprecedented year for the global energy transition and the growing
momentum of hydrogen technology. Many countries, in aligning their pandemic
response with longer-term goals, have announced strategies to develop
hydrogen as a key energy carrier. In parallel, numerous countries, cities and
companies have adopted net-zero targets for energy-related carbon dioxide
(CO ) emissions, bringing the need for hydrogen to the forefront. 2
But not all types of hydrogen are compatible with sustainable, climate-
safe energy use or net-zero emissions. Only “green” hydrogen – produced
with electricity from renewable sources – fulfils these criteria, which also
entail avoiding “grey” and hybrid “blue” hydrogen. Green hydrogen forms a
cornerstone of the shift away from fossil fuels. Its uptake will be essential for
sectors like aviation, international shipping and heavy industry, where energy
intensity is high and emissions are hardest to abate.
Green hydrogen, however, cannot take off without widespread and
co-ordinated support across the value chain. The Collaborative Framework
on Green Hydrogen, set up by the International Renewable Energy Agency
(IRENA) in mid-2020, offers a platform to strengthen support in co-operation
with IRENA’s member countries and partners. IRENA studies in 2018-19
highlighted the technical and economic feasibility, while a recent policy-making
guide outlines key enabling policies for green hydrogen. Business models, for
their part, require careful consideration.
The present study, Green hydrogen cost reduction, adds a vital strategic
building block, providing insights on how to make this clean supply option
widely available and economical.
Only five countries had announced their hydrogen strategies by the end of 2019.
A year on, nearly 20 have done so, with at least 10 more set to follow within
months. Industry investors plan at least 25 gigawatts (GW) of electrolyser
capacity for green hydrogen by 2026. Still, far steeper growth is needed –
in renewable power as well as green hydrogen capacity – to fulfil ambitious
climate goals and hold the rise in average global temperatures at 1.5°C.
Energy diversification, when based on renewables, can eliminate emissions
and fulfil climate pledges. Green hydrogen uptake, of course, would reduce the
need for carbon capture by simply providing cleaner energy.
Yet significant barriers remain. Green hydrogen costs, on average, between
two and three times more to make than blue hydrogen, with the true potential
and viability of the latter requiring further investigation. With electricity
input accounting for much of the production cost for green hydrogen, falling
renewable power costs will narrow the gap. Attention, meanwhile, must shift to
the second-largest cost component, electrolysers.
This report explores strategies and policies to drive innovation, cut costs for
electrolysers and make green hydrogen a least-cost solution wherever needed.
With larger production facilities, design standardisation and insights from early
adopters, the proposed strategies could cut costs by 40% in the short term and
up to 80% in the long term, this study finds.
In price terms, the resulting green hydrogen could fall below USD 2 per kilogram
mark – low enough to compete – within a decade. This opens the way for large-
scale manufacturing capacity, new jobs and economic growth Already, green
hydrogen’s improving cost projections represent an amazing step forward; until
just a few months ago, such results were not expected before mid-century. But
getting there depends on defining the right business model, creating markets,
and optimising the supply chain in a way that both developed and developing
countries, equally, can enjoy the transition to a clean, resilient energy system.
Just as I hope 2021 will be a better year for humanity, I hope these findings will
help to inspire the necessary action on green hydrogen. IRENA stands ready to
help its member countries worldwide, whatever their energy challenges or level
of economic development, make the leap. Francesco La Camera
Director-General, IRENA CONTENTS EXECUTIVE SUMMARY 8 ABOUT THIS REPORT 14 1. INTRODUCTION 15 1.1 Hydrogen and renewables 15
1.2 Latest hydrogen policy developments 18
2.ELECTROLYSER TECHNOLOGY CHARACTERISATION 26 2.1 Electrolyser technologies 31
2.2 Cell level for each type of electrolyser 33
2.3 System level for each type of electrolyser 34
2.4 Trade-offs to consider in the design of the electrolyser 42
2.5 Flexibility of green hydrogen production facilities 46 2.6 Costs: Current status 50
3. STRATEGIES FOR COST REDUCTION: STACK LEVEL 56
3.1 Stack design: What can be done? 57
3.2 Setting targets for stack design: A key performance indicator (KPI)driven approach 64
3.3 Materials: Use, barriers and solutions 67 3.4 Increasing module size 71
4.STRATEGIES FOR COST REDUCTION: SYSTEM LEVEL 73
4.1 Manufacturing scale of electrolysers 75 4.2 Learning-by-doing 77
5. GREEN HYDROGEN PROJECT PIPELINE 82 5.1 Key players 82
5.2 Current relevant projects and expected key H production sites beyond 2020 84 2
6. THE ROAD TO SCALING UP GREEN HYDROGEN: A MILESTONE-DRIVEN APPROACH 86
7. CONCLUSIONS AND ROLE FOR MULTIPLE STAKEHOLDERS IN SCALING UP 92 REFERENCES 97 ABBREVIATIONS 102
GREEN HYDROGEN COST REDUCTION FIGURES
Figure 1. Hydrogen production cost as a function of investment,
electricity price and operating hours. 18
Figure 2. Recent hydrogen policies and strategies. 20
Figure 3. Electrolyser capacity comparison between national strategies and IRENA’s scenarios for 2030. 22
Figure 4. Basic components of water electrolysers at different levels. 28
Figure 5. Challenges and technological breakthroughs for each of the generation of electrolysers. 29
Figure 6. Different types of commercially available electrolysis technologies. 31
Figure 7. Typical system design and balance of plant for an alkaline electrolyser. 34
Figure 8. Typical system design and balance of plant for a PEM electrolyser. 35
Figure 9. Typical system design and balance of plant for an AEM electrolyser. 36
Figure 10. Typical system design and balance of plant for a solid oxide electrolyser. 36
Figure 11. Energy losses for compression in a pressurized electrolyser as a function
of delivery pressure and thickness of membrane. 37
Figure 12. Energy losses for the multi-stage mechanical compression of hydrogen. 38
Figure 13. Plot size for an alkaline 1-GW electrolyser plant (left) and for a 100-MW
alkaline electrolyser from Thyssenkrupp (right) 41
Figure 14. Trade-offs between efficiency, durability and cost for electrolysers. 42
Figure 15. System schematic for green hydrogen production facility that includes
electricity and hydrogen storage on site. 46
Figure 16. Power system services that can be provided by energy storage 48
Figure 17. Seasonality of hydrogen production in Europe in the IRENA global power
system model for 2050 (based on the Transforming Energy Scenario). 48
Figure 18. Cost breakdown for a 1-MW PEM electrolyser, moving from full system, to stack, to CCM. 52
Figure 19. System components for a 1-MW PEM electrolyser classified based on
contribution to total system cost and potential for cost reduction. 53
Figure 20. Cost breakdown for 1-MW alkaline electrolyser, moving from full system, to stack, to MEA. 54
Figure 21. System components for a 1-MW alkaline electrolyser classified based on
contribution to total system cost and potential for cost reduction. 55
Figure 22. Relationship between voltage (the higher, the lower the efficiency) and
current density (the higher, the higher the production volume) for various
diaphragm thickness of alkaline electrolysers. 58
Figure 23. Global warming potential and cumulative energy demand for critical materials used in electrolysers. 67
Figure 24. Top producers of critical materials in electrolysers. 69
Figure 25. Cost breakdown by major component for alkaline electrolysers based on current costs. 71
Figure 26. Electrolyser investment cost as a function of module size for various technologies. 72
Figure 27. Cost breakdown for PEM electrolysers as a function of manufacturing scale (units of 1 MW per year). 74 6
SCALING UP ELECTROLYSERS TO MEET THE 1.5°C CLIMATE GOAL
Figure 28. Cost breakdown for PEM electrolysers for a (a) 10 MW/year;
(b) 1 GW/year production scale. 76
Figure 29. Potential cost decrease for electrolysers based on a learning rate and
costs achieved by deployment in IRENA scenarios by 2030 and 2050. 79
Figure 30. Variable learning rate based on components for three types of electrolysers. 81
Figure 31. (a) Historical and (b) Future (based on announcements and projects) electrolyser capacity. 84
Figure 32. Estimated necessary electrolyser manufacturing capacity (GW/year)
to meet different installed capacity targets by 2050 85
Figure 33. Milestones for four cost reduction strategies across three stages of deployment for electrolysers. 87
Figure 34. Potential cost reduction by implementing strategies presented in
this report across three stages of deployment. 90
Figure 35. Step changes for achieving green hydrogen competitiveness. 91
Figure 36. Main actions and functions for key stakeholders influencing
the scale up of green hydrogen. 93 TABLES
Table 1. Characterisation of the four types of water electrolysers. 32
Table 2. Proposed activities to improve the performance of alkaline electrolysers. 59
Table 3. Proposed activities to improve the performance of PEM electrolysers. 61
Table 4. Proposed activities to improve the performance of AEM electrolysers. 62
Table 5. Proposed activities to improve the performance of solid oxide electrolysers. 63
Table 6. Stateoftheart and future KPIs for all electrolyser technologies. 65
Table 7. Iridium and platinum loading for PEM electrolysers with increased
performance and material reduction strategies. 70
Table 8. Economies of scale for PEM stack manufacturing. 75
Table 9. Learning rate estimates for electrolysers and fuel cells. 78
Table 10. Learning rate by stack component for three types of electrolysers. 80
Table 11. A nonexhaustive list of key players involved in the manufacturing of water electrolyser systems. 83 BOXES Box 1.
A brief look at the historical development of electrolysers 29 7 EXECUTIVE SUMMARY
As more countries pursue deep decarbonisation
and is the focus of this report, which identifies
strategies, hydrogen will have a critical role to
key strategies to reduce investment costs for
play. This will be particularly so where direct electrolysis plants from 40% in the short term to
electrification is challenging and in harder-to-
80% in the long term. These strategies range from
abate sectors, such as steel, chemicals, long-haul
the fundamental design of the electrolyser stack to
transport, shipping and aviation. In this context,
broader system-wide elements, including:
hydrogen needs to be low carbon from the outset
and ultimately green (produced by electrolysis of
Electrolyser design and construction:
water using renewable electricity).
Increased module size and innovation
with increased stack manufacturing have
In addition to regulations and market design,
significant impacts on cost. Increasing the
the cost of production is a major barrier to the
plant from 1 MW (typical today) to 20 MW
uptake of green hydrogen. Costs are falling –
could reduce costs by over a third. Cost,
largely due to falling renewable power costs – but
however, is not the only factor influencing
green hydrogen is still 2-3 times more expensive
plant size, as each technology has its own
than blue hydrogen (produced from fossil fuels
stack design, which also varies between
with carbon capture and storage) and further cost
manufacturers. The optimal system design reductions are needed.
also depends on the application that drives 1
system performance in aspects such as
The largest single cost component for on-site efficiency and flexibility.
production of green hydrogen is the cost of
Economies of scale: Increasing stack
the renewable electricity needed to power the
production to automated production in GW-
electrolyser unit. This renders production of green
scale manufacturing facilities can achieve
hydrogen more expensive than blue hydrogen,
a step-change cost reduction. At lower
regardless of the cost of the electrolyser. A
manufacture rates, the stack is about 45%
low cost of electricity is therefore a necessary
of the total cost, yet at higher production
condition for producing competitive green
rates, it can go down to 30%. For Polymer
hydrogen. This creates an opportunity to produce
Electrolyte Membrane (PEM) electrolysers,
hydrogen at locations around the world that have
the tipping point seems to be around 1 000
optimal renewable resources, in order to achieve
units (of 1 MW) per year, where this scale-up competitiveness.2
allows an almost 50% cost reduction in stack
manufacturing. The cost of the surrounding
Low electricity cost is not enough by itself for
plant is as important as the electrolyser
competitive green hydrogen production, however,
stack and savings can be achieved through
and reductions in the cost of electrolysis facilities
standardisation of system components and
are also needed. This is the second largest plant design.
cost component of green hydrogen production 1
In the context of decarbonisation, hydrogen produced from fossil fuels without capturing most of the CO2 emissions does not fulfil
the criteria of renewable energy, although it represents the vast majority of hydrogen production today. 2
The trend over the last decade of falling renewable electricity prices is expected to continue; 82%, 47% and 39% for solar photovol- 8
taic (PV), offshore and onshore wind respectively (IRENA, 2020a).
SCALING UP ELECTROLYSERS TO MEET THE 1.5°C CLIMATE GOAL
Procurement of materials: Scarce materials
Industrial applications: Electrolysis system
can represent a barrier to electrolyser cost
design and operation can be optimised for
and scale-up. Current production of iridium
specific applications. These can range from:
and platinum for PEM electrolysers will only
large industry users requiring a stable supply
support an estimated 3 GW-7.5 GW annual
and with low logistics costs; large scale,
manufacturing capacity, compared to an
off-grid facilities with access to low-cost
estimated annual manufacturing requirement
renewables, but that incur in significant costs
of around 100 GW by 2030. Solutions that
to deliver hydrogen to the end-user; and
avoid the use of such materials are already
decentralised production that requires small
being implemented by leading alkaline
modules for flexibility, which compensate for
electrolyser manufacturers, however, and
higher investment per unit of electrolyser
technologies exist to significantly reduce
capacity with reduced (or nearzero onsite)
the requirements for such materials in PEM logistic costs.
electrolysers. Anion Exchange Membrane
(AEM) electrolysers do not need scarce
Learning rates: Several studies show that materials in the first place.
potential learning rates for fuel cells and
electrolysers are similar to solar PV and can
Efficiency and flexibility in operations:
reach values between 16% and 21%. This is
Power supply represents large efficiency
significantly lower than the 36% learning
losses at low load, limiting system flexibility,
rates experienced over the last 10 years for
from an economic perspective. A modular
PV (IRENA, 2020a). With such learning rates
plant design with multiple stacks and
and a deployment pathway in line with a
power supply units can address this
1.5°C climate target, a reduction in the cost of
problem. Compression could also represent
electrolysers of over 40% may be achievable
a bottleneck for flexibility, since it might by 2030.
not be able to change its production rate
as quickly as the stack. One alternative to
Figure ES1 shows how up to 85% of green
deal with this is an integrated plant design
hydrogen production costs can be reduced in the
with enough capacity to deal with variability
long term by a combination of cheaper electricity
of production through optimised and and electrolyser capex investment, in addition to
integrated electricity and hydrogen storage.
increased efficiency and optimised operation of
Green hydrogen production can provide the electrolyser.
significant flexibility for the power system, if
the value of such services is recognised and
remunerated adequately. Where hydrogen
will play a key role in terms of flexibility, as
it does not have any significant alternative
sources to compete with, will be in the
seasonal storage of renewables. Although
this comes at significant efficiency losses, it is
a necessary cornerstone for achieving 100%
renewable generation in power systems with
heavy reliance on variable resources, such as solar and wind. 9
GREEN HYDROGEN COST REDUCTION
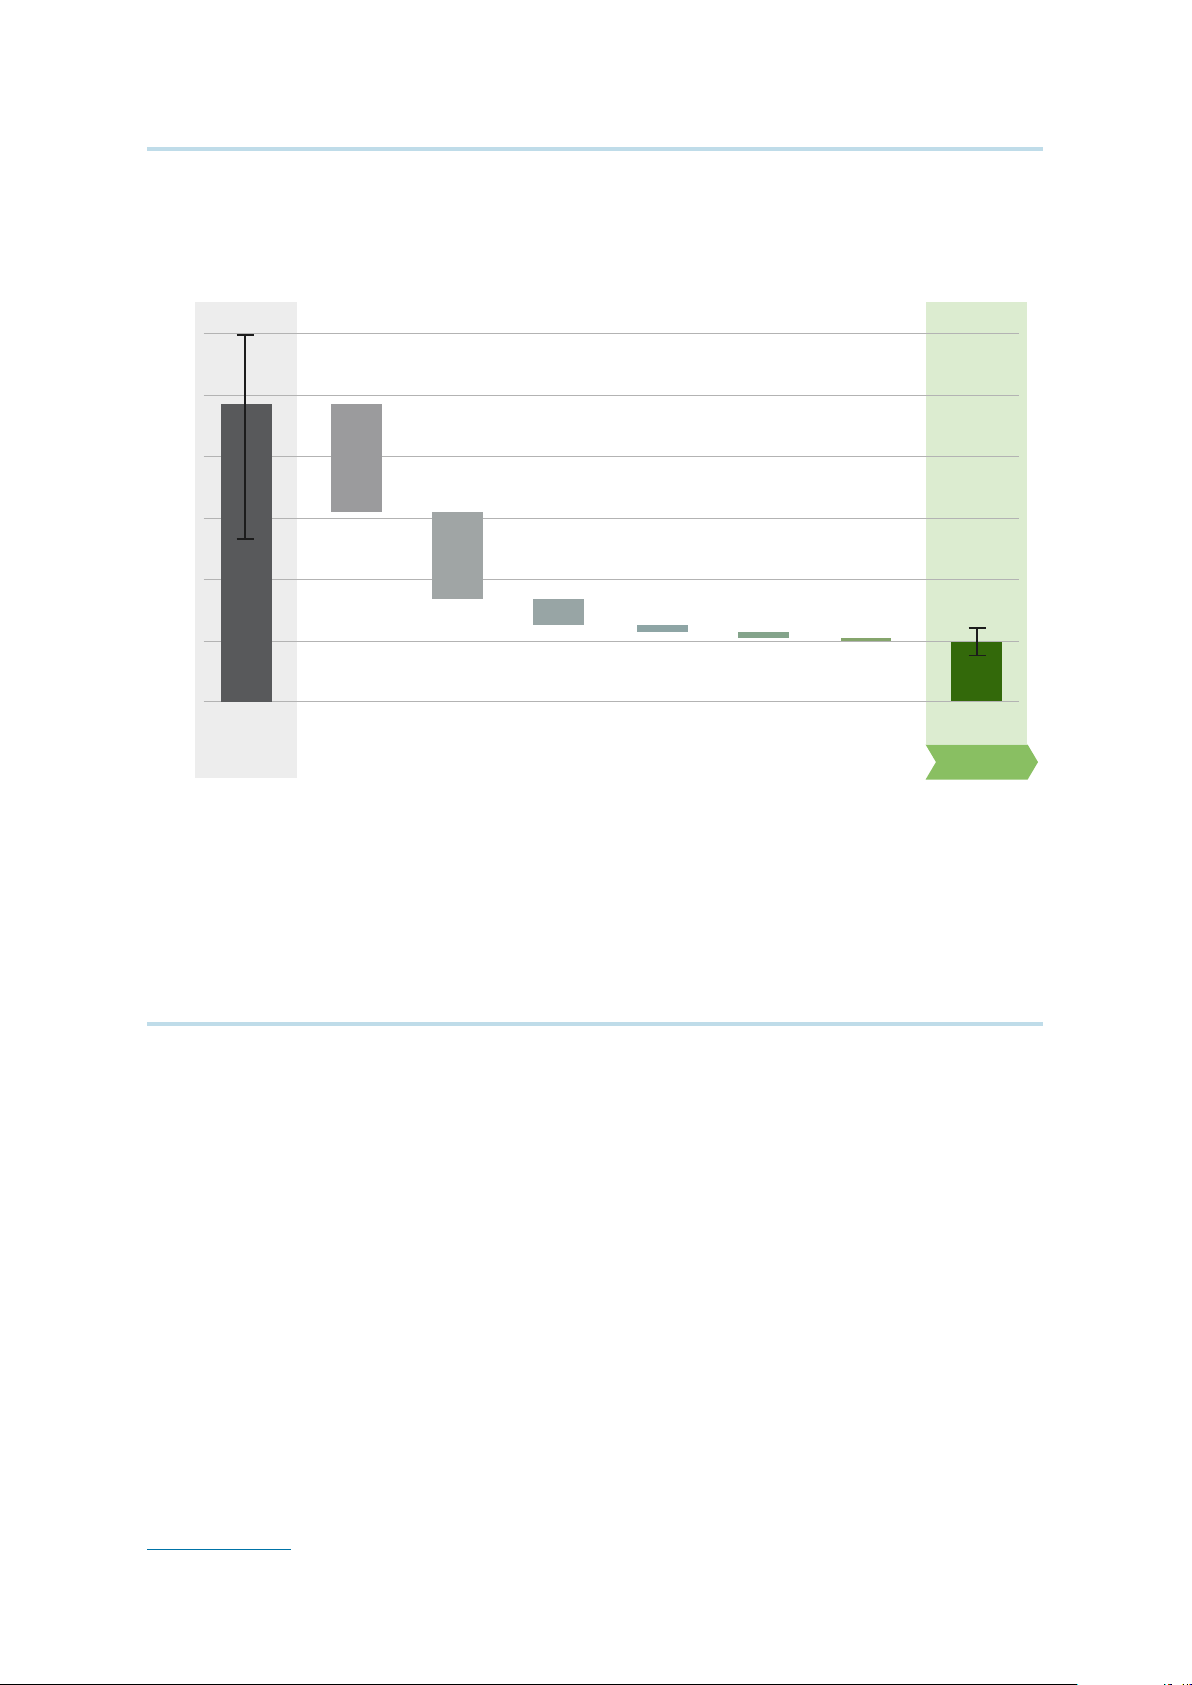
Figure ES1. A combination of cost reductions in electricity and electrolysers, combined
with increased efficiency and operating lifetime, can deliver 80% reduction in hydrogen cost. 6 5 gH2) /k 4 t (USD os 3 tion c oduc 2 ogen pr Hyr 1 0 t y s s t os h s ser s tion in os o 6% y c ear TODAY /MW troly educ ser c tricit ser efficienc 6% (LHV) 200 hour FUTURE Elec o 7 Full load hour o 20 y om 10% t 80% r troly o 4 elec o 20 USD troly 3 t 5% t Elec 200 t etime of elec ACC fr Lif from 10 t W from 5 from 6 from 3
Note: ‘Today’ captures best and average conditions. ‘Average’ signifies an investment of USD 770/kilowatt (kW), efficiency
of 65% (lower heating value – LHV), an electricity price of USD 53/MWh, full load hours of 3200 (onshore wind), and a
weighted average cost of capital (WACC) of 10% (relatively high risk). ‘Best’ signifies investment of USD 130/kW, efficiency
of 76% (LHV), electricity price of USD 20/MWh, full load hours of 4200 (onshore wind), and a WACC of 6% (similar to renewable electricity today). Based on IRENA analysis
Figure ES2 illustrates the potential green A low electricity price is essential for the
hydrogen production cost reduction between production of competitive green hydrogen,
2020 and 2050 for a range of electrolysers cost
and, as illustrated in Figure ES2, cost reductions
and deployment levels. In the best-case scenario,
in electrolysers cannot compensate for high
green hydrogen can already be produced at costs
electricity prices. Combined with low electricity
competitive with blue hydrogen today, using low-
cost, an aggressive electrolyser deployment
cost renewable electricity, i.e. around USD 20 per
pathway3 can make green hydrogen cheaper megawatt-hour (MWh).
than any low-carbon alternative (i.e. < USD 1/kg),
before 2040. If rapid scale-up takes place in the
next decade, green hydrogen is expected to start
becoming competitive with blue hydrogen by
2030 in a wide range of countries – e.g. those
with electricity prices of USD 30/MWh – and in applications. 3
Meaning 5 terawatts (TW) of installed capacity by 2050. 10
SCALING UP ELECTROLYSERS TO MEET THE 1.5°C CLIMATE GOAL
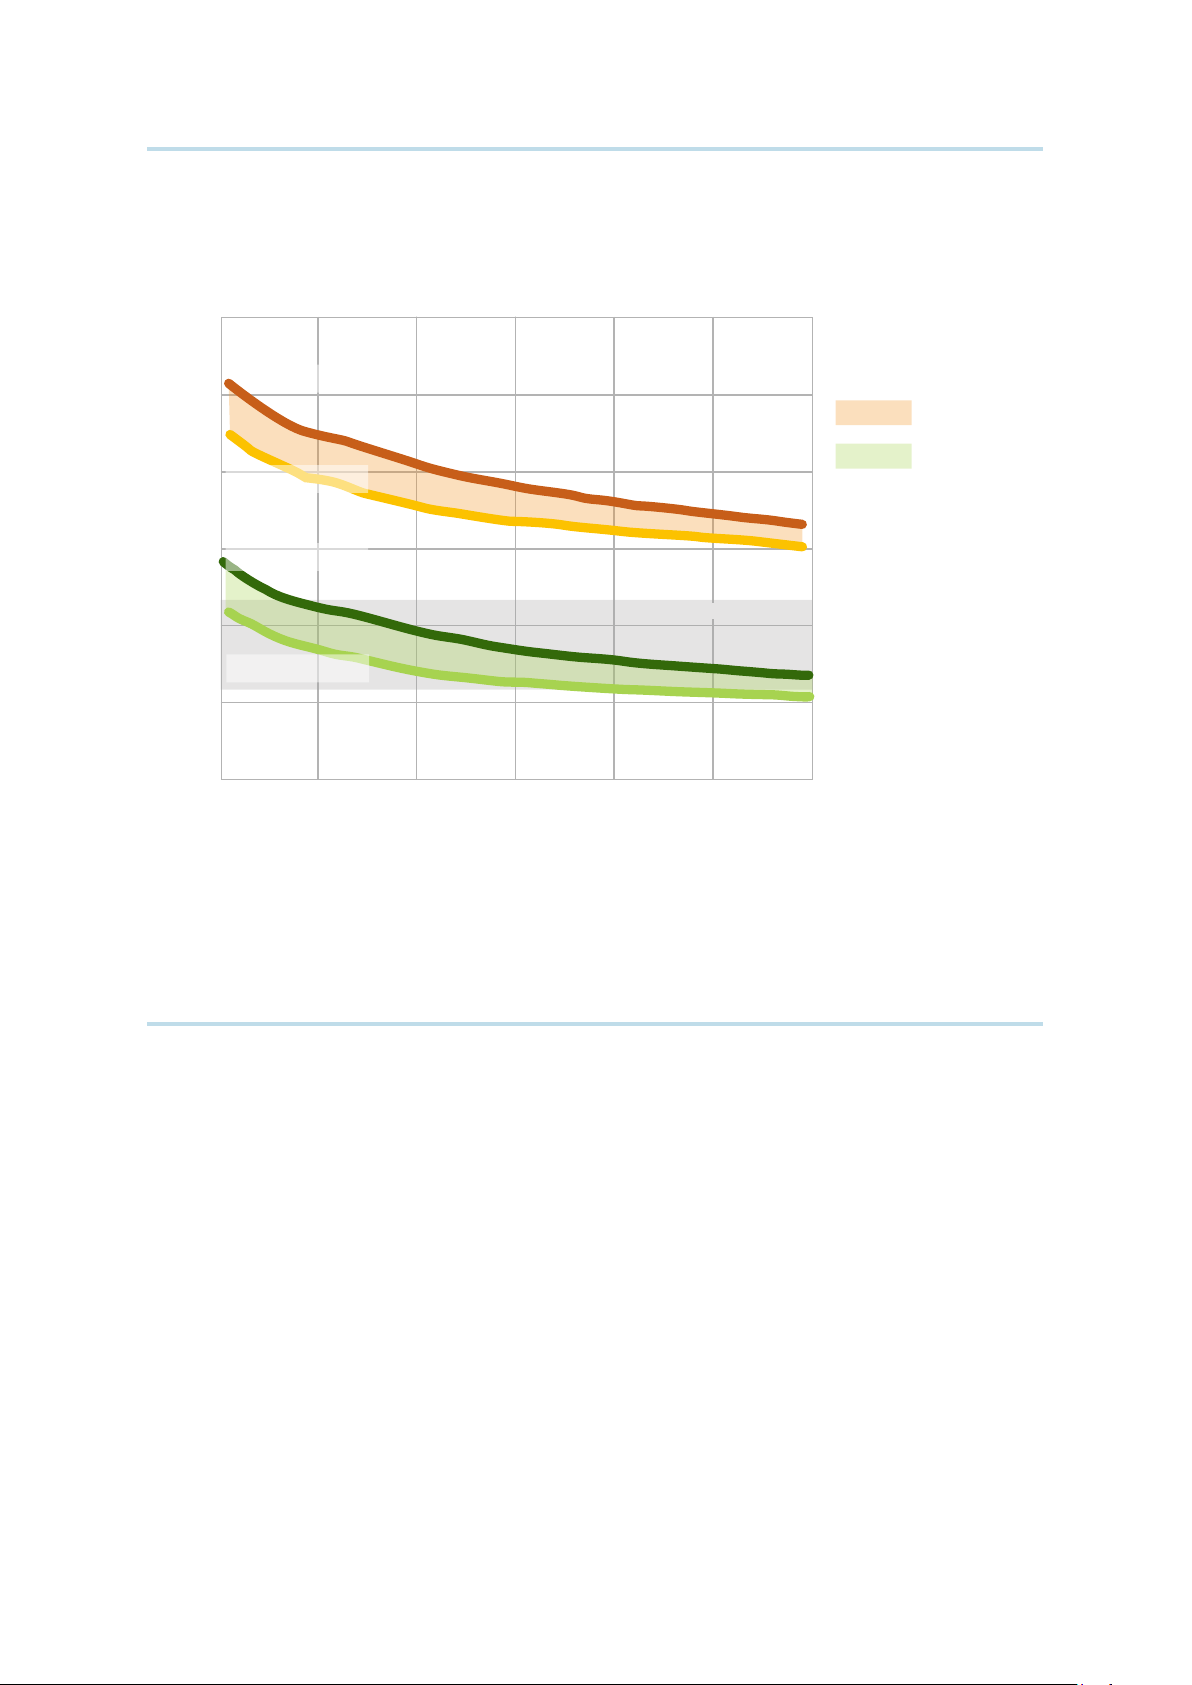
Figure ES2. Cost of green hydrogen production as a function of electrolyser deployment,
using an average (USD 65/MWh) and a low (USD 20/MWh) electricity price,
constant over the period 2020-2050. 6.0 Electrolyser cost in 2020: USD 1 000/kW 5.0 Electricity price USD 65/MWh ) 2 Electricity price g H 4.0 USD 20/MWh Electrolyser cost in 2020: /k USD 650/kW Electrolyser cost in 2050:
USD 307/kW @ 1 TW Installed capacity t (USD os
3.0 Electrolyser cost in 2020: Electrolyser cost in 2050: USD 1 000/kW
USD 130/kW @ 5 TW installed capacity ogen c Fossil fuel range dr 2.0 Hy Electrolyser cost in 2050: Electrolyser cost in 2020:
USD 307/kW @ 1 TW Installed capacity USD 650/kW 1.0 Electrolyser cost in 2050:
USD 130/kW @ 5 TW installed capacity 0 2020 2025 2030 2035 2040 2045 2050
Note: Efficiency at nominal capacity is 65%, with a LHV of 51.2 kilowatt hour/kilogramme of hydrogen (kWh/kg H2) in 2020
and 76% (at an LHV of 43.8 kWh/kg H2) in 2050, a discount rate of 8% and a stack lifetime of 80 000 hours. The electrolyser
investment cost for 2020 is USD 650-1000/kW. Electrolyser costs reach USD 130-307/kW as a result of 1-5 TW of capacity deployed by 2050. Based on IRENA analysis.
Today’s cost and performance are not the same
footprint of 8 hectares (ha)-13 ha for a 1 GW facility
for all electrolyser technologies (see Table ES1).
using PEM, compared to 10 ha-17 ha using alkaline
Alkaline and PEM electrolysers are the most (ISPT, 2020). Gaps in cost and performance are
advanced and already commercial, while each expected to narrow over time as innovation
technology has its own competitive advantage. and mass deployment of different electrolysis
Alkaline electrolysers have the lowest installed technologies drive convergence towards similar
cost, while PEM electrolysers have a much smaller
costs. The wide range in system costs is expected
footprint, combined with higher current density
to remain, however, as this is very much dependent
and output pressure. Meanwhile, solid oxide has
on the scale, application and scope of delivery. For
the highest electrical efficiency. As the cell stack
instance, a containerised system inside an existing
is only part of the electrolyser facility footprint, a
facility with existing power supply is significantly
reduced stack footprint of around 60% for PEM
lower cost than a new building in a plot of land to
compared to alkaline translates into a 20%-24%
be purchased, with complete water and electricity
reduction in the facility footprint, with an estimated
supply system to be included, high purity 11
GREEN HYDROGEN COST REDUCTION
hydrogen for fuel cell applications and high output
lowest value the price can be (on the limit of zero
pressure. Normally, numbers for system costs profit). As the market scales up rapidly, in the initial
include not only cell stack, but also balance of
phase, the investment in manufacturing facilities
stacks, power rectifiers, the hydrogen purification
must be recovered, therefore the gap between cost
system, water supply and purification, cooling and
and price is currently higher than in 10 or 20 years
commissioning – yet exclude shipping, civil works
from now. As a reference, an estimated investment and site preparations.
of EUR 45-69 million is required for each GW of
manufacturing capacity (Cihlar et al., 2020).
Notably, the numbers for 2020 are cost estimates
for a system ordered in 2020, representing the Table ES1.
Key performance indicators for four electrolyser technologies today and in 2050. 2020 2050 Alkaline PEM AEM SOEC Alkaline PEM AEM SOEC Cell pressure [bara] < 30 < 70 < 35 < 10 > 70 > 70 > 70 > 20 Efficiency (system) 50-78 50-83 57-69 45-55 < 45 < 45 < 45 < 40 [kWh/KgH ] 2 Lifetime [thousand 60 50-80 > 5 < 20 100 100-120 100 80 hours] Capital costs estimate for large 270 400 - > 2 000 < 100 < 100 < 100 < 200 stacks (stack-only, > 1 MW) [USD/kW ] el Capital cost range estimate for the 500- 700- - - < 200 < 200 < 200 < 300 entire system, >10 1 000 1 400 MW [USD/kW ] el
Note: PEM = Polymer Electrolyte Membrane (commercial technology); AEM = Anion Exchange Membrane (lab-scale today);
SOEC = Solid Oxide Electrolysers (lab-scale today). Based on IRENA analysis. 12
Innovation is crucial to reduce cost and improve
the performance of the electrolyser. The ultimate
goals are to: 1) reduce cost by standardising and
simplifying manufacturing and design to allow
for industrialisation and scale-up; 2) improve
efficiency to reduce the amount of electricity
required to produce one unit of hydrogen; and
3) increase durability to extend the equipment
lifetime and spread the cost of the electrolyser
facility over a larger hydrogen production volume.
Governments can support innovation in
electrolysers by issuing clear long-term signals that support policy on:
Facilitating investment in production, logistics
and utilisation of green hydrogen, including
all areas that will help this low-carbon energy
carrier to become competitive; technology
cost and performance improvements,
material supply, business models and trading
using common standards and certifications.
Establishing regulations and design markets
that support investments in innovation and
scale-up the production of green hydrogen.
This includes approaches such as setting
manufacturing or deployment targets, tax
incentives, mandatory quotas in hard to
decarbonise sectors and other de-risking
mechanisms, while enabling new business
models that can guarantee predictable
revenues for the private sector to invest at scale.
Supporting research, development and
demonstration (RD&D) to: reduce the use
of iridium and platinum in the manufacture
of PEM electrolysers; transition all alkaline
units to be platinum- and cobalt-free; and, in
general, mandate reduced scarce materials
utilisation as a condition for manufacturing scale-up.
Fostering coordination and common goals
along the hydrogen value chain, across
borders, across relevant sectors and between stakeholders. 13
GREEN HYDROGEN COST REDUCTION ABOUT THIS REPORT
This report is part of IRENA’s ongoing programme of work to provide its member states and
the wider community with expert analytical insights into the potential options and enabling
conditions and policies that could deliver deep decarbonisation of economies.
This report complements a range of publications and activities produced and planned by
IRENA, including its annual Global Renewable Outlook, which provides detailed global and
regional roadmaps for emission reductions alongside assessment of the socio-economic
implications. The 2020 edition includes Deep Decarbonisation Perspectives, detailing
options for net-zero or zero emissions (IRENA, 2020b). The next edition is expected to
include further detailed analysis of a pathway consistent with a 1.5°C goal.
Building on that technical and socio-economic assessment, IRENA is assessing specific
facets of that pathway, including the policy and financial frameworks needed. This includes
the roles of direct and indirect electrification, the implications for power systems, the role
of green hydrogen and of biomass, and options for specific, challenging end-use sectors.
For green hydrogen, some of the relevant recent and upcoming publications include:
Hydrogen: A renewable energy perspective (IRENA, 2019a); the Reaching Zero with
Renewables report and its briefs on industry and transport (IRENA, 2020c); the Green
Hydrogen: A guide to policy making report and its associated briefs (IRENA, 2020d), which
present a policy framework to promote green hydrogen across the entire energy sector and
the key overarching policy pillars; reports on the potential of biojet fuels and on renewable
methanol; Renewable energy policies in a time of transition: Heating and Cooling, and the
subsequent briefs to this report (IRENA, 2020e).
This analytical work is complemented by IRENA’s work to convene experts and stakeholders,
including IRENA’s Innovation Weeks, Policy Days and Policy Talks and IRENA’s Collaborative
Framework on Green Hydrogen, which brings together a broad range of member states and
other stakeholders to exchange knowledge and experience.
Details of these and other related activities can be found at www.irena.org. 14
SCALING UP ELECTROLYSERS TO MEET THE 1.5°C CLIMATE GOAL 1.INTRODUCTION
The major cost component for green hydrogen is the electricity supply.
Cost decline in this is already underway through the competitive deployment of renewables.
There is a need to focus on reducing the procurement and construction
cost and increasing the performance and durability of electrolysers, to TS
achieve further cost reductions in green hydrogen production.
IN Green hydrogen can achieve cost-competitiveness with fossil-based
hydrogen today in ideal locations with the lowest renewable electricity O
costs. Cost reductions in renewable electricity and electrolysers will
continue to increase the number of sites where green hydrogen can be
produced competitively, however.
Policy support in recently unveiled hydrogen strategies in many EY P
countries is mostly in the form of explicit electrolyser capacity targets K
and, to a more limited extent, cost targets. These have yet to translate
into specific regulatory instruments. So far, these explicit targets are
not enough to be in line with 1.5°C decarbonisation pathways.
1.1 HYDROGEN AND RENEWABLES
The world is undergoing a dramatic change in the
towards a society where energy stops contributing
way energy is produced, transformed, stored and
to climate change and local pollution, replacing
used in its various forms. People are becoming
fossil fuels with renewable energy.
increasingly conscious of the need to move 15
GREEN HYDROGEN COST REDUCTION
As the deployment of renewable energy sources
context of decarbonisation, green hydrogen is the
increases all over the globe in the power sector,
only zero-carbon option for hydrogen production,
solutions that leverage renewable electricity to as carbon capture in CCS is 85%-95% at best and
decarbonise end-use sectors using power-to-gas significantly lower to date.
strategies, or to convert electricity into high-value
chemicals or fuels, need to be quickly introduced
Once produced at scale and competitive cost,
(IRENA, 2020c). In addition, as electricity needs
green hydrogen can also be further converted
to increase from around 20% of final energy into other energy carriers, such as ammonia,
consumption to around 50% by 2050 (IRENA, methanol, methane and liquid hydrocarbons. As
2020b), there is still a need to decarbonise a fuel, hydrogen can be used in fuel cells (i.e. an
applications for which direct electrification is electrochemical device that combines hydrogen
more challenging (the so called “hard-to-abate”
with oxygen from the air and produces electricity), sectors).
but also combusted in engines and turbines. Fuel
cells can be used for stationary applications in
Hydrogen is only one option in decarbonising large-scale power plants, microgrid or backup
hard-to-abate sectors. Energy efficiency is key generation (e.g. in data centres), or for a wide range
to reducing the energy supply and renewable of transport applications – as is already done in
capacity upstream, while bioenergy might be fuel cell electric vehicles (FCEV), trucks, light-duty
suitable, not only in the form of biofuels for those
vehicles, forklifts, buses, ferries and ships. As a
transport sectors that have limited fuel alternatives
chemical, green hydrogen can reduce greenhouse
(especially aviation), but also as a source of carbon
gas (GHG) emissions from sectors where hydrogen
for synthetic fuels. Direct electrification is more
from fossil fuel is widely used today, including oil
efficient from a systems perspective, leading refining, methanol and ammonia production.
to lower cost, with this already commercially
deployed in many areas (e.g. heating or passenger
Green hydrogen is only one of the production
vehicles). Carbon capture and storage (CCS) might
pathways. Hydrogen can also be produced from
be attractive for existing assets that are still in
bioenergy, methane, coal or even directly from
early stages of their lifetime (the case for many
solar energy. Most of the production today is
assets in Asia) and process emissions (e.g. from
based on methane and coal (about 95%) (IRENA,
cement production). Even for the most ambitious
2019a) and could be made low carbon with the
scenarios, these technological choices might not
use of CCS. CCS might be suitable for regions with
be enough, however, and behavioural changes low-cost natural gas and suitable underground
might be needed to push energy demand even
reservoirs. In the short term, CCS might also be
lower. Thus, for energy transition, hydrogen is one
a good fit for large-scale applications in industry,
solution amongst others and should be tackled in
given the relatively small scale of deployment for
parallel. Hydrogen is part of a wider technology electrolysis.
portfolio to be adapted to domestic conditions in
each country, with this report further exploring this
Low-carbon hydrogen can also be produced from pathway.
methane pyrolysis, where the carbon ends up
as solid rather than as CO , with 4-5 times lower 2
Green hydrogen (i.e. hydrogen produced from electricity consumption than electrolysis and
renewable electricity) links renewable electricity
potentially lower hydrogen production cost. Each
with a range of end-use applications acting as a
pathway has its own limitations. Bioenergy might
complement of electrification, bioenergy and direct
be best suited for other applications, considering
renewable energy use (IRENA, 2018). The potential
its limited nature and the low inherent hydrogen
for green hydrogen is much higher than fossil yield. CCS does not lead to zero emissions,
fuels, since it is linked to solar and wind potential,
requires significant infrastructure for the CO , does 2
which far exceeds global energy demand today
not enable sector coupling, is still exposed to the
and in any future scenario. Most importantly, in the
price fluctuations characteristic of fossil fuels, and 16
SCALING UP ELECTROLYSERS TO MEET THE 1.5°C CLIMATE GOAL
could face social acceptance issues. In addition,
hydrogen: the electrolyser. Electrolysers are the
methane leakages associated with production and
technology necessary to produce hydrogen using
transportation of the gas have been increasingly
electricity and water as inputs. Electrolysis is a well-
under scrutiny as significant contributors to the
established technology that is deployed mostly in
acceleration of climate change. Methane has 86
the chemical industry. While scale-up is needed to
times higher global warming potential compared
bring costs down, technological innovation is also
to CO over a 20-year time horizon (The CCAC Oil
needed to further improve the performance of the 2
& Gas Methane Partnership, no date; Hmiel et al.,
technology (i.e. its efficiency and lifetime). This
2020). Pyrolysis is still at the pilot scale stage and
can be done via new catalysts and configurations,
would require high-temperature renewable or low-
the standardisation of designs and a move to mass
carbon heat. Hence, considering the sector, green production of the equipment.
hydrogen is one of the most attractive options,
given its nature and renewable character, and as
Green hydrogen is already close to being
such, it is the focus of this report.
competitive today in regions where all the
favourable conditions align, but these are usually far
Green hydrogen, similar to other production from demand centres. For example, in Patagonia,
pathways, also has its challenges, however. These
wind energy could have a capacity factor of
include: its current high cost across the entire value
almost 50%, with an electricity cost of USD 25-30/
chain, from electrolysis to transport and fuel cells;
MWh. This would be enough to achieve a green
the lack of existing infrastructure for transport hydrogen production cost of about USD 2.5/kg,
and storage; the high energy losses (which in turn
which is close to the blue hydrogen cost range.
require higher wind/solar deployment rates); and
In most locations, however, green hydrogen is still
the lack of value for the main benefit (e.g. lower
2-3 times more expensive than blue hydrogen.
GHG emissions) that green hydrogen can have The cost of the former is defined by electricity (IRENA, 2019a, 2020c).
costs, investment cost, fixed operating costs and
the number of operating hours of the electrolyser facilities (see Figure 1).
Electricity is the dominant cost for
With low operating hours, the investment cost
on-site production of green hydrogen,
dominates, as it is spread over a smaller amount
but the journey to lower renewable
of hydrogen. This could happen when using only
costs is already underway. Efforts
curtailed electricity, or coupling with PV without
need to shift to the second largest
any storage or backup. The electricity cost
cost for green hydrogen: electrolysers
becomes dominant as the number of operating
hours increases. Solar projects in countries such
as Brazil, Portugal, the United Arab Emirates and
Renewables are becoming the cheapest source the United States have been deployed with costs
of electricity around the world, with significant of electricity as low as USD 13.5-20/MWh due to
potential for further cost reductions (IRENA,
supportive policy instruments, such as auctions,
2020a). This opens up the opportunity, in the long-
to guarantee a stable payment and reduce the
term, to trade globally low-cost green hydrogen investment risk.
from the best renewable resources to regions
with limited land or renewable potential. This
trade can be done directly with liquid hydrogen,
in the form of hydrogen carriers that increase the
energy density for transport, or in the form of
commodities (e.g. reduced iron and chemicals).
The missing element in this equation is the key
facility to convert renewable power into green 17
GREEN HYDROGEN COST REDUCTION
Due to the efficiency of the current process, Currently, green hydrogen production is limited
any power cost that goes into the process to demonstration projects. By September 2020,
translates into roughly 1.5 times this value in final
there were almost 320 of these, adding up to
production costs. This means that a power cost of
around 200 MW of electrolyser capacity (IEA
USD 20/MWh results in around USD 31/MWh in
TCP). Green hydrogen (through water electrolysis)
the final cost of the hydrogen, or a figure slightly
contributed to less than 0.02% of presentday above USD 1/kg H .
global pure hydrogen production. Projects are 2
mostly in the single-digit MW scale with the
Under the optimal conditions of low-cost
largest project in operation currently a 10 MW
renewable electricity, low investment cost alkaline electrolyser in Japan. A 20 MW PEM
(achievable through the strategies suggested in
electrolyser in Becancour (Canada) by Air Liquide
this report) and a high number of operating hours,
is expected to be operational before the end of
green hydrogen could achieve cost competitiveness
2020. In spite of this small scale, the technology
with fossil-based hydrogen, noting that only about
is already commercial and ready to scale up, with
3000-4000 hours per year may be enough to projects announced between 2020 and 2025
achieve the largest reduction in the contribution
adding up to more than 25 GW and new projects
of the investment. This can be achieved by, for
being announced on almost a weekly basis (see
instance, large scale hybrid PVwind plants, which, Chapter 5, Section 2).
at the best locations in the world, can achieve
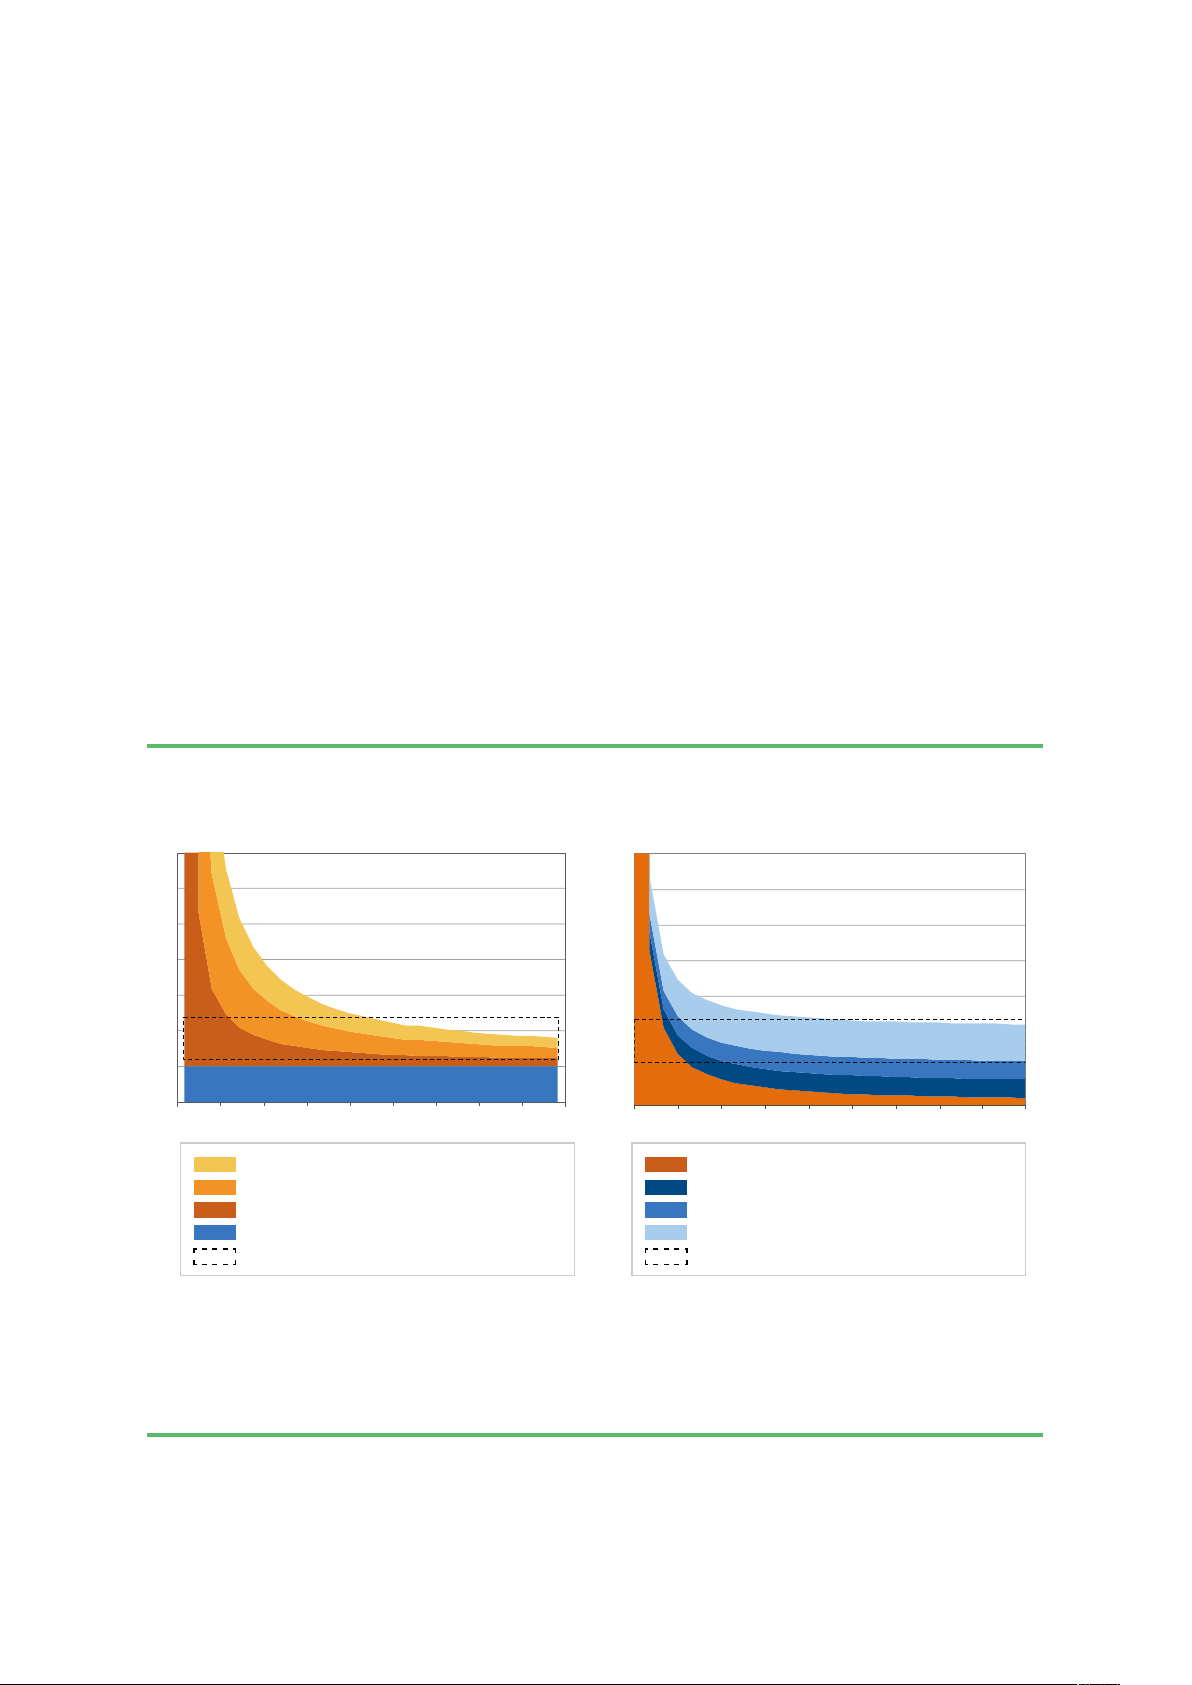
capacity factors above 5000 hours. Figure 2 Figur Figure 1.
Hydrogen production cost as a function of investment, electricity price and operating hours. 7,007 7,007 7,077,0 7 7 g)6g)g),00 /kg) g) 6,0 6, 66 g) 6 6 /kg) /k 00 ,0 6 /k /k /k 6 SD /kg)/k SD /kg)SDSD 5,00 5,0 5, 55 5 5 t (USD 00 ,0 5 t (USD t (USD t (USD 5 t (USD os os os osos 4,00 4,0 4, 4 004 4 4 ,0 4 4 tion c tion c tion c tion ction c 3,0033 3,0 3 3 3 oduc 3,00 oduc oduc oduc ,03 oduc ydrogen production cost (U
H ydrogen production cost (U 2,00 H 2, 22 2,0 002 ydrogen production cost (U 2 2 ,02 H ogen pr ydrogen production cost (U ogen pr ogen pr ogen pr H Hyr Hyr1,00 1 Hyr 1,01 1,0 01 1 1 ,01 0,00 0, 00 0,0 000 0 0 ,0 1 974 1947 2921 3894 4867 5840 6814 7787 8760 1 974 1947 2921 3894 4867 5840 6814 7787 8760 1 974 1947 2921 3894 4867 5840 6814 7787 8760 1 974 1947 2921 3894 4867 5840 6814 7787 8760 Op O e p r e a r t ain ti g n g h o h u o r u s rs Op Opeerraatitn i g ng ho hour urss Electr tr Elec oly oly ser s ser sy ser s y stss t tem c em cos em c ost (USD 77 t (USD 770 t (USD 77 0/kW) + fix /kW) + fixed c /kW) + fix os ed c ed c ts os osts Electr Elec oly tr ser s oly y ser syssttem c em c os os t (200 USD t (200 USD /kW) + fix /kW) + fixed c ed c osts osts Electr tr Elec oly oly ser s ser sy ser s y stss t tem c em cos em c ost (USD 500 t (USD 500 /kW) + fix /kW) + fixed c /kW) + fix os ed c ed c ts os osts Electricit Elec y pric tricity pric tricit e: USD 10 e: USD 10 /MW /MWh h Electr tr Elec oly oly ser s ser sy ser s y stss t tem c em cos em c ost (USD 200 t (USD 200 /kW) + fix /kW) + fixed c /kW) + fix os ed c ed c ts os osts Electricit Elec y pric tricity pric tricit e: USD 20 e: USD 20 /MW /MWh h Electricit tricit Elec y pric y pric e (20 USD e (20 USD /MW /MWh) /MW h) Electricit Elec y pric tricity pric tricit e: USD 40 e: USD 40 /MW /MWh h Blue h Blue h y y dr dr ogen c ogen cos ogen c os t r os t range ange Blue hy Blue hdr y ogen c drogen c os os t r t r ange ange
Note: Efficiency at nominal capacity is 65% (with an LHV of 51.2 kWh/kg H ), the discount rate 8% and the stack lifetime 2 80 000 hours. Based on IRENA analysis. 18
SCALING UP ELECTROLYSERS TO MEET THE 1.5°C CLIMATE GOAL
1.2 LATEST HYDROGEN POLICY DEVELOPMENTS
Previous waves of interest in hydrogen have of hydrogen policies in such a short period of
been triggered by oil supply shocks, with this time is the widespread recognition that in order
technology seen as a way to diversify away from oil
to achieve the objectives of the Paris Agreement,
and improve energy security. In recent years, with
green hydrogen has a key role to play in reaching
the focus on net zero emissions and plummeting
zero emissions from the energy sector (IRENA,
renewable costs, interest in other sectors has 2020b, 2020c).
become more prominent. As a consequence, most
of the existing policy support for hydrogen is for
While some strategies support fossil-based
fuel cell electric vehicles and refuelling stations
hydrogen in the short-term, as a transitional
(IRENA, 2020d). This is set to change in the coming
technology for scaling up, there is widespread
years as focus changes to sectors with existing
support for green hydrogen as the long-term,
hydrogen demand (industry) and replacement of
sustainable solution. Support is also more fossil-based hydrogen.
widespread today, with more countries supporting
green hydrogen compared to blue. Amongst
Promoting hydrogen uptake across the various end-
countries that support only one technologyical
use sectors requires an integrated policy approach.
pathway, there are also more supporting only
The main pillars of this are: national hydrogen green hydrogen than only blue. As recently
strategies that bring all the elements together, set
as 2020, eight jurisdictions around the world
a long-term vision shared with industry and guide
announced hydrogen strategies and at least ten
efforts from multiple stakeholders; setting policy
more are expected in 2021. These strategies,
priorities for sectors where hydrogen could add
however, are neither the beginning nor the end of
the most value according to national conditions;
the role of hydrogen in decarbonising energy. They
governance systems and enabling policies that are the result of investment, starting in the 1970s,
remove barriers and facilitate growth; guarantees
in energy application research and development
of origin systems to track production emissions
(R&D) that has enabled technological progress
and be able to value the lower GHG emissions
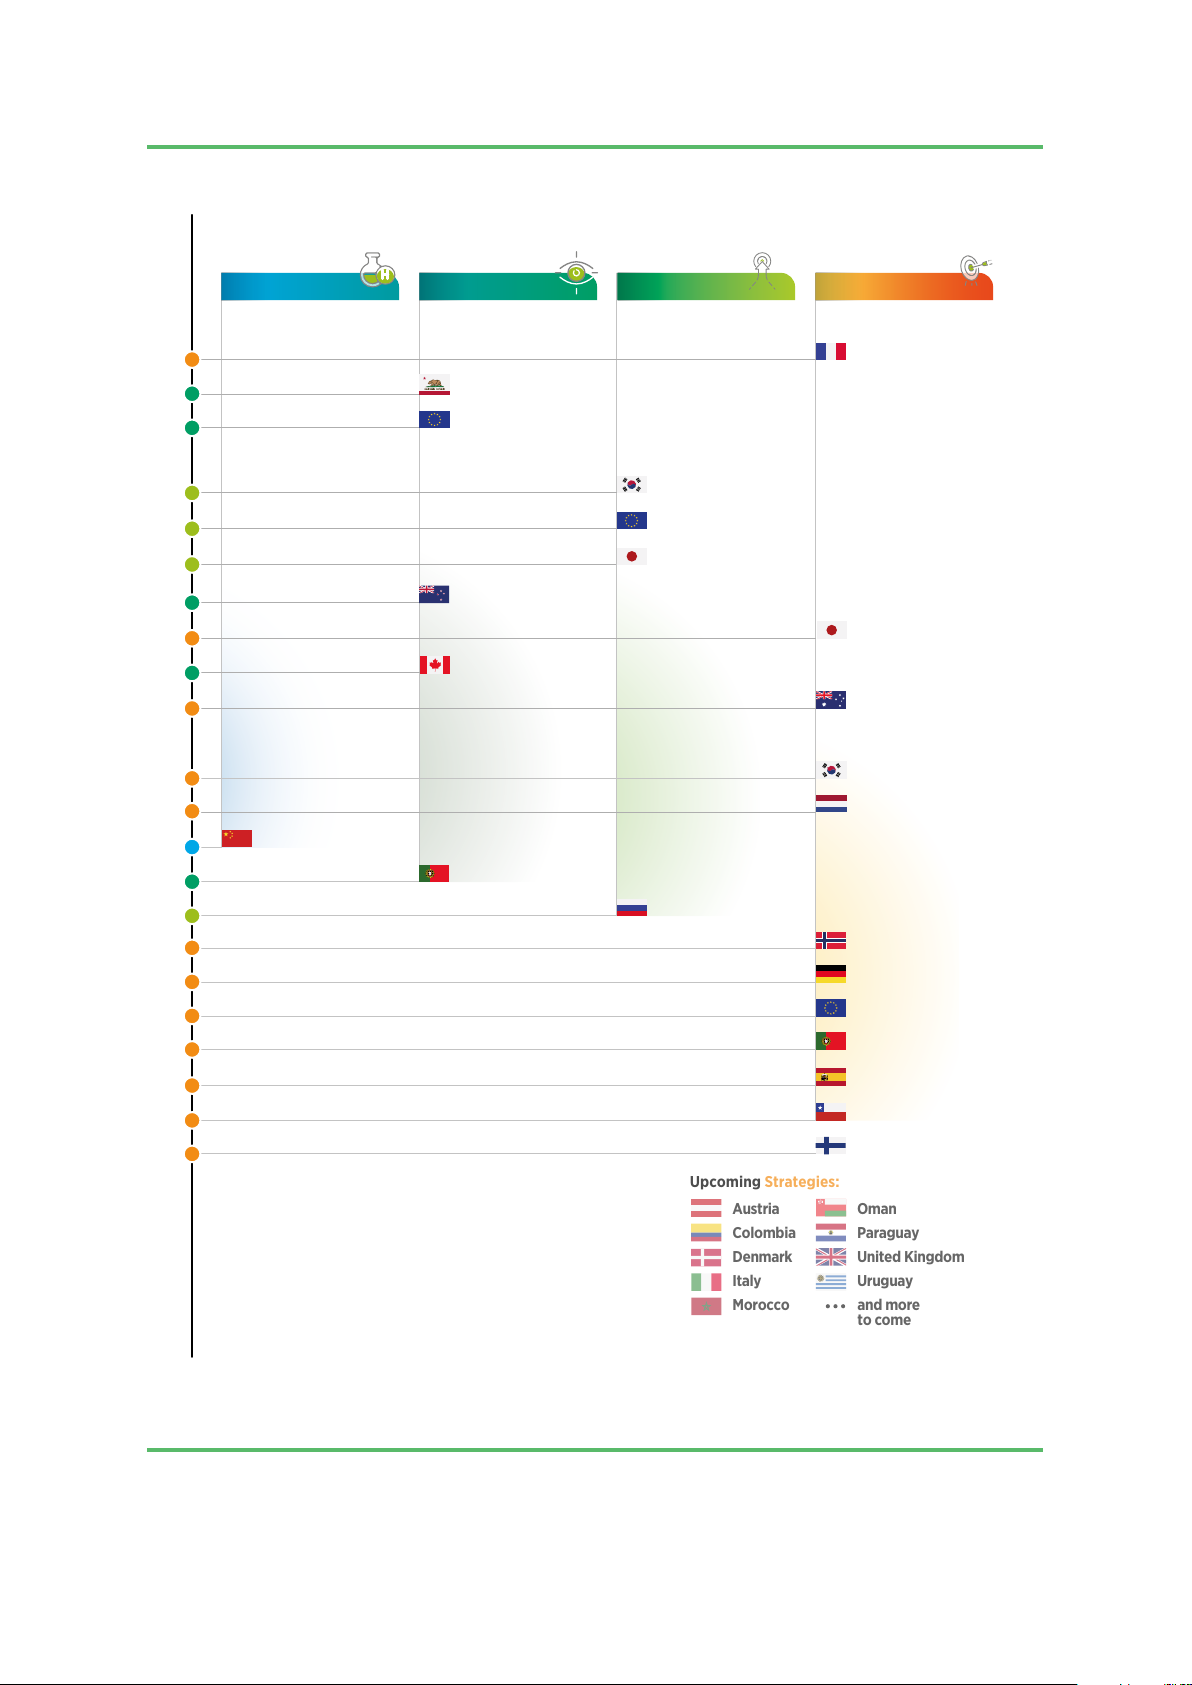
and close cooperation between private and public (IRENA, 2019a, 2020c).
actors. This has taken place through partnerships,
culminating in vision documents or roadmaps that
Over the last few years, an increasing number of
pave the way for more concrete policy actions by
countries have adopted hydrogen policies and aligning long-term views. These strategies are not
strategies. These differ in scope (e.g. with a focus
the end of the process, however, since they must
on green hydrogen, fossil-based, or a combination
be followed by impact assessments, policy design,
of the two) and scale (from no targets to very
financial viability and implementation. In the last
ambitious, quantified hydrogen as well as two years, though, there has been a significant
electrolyser targets). What emerges clearly from
increase in public efforts towards achieving these
this rapid increase in the number and ambition goals (see Figure 2). 19
GREEN HYDROGEN COST REDUCTION Figure 2.
Recent hydrogen policies and strategies. R&D PROGRAMMES VISION DOCUMENT ROADMAP STRATEGY 2018 France Strategy California Vision document European Union Vision document 2019 Republic of Korea Roadmap European Union Roadmap Japan Roadmap New Zealand Vision document Japan Strategy Canada Vision document Australia Strategy 2020
Republic of Korea Strategy Netherlands Strategy China R&D programme Portugal Vision document Russia Roadmap Norway Strategy Germany Strategy European Union Strategy Portugal Strategy Spain Strategy Chile Strategy Finland Strategy Upcoming Strategies: Austria Oman Colombia Paraguay Denmark United Kingdom Italy Uruguay Morocco and more to come Source: (IRENA, 2020d). 20