Marketing 4.0: Impact on Customer Satisfaction & Purchase Intention (2021) | Môn Business research method - Trường Đại học Quốc tế, Đại học Quốc gia Thành phố Hồ Chí Minh
The Internet has changed the world of marketing forever. The increased connectivity and access to information have disrupted, or at least forced to evolve, many of the existing marketing platforms and models. Tài liệu được sưu tầm gồm 14 trang, giúp bạn ôn tập tốt hơn. Mời các bạn đón xem.
Môn: Business research method 10 tài liệu
Trường: Trường Đại học Quốc tế, Đại học Quốc gia Thành phố Hồ Chí Minh 2 K tài liệu
Tác giả:


Preview text:
lOMoAR cPSD| 59078336
Journal of Business Research 122 (2021) 608–620
a College of Administration and Finance, Saudi Electronic University, Saudi Arabia b Rollins College, USA
c University of Puerto Rico, San Juan, PR, USA d Distinguished Scholar, Indian
Institute of Management- K, Kerala, India A R T I C L E I N F O A B S T R A C T Keywords:
This study explores the evolution of Marketing 4.0 and empirically examines its impact on customer satisfaction and purchase Marketing 4.0
intention. Marketing 4.0, an upgrade to the previous Marketing 3.0 model, aims to include the influence of brand interaction Customer satisfaction
in the digital age. This study provides an empirical test of this newer model by analyzing all four of its components with Purchase intention
customer satisfaction and purchase intention. Using structural equation modeling to analyze 508 prospective real estate first- Branding
time homebuyers, this study evaluates the role of the components of Marketing 4.0 in maximizing customer satisfaction and Millennials
influencing purchase intentions. Findings indicate that brand identity and brand image are significant factors in determining
customer satisfaction and purchase intention. Furthermore, the impact of customer satisfaction on purchase intention is highly
significant. Unexpectedly, and counter-intuitively, there was not a significant relationship between brand integrity or brand
interaction on customer satisfaction and purchase intention. Considering the study’s participants (Gen-Z/ Millennial first-time
homebuyers) and the international context of the study (the northern Indian real estate market), this study provides important
insights into burgeoning international industries and their prime future target market. Furthermore, this study indicates that,
a Marketing 4.0 approach that focuses on brand identity and brand image may influence customer satisfaction and,
subsequently, increase customers’ purchase intentions. 1. Introduction
few years, namely, demonetization, the Real Estate Regulation and
Development Act, 2016 (RERA), and the Goods & Service Tax (GST). For
The Internet has changed the world of marketing forever. The increased
instance, RERA regulates real estate transactions and by doing so protects
connectivity and access to information have disrupted, or at least forced to
buyers. RERA prohibits unaccounted money from being pumped into new real
evolve, many of the existing marketing platforms and models. The Internet has
estate projects and mandates that builders use fair pricing methods based on
become so ubiquitous in the modern business environment, that nearly no
“carpet areas” rather than “super built up areas” and other less-transparent
firm, big or small, can escape its influence. As client connectivity and social
marketing tactics (“Lok Sabha”, 2016). While the industry is modernizing, there
media continue to expand, so do the types and shapes of customer
has been an increase in attention on brand interaction, particularly among the
interactions, making the Internet easier and more powerful than ever before.
large and growing segment of Gen-Z/Millennials homebuyers. Marketing 4.0
The Internet has been so influential, that recently scholars have developed a
has evolved from the prior Marketing 3.0 model to address the changes in the
new approach to marketing—Marketing 4.0 (Kotler et al., 2016; Jara, Parra &
industry and its growing clientele by introducing brand interaction.
Skarmeta, 2012)—to accommodate its influence. Marketing 4.0 calls for a shift
Faced with increasing regulatory restrictions that protect new homebuyers
from simply using traditional means to more digital approaches to reach
and rapid technological innovation, the real estate industry may determine that
customers and develop customer relationships (Kotler et al., 2016). It combines
Gen-Z/Millennial customers are a critical customer segment. Satisfying these
online and offline interaction between companies and customers in the digital
younger, newer homebuyers is likely to be very important because customer
economy (Kotler et al., 2016). As Kotler and his co- authors (2016) explain, in
satisfaction is a key construct in the service quality and service loyalty
the growing digital economy, it is insufficient to simply interact with customers,
relationship (Caruana, 2002). Not surprisingly, prior research has shown that
but rather firms must authentically blend “style with substance” to be more
enhancements of service quality perceptions via Marketing 4.0 tools has
flexible and adaptive to rapid technological changes.
boosted purchase intention and buying activity (Gonzalez et al., 2007; Boulding
As a relatively new theoretical model, Marketing 4.0 is currently under-
et al., ´ 1993) and that customer satisfaction stimulates purchase intentions
studied, particularly empirically. As such, this paper applies the novel (Kuo et al., 2009).
Marketing 4.0 model to a real estate industry that has experienced turbulence
This research is important and timely because it enhances scholars’ and
coupled with a global recession and significant technological advancements.
practitioners’ understanding of the consumer experience in the digital
Beyond the turbulence experienced during the recent global recession, the real
economy, and contributes to existing literature in many ways. First, this study
estate industry in India has experienced three distinctive disruptions in the last
explores real-life marketing in the digital economy and provides a portal into
E-mail addresses: g.dash@seu.edu.sa (G. Dash), kkiefer@rollins.edu (K. Kiefer), justin.paul@upr.edu (J. Paul).
https://doi.org/10.1016/j.jbusres.2020.10.016
Received 13 February 2020; Received in revised form 3 October 2020; Accepted 6 October 2020 Available online 15 October 2020
0148-2963/© 2020 Elsevier Inc. All rights reserved. lOMoAR cPSD| 59078336
G. Dash et al. Journal of Business Research 122 (2021) 608–620
the effectiveness of marketing in the digital world. Second, this study furthers
clear management understanding of Marketing 4.0 and its internal and
our exploration of the appropriate marketing mix to reach new customer
external relationships is a clear gap in literature that we intend to begin to fill
segments. As technology advances, our methods and techniques to reach them
here (Vassileva, 2017). In the following paragraphs we explore each of the
are changing dramatically and firms that fail to evolve and adapt to changes in
elements of Marketing 4.0 and establish testable relationships between these
technology place themselves at risk. Third, this study is important because it
elements and customer satisfaction and purchase intentions. 2.1. The elements
addresses a gap in existing research by empirically examining the influence of of marketing 4.0
the various elements of the Marketing 4.0 model. Without a clear
understanding of the intricacies of Marketing 4.0, scholars and practitioners
Brand identity examines positioning decisions and how the brand is
alike will be limited in their ability to adequately reach and meet customer
perceived in consumers’ minds. Brand identity is a unique set of brand
expectations in the digital world.
associations that the brand strategists aspire to create or maintain. These
In the following section, this study reviews existing Marketing 4.0 research
associations represent what the brand stands for and imply a promise to
and other web-based marketing literature and then develops testable
customers from the organization (Aaker, 1996). In essence, while brand image
hypotheses regarding the relationships between Marketing 4.0 elements,
is the perception from the consumer side, brand identity is the projection of
customer satisfaction and purchase intention. Next, this paper presents the
the brand by the seller. Each brand tries to reach out to consumers by using
methodology and explores the results. Finally, this study discusses the findings,
various tools. For instance, firms tend to use a combination of marketing tools
presents theoretical and practical implications, and explores study limitations
such as distribution channel, public relations, price, promotion, core service
and future research opportunities.
and systems (Goi et al., 2014), to reach potential customers. To assess brand
identity, Rajagopal (2008) presents the PIRT scale which includes personality,
2. Prior literature and conceptual framework
image, reputation and trust. In another assessment perspective, Tsaur et al.
(2016), examines identity as a sum of five elements: image, quality, personality,
Kotler et al. (2016) introduced the concept of Marketing 4.0 as the
awareness and culture (Tsaur et al., 2016). An examination of the personality
integration of four elements: Brand Identity, Brand Image, Brand Integrity, and
element reveals five sub-dimensions: sincerity, excitement, competence,
Brand Interaction. The first three elements were part of Marketing 3.0 (a.k.a.,
sophistication, and ruggedness (Aaker, 1997). In short, brand identity is a very
3i) (Kotler et al. 2011) and the movement to Marketing 4.0 suggests a shift
complex construct requiring the consideration of many elements for an
toward a more inclusive, horizontal and social approach to marketing. The adequate assessment.
Internet of Things (IoT) and the latest available tools surrounding Web 3.0 has
Brand image is “largely a subjective and perceptual phenomenon that is
changed the marketing mix and ushered in the Marketing 4.0 movement.
formed through consumer interpretation, whether reasoned or emotional”
According to Dholakia, Zwick, & Denegri-Knott (2010), increasing global
(Dobni & Zinkhan, 1990:118) and is a multi-dimensional construct
markets that are tightly coupled with increasing information-producing,
incorporating perceptions of quality, value, attitude as well as brand information-manipulating, information-distributing, and information-
associations and feelings (Kirmani & Zeithaml, 1993; Paul, 2018; 2019). As
consuming technologies present an evolution that clearly leads to new ways to
Riezebos and Riezebos (2003:63) explain, “brand image is a subjective mental
reach, collaborate and influence potential consumers. Greater information
picture of a brand shared by a group of consumers” and actually makes it easier
technology integration, especially the Internet, has opened the door to a new
to evaluate more features in less time (Biel, 1992; Zhang, 2015). Attending to
generation of consumers that are far savvier and expect to participate (i.e.,
the wants, needs and desires of customers can lead to the enhancement of
interact with products) by providing their experiences and performing checks
transactions between customers and the goods and services they acquire
and balances on today’s goods and services (Jara,
(Kotler et al., 2016). In the real estate sector, a sector experiencing major Parra, & Skarmeta, 2012).
reforms, builders may be able to leverage a positive brand image to enhance
As such, marketing has had to evolve from more push-oriented marketing
their brand equity. For instance, prior research indicates that improving brand
models, generating messages that are sent to consumers, to a more
image actually boosts purchase intention (Keller, 2001; Cretu & Brodie, 2007).
collaborative-oriented process where the consumer is part of the marketing
The image includes three elements, mystery, sensuality and intimacy, and these
scheme (Gilal et al., 2019; Paul & Mas, 2019). This change is complex and
elements represent facets of the cognitive, sensory, and emotional dimensions
marketers are learning that they have far less control in their messaging then
of a brand (Cho, 2011; Roberts, 2004). As Neupane (2015) explains, elements
they used to possess. In fact, Labrecque et al., (2013) discusses the existence
of a successful brand are innovative, focused, passionate, consistent, flexible,
of an accelerating shift in control from the marketer to the consumer.
competitive, leadership and distinction. For great brands, innovation becomes
Simultaneously, however, marketers are learning the potential power in this
a focus because it prevents complacency and eliminates the dangers of being
new arrangement where they can now leverage active participating consumers
idle (Neupane, 2015). As Neupane (2015) expresses, brand image must offer a
to help them distribute their messages. This co-creative environment, although
better-perceived quality, improved customer satisfaction, and enhanced
challenging in many ways, creates new ways to better meet consumer demands
loyalty and commitment, along with the competence of the product or service
and expectations (Kohler et al., 2011). Kohler et al. (2011) explains that when being delivered.
participants experience an inspiring, intrinsically motivating, and fun co-
Brand integrity, also known as brand credibility, refers to keeping promises
creation experience, they participate more intensely.
made to customers with the help of proper positioning and differentiation
The introduction of brand interaction as a fourth element to complete the
techniques. Credibility is a critical factor in building the trust that enhances a
Marketing 4.0 model has proven to be salient, highly relevant, and easily
long-term relationship (Aaker, 1996). Brand credibility influences an evoked set
measurable when used in concert with digital tools and platforms (Jara et al.,
of alternatives (Erdem & Swait, 2004) and lowers perceived risk (Erdem &
2014). However, digital technologies also present disruption to the old way of
Swait, 1998). Furthermore, credibility is a combination of ability to provide
doing business and requires significant changes by organizations to compete in
(expertise) and willingness to do so (trustworthiness) for seamless delivery of
the new environment (Vassileva, 2017). For instance, Vassileva (2017)
what was promised to the customers. The success of a brand stands and falls
recommends that organizations must learn to integrate contemporary
with its perceived integrity, that is, the public sentiment of a brand’s proven
marketing models to meet the new demands in the information technology
and trusted ability to fulfil its brand promise (Campelo et al., 2011; Joshi &
environment. Moreover, the technology is important and influential, but as
Garg, 2020). In addition to the two dimensions, sincerity, clarity, perceived
Kane et al. (2015) reminds us, it is strategy, not technology, that is driving the
quality and perceived risk are also items for measuring brand credibility.
digital transformation. Consequently, it is incumbent upon marketers to better
Brand interaction is based on the customer experience and is increasingly
understand how the constructs involved in Marketing 4.0 work, relate and
more about participation by, and collaboration with, customers in the
interact with one another and impact consumer decision behavior. A lack of a
development of products and services than ever before. The increasing amount lOMoAR cPSD| 59078336
G. Dash et al. Journal of Business Research 122 (2021) 608–620
and pace of changes in technology has a lot to do with the increasing role of
brand interaction in Marketing 4.0. The rise of semantic web along with the
ubiquity of technology has made the interaction of brand with the consumers’
real-time and continuous (Gensler et al., 2013). With the evolution of the web,
consumers are highly engaged with brands via social media (Li, 2010). All three
prior existing elements of Marketing 3.0—identity, image and integrity—can
influence customers positively only when the brand interacts with the
customers effectively. Consumers perform three functions while interacting
with the brand, namely consumption, contribution and creation (Schivinski et
al., 2016). Along with these dimensions, there are a few more items that help
us assess brand interaction including integrity of the consumers, ethical
stimulation by consumers and keeping the brand green (Huh et al., 2009).
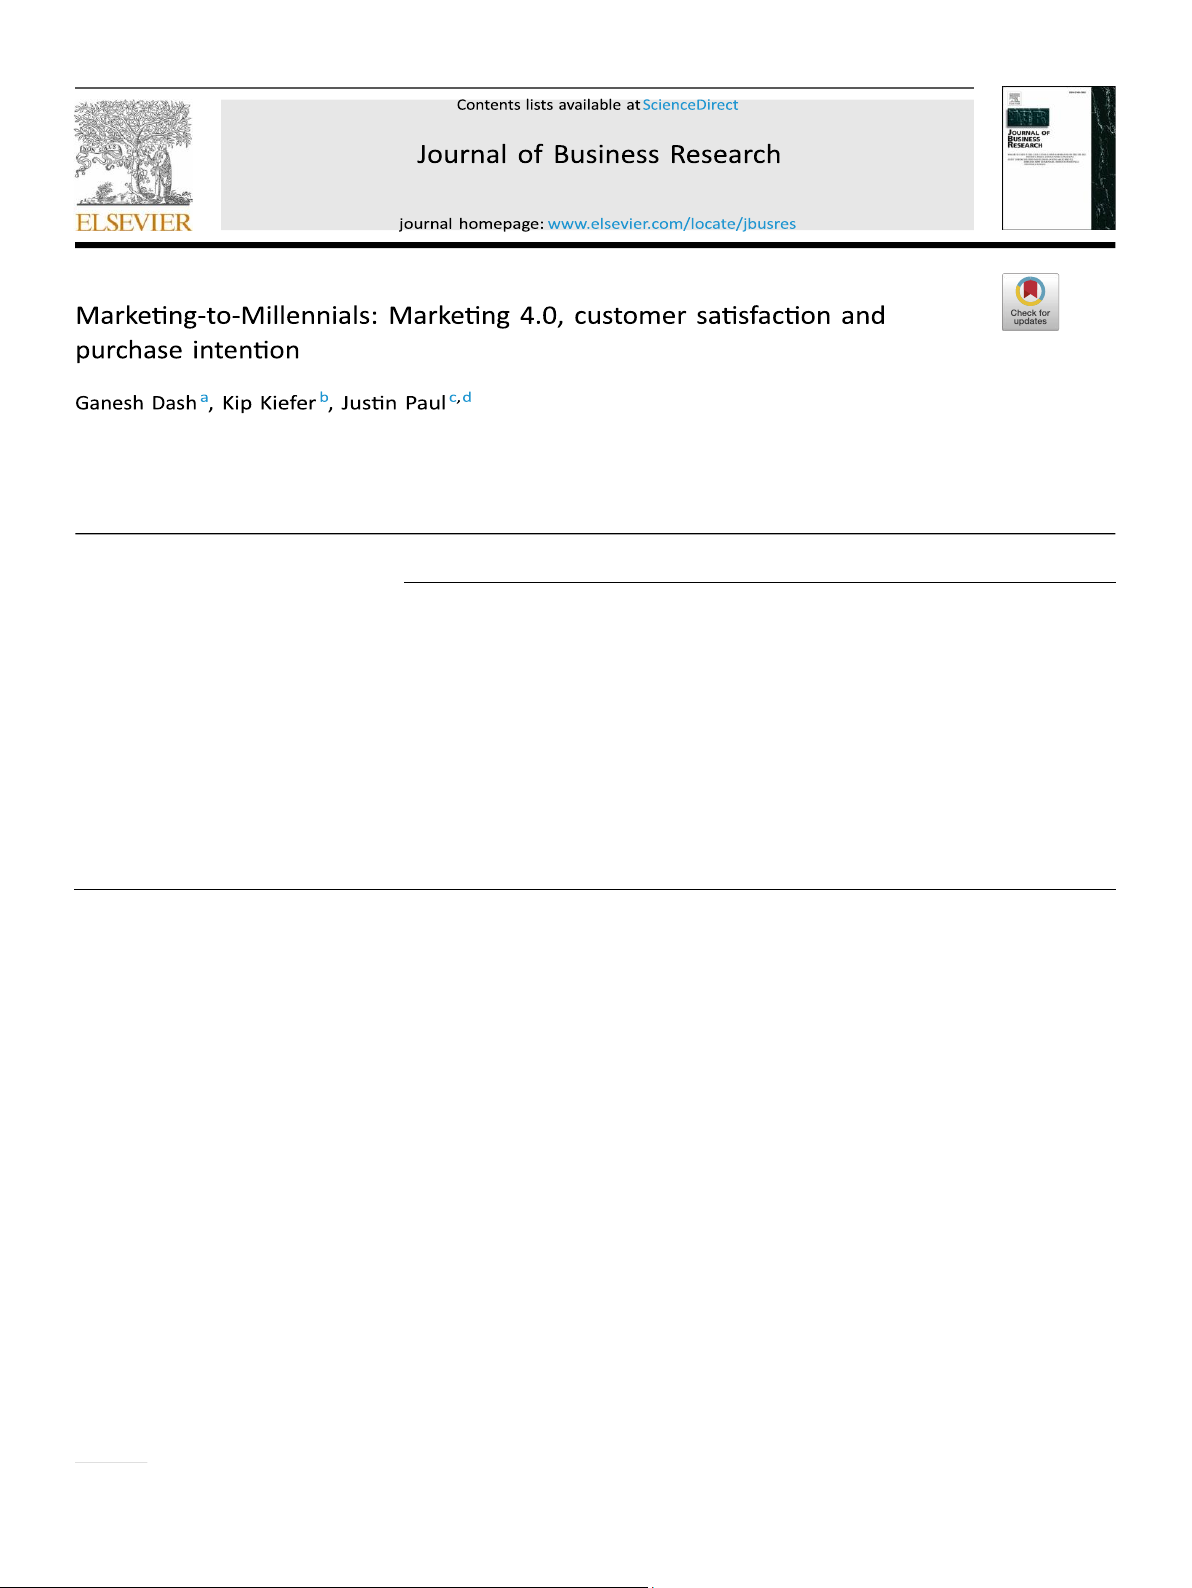
The conceptual model (see Fig. 1) includes the four constructs for
Marketing 4.0 and shows the relationships between these four constructs with
customer satisfaction and purchase intention.
2.2. Relationship between brand identity and customer satisfaction (CS)
Customer satisfaction is deeply influenced by the identity of the brand
(Ahearne et al., 2005). Individual consumers often use brand
Fig. 1. Conceptual Model. lOMoAR cPSD| 59078336
G. Dash et al. Journal of Business Research 122 (2021) 608–620
identity as a way to exhibit their individual identity; therefore, the identity of
projected image and this is crucial in a competitive marketplace where firms
the brand plays a major role in raising the level of customer satisfaction (Carroll
are selling similar products or services. In fact, some scholars have found that
& Ahuvia, 2006; Fennis & Pruyn, 2007). A unique brand identity is a very
a positive relationship between brand image and consumer’s self-image
important factor for increased level of customer satisfaction at the ‘moment of
contributes to the behavioral intentions of consumers toward that brand
truth’ (Lu et al., 2008). A customer tends to be more satisfied compared to
(Jamal & Goode, 2001; DeShields et al., 2005; Paul, 2019). A strong brand
fellow customers (in a competitive market) if his preferred brand has a distinct
image, therefore, helps a brand develop the trust and approval of consumers
brand identity (Berger & Heath, 2007; Ruvio, 2008). An enhanced brand
and this influences their purchase decisions (Keller, 1993; Kumar, Paul &
identity is necessary to boost customer satisfaction (Cornwell and Coote,
Unnithan, 2020). Considering the nature of the real estate industry, brand
2005), provide prestige to the customers (Fuller et al., 2006), positively affect
image is a key determinant in final purchase decisions (Koo, 2003) and a
customer enjoyment (Chun & Davies, 2006; Steenkamp et al., 2003) and
positive and appealing brand image raises customers’ perception of quality and
increase the trust quotient of customers (Berens et al., 2005; Voeth & Herbst,
lowers their perceived risk (Dodds et al., 1991; Aghekyan et al., 2012). As such,
2008). Consequently, in line with prior research, this paper hypothesizes that:
this paper proposes the following relationship between brand image and
purchase intention: H2 (b). Brand Image has a positive relationship with H1 (a).
Brand Identity has a positive relationship with Customer
Purchase Intention 2.6. Relationship between brand integrity and customer Satisfaction satisfaction
2.3. Relationship between brand identity and purchase intention (PI)
Brand integrity is the third element in Marketing 4.0 framework and it
affects both customer satisfaction in a similar fashion as the two previous
Numerous factors affect purchase intention; however, brand identity is
elements. Brand integrity is crucial because consumers expect brands to deliver
commonly considered critical among these factors because it provides a link
on their promises. The promise of a brand sets the expectation for the brand
between customers and marketers (Temporal, 2006). Bruwer & Buller (2012)
and if a brand fails to meet consumer’s expectations, serious negative
found that brand identity is a key determinant of purchase intention and
consequences may occur (Campelo et al., 2011). Furthermore, the impact of
Mengzia (2007) found that consumer’s preference, loyalty and resultant
brand identity failures tends to have long-term effects on customer
purchase intention are deeply affected by the brand identity. Various facets of
satisfaction. Conversely, brand integrity has a positive impact on customer
brand identity have a direct effect on the behavioral intention of consumers
satisfaction because it directly correlates with consumer trust and loyalty
(Akin, 2011). At the turn of the century, marketers recognized the importance
which drives the level of customer satisfaction (Shugan, 2002). As Shugan
of brand identity and now make a distinct and clear effort to develop identity
explains, a positive brand integrity raises the market share of the brand
to capture consumer preference, usage, and purchase decision (Das, 2012).
because loyal customers develop clear and predetermined purchase decision-
Toldos-Romero and Orozco-Gomez (2015) ´ found that brand identity and its
making processes that favor brands with strong perceived brand integrity.
various parameters are highly related with boosting purchase intention.
Furthermore, a positive brand integrity reflects the level of commitment
Furthermore, Bataineh (2015) explains that consumers tend to purchase more
assured by the brand and acts like an unofficial guarantee. Therefore, a high-
of the product when the brand contributes to status enhancement and
level of perceived brand integrity has a positive impact on customer
additional value through a proper and distinctive brand identity. In line with
satisfaction and often creates an exclusive group of loyal customers (Atilgan et
prior research, this paper proposes the following relationship between brand
al., 2005). A long-term relationship with the customers can be built by raising
identity and purchase intention:
the level of perceived brand integrity and, therefore, suggest that:
H2 (a). Brand Identity has a positive relationship with Purchase Intention H1 (c).
Brand Integrity has a positive relationship with Customer Satisfaction
2.4. Relationship between brand image and customer satisfaction
2.7. Relationship between brand integrity and purchase intention
In a similar fashion to the relationship between brand identity and purchase
intention, a well-constructed brand image may drive positive customer
A brand has to live up to the perceived values and commitments of the
satisfaction. Prior literature indicates that brand image corresponds with
brand and if it lives up to these promises, then purchase intentions is enhanced
increases in consumers’ usage satisfaction and consumer product referrals
(Beverland, 2011; Napoli et al., 2014). For a consistent positive impact on
(Rory, 2000). Yang (2006) found that the projected image of the brand plays a
purchase intention, brands must deliver on their promises and if they can
large role in improving satisfaction and other scholars also identified a strong
manage to deliver levels of integrity above what they promised, they may even
and positive relationship between brand image and customer satisfaction (Shi,
enjoy stronger levels of customer satisfaction and customer loyalty (S¸ahin et
2006; Zhang & Mo, 2008). Apparently, customers try to gain value from brand
al., 2011). The brand with higher level of perceived integrity influences the
images and this value can be manifested via promotional tools and customer
consumer in a positive manner (McKnight et al., 2002) and if a brand is
satisfaction (Grewal & Levy, 2010) and by building customer loyalty (Davies et
perceived to have integrity, it is trusted by the consumers and has a higher
al., 2003; Da Silva & Syed, 2008). For instance, in the hospitality industry, brand
correlation with positive purchase intentions (Lau & Lee, 1999). Even in crisis,
image plays a dominant role in influencing positive customer satisfaction,
scholars have identified how brand integrity plays a huge role in gaining
improving customer loyalty and, subsequently, increasing purchase intention
consumers’ trust and this trust drives customer’s purchase intentions
(Chang and Tu, 2005; Chitty et al., 2007). Therefore, this study suggests that
(Yannopoulou et al., 2011; Butler, 1991). Therefore, this study suggests that the
the following relationship exists between brand image and customer
relationship between brand integrity and customer satisfaction is as follows: satisfaction:
H2 (c). Brand Integrity has a positive relationship with Purchase Intention H1 (b).
Brand Image has a positive relationship with Customer Satisfaction
2.8. Relationship between brand interaction and customer satisfaction
2.5. Relationship between brand image and purchase intention
As prior research has shown, all of the three preceding elements of the
As foreshadowed above, the impact of brand image on purchase intention
original Marketing 3.0 Model, Identity, Image and Integrity, can influence
is also very important. This relationship provides a unique association with the
customers satisfaction positively, but these relationships are evolving in the
customers that is crucial for retention as well as boosting purchase intention
digital age. In the digital age, Brand Interaction (customers’ experiences with
(Schiffman & Kanuk, 2010). The uniqueness of the brand is driven by the
the brand) plays an important role in shaping customer satisfaction and
enhancing these relationships between customers and brands (Morrison and lOMoAR cPSD| 59078336
G. Dash et al. Journal of Business Research 122 (2021) 608–620
Crane, 2007). Brands should adopt digital means, including social media, for
time comes to pay for the product, consumers normally compare their
convenient connections with consumers. Depending on the level of interaction,
perceived value with the actual price and then make their final purchase
customers develop an experience quotient that might be positive or negative.
decision. The intention originates from the tendency and it is a combination of
It can be short- term or long-term and this interaction influences customer
willingness, capability, chance, and the potential for the consumer (Kimery &
satisfaction (Zarantonello & Schmitt, 2010). Hence, brands ought to develop a
McCord, 2002). Moon et al., (2008) divided purchase intention into three
mechanism to reach out to the consumers to keep them satisfied and generate
factors: social, personal and psychological and some recent literature has
positive experiences. Digital sociability provides insights that can be leveraged
provided a five-dimension construct representing purchase intention including
to help marketers develop marketing strategies based on their interaction with
the willingness to buy, capability to buy, future intentions to buy, repurchase
consumers (Huh et al., 2009). Therefore, this paper suggests that the
decisions and need to purchase (Shao et al., 2004; Blackwell et al., 2001). In
relationship between brand interaction and customer satisfaction is as follows:
short, if the perceived value exceeds the cost to purchase, consumers are
satisfied and inclined to make the purchase. If, on the other hand, the H1 (d).
Brand Interaction has a positive relationship with Customer
perceived value fails to meet or exceed consumers’ costs, consumers are Satisfaction
dissatisfied and will determine not to make the purchase. Consequently, this
study suggests that the relationship between customer satisfaction and
2.9. Relationship between brand interaction and purchase intentions
purchase intentions is as follows:
Once brands engage with consumers, the purchase intentions of consumers
H3. Customer Satisfaction has a positive relationship with Purchase Intention
begin to take shape and they can better influence consumer’s buying behaviors
Fig. 2 provides the path analysis for the theoretical model and the
and decisions. The inclusion of brand interaction in the Marketing 4.0 model
hypothesized relationships between the six constructs. Details regarding the
became necessary due to the rise of the semantic web along with ubiquity of
analysis of the constructs and their relationships are provided in the following
the Internet of Things and has made the interaction of brands with consumers methodology section.
real time and continuous. Brands use modern social media to enhanced
customer satisfaction and purchase intentions by sharing all of the information 3. Methodology
regarding the brand that customers desire (Gensler et al., 2013; Sreejesh et al.,
2020). Parent et al. (2011) discussed the necessity to use multiple elements of
Data was collected via a survey. Initial trial interviews/surveys were
social media to boost consumer involvement in co-creation. In fact, today,
conducted in-person and online to verify that, in general, participants
more than ever, consumers are actively interacting with the brand and are
understood all of the elements of the conceptual framework. Additionally, our
seeking increased roles in the consumption process. Brands must interact with
initial trials also indicated that respondents were, generally, adequately well-
the consumers continuously to enhance purchase intention (Parent et al.,
versed with all of the items applied in the study. The approved and verified
2011). As such, the semantic web and social media platforms have created a
survey was administered online. We received an excellent 63% response rate
space for instant feedback and peer group reviews that influence purchase
of usable survey replies (508 usable responses out of 800 requests).
intentions (Hernandez et al., ´ 2012) and brands must provide a better
experience to influence buying behaviors positively (Doorn et al., 2010).
Therefore, this study suggests that the relationship between brand interaction
and purchase intentions is as follows:
H2 (d). Brand Interaction has a positive relationship with Purchase Intention
2.10. Relationship between customer satisfaction and purchase intention
All of the four components of marketing 4.0 are closely linked to customer
satisfaction, which, in turn, influences purchase intention. Customer
satisfaction has become an important construct in marketing (Ball et al., 2004).
Although often discussed, there is no singularly accepted measurement for
customer satisfaction. In literature, customer satisfaction tends to be a
combination of responses after the acquisition and consumption of a
product/service within a given timeline (Giese & Cote, 2000). It is always widely
considered as one of the most important constructs in the field of marketing
(McQuitty et al., 2000; Erevelles & Leavitt, 1992). Different measures or
constructs should be adopted depending on the type of product or service.
Furthermore, customer satisfaction has been considered a good indicator of
purchase intention (Reichheld & Teal, 1996), a strong predictor of customer
loyalty (Yang & Peterson, 2004), and a combination of transaction-specific
assessment and overall assessment (Teas, 1993; Rust & Oliver, 1994).
Interestingly, a major predictor of customer satisfaction is perceived service
quality (Kristensen et al., 1999; Martensen et al., 2000), but while perceived
service quality always precedes customer satisfaction, customer satisfaction
may not (always) precede purchase intention (Taylor et al., 1993). Customer
Satisfaction is normally measured by three dimensions: overall service quality,
professional competence and experience with front line employees (and this is
particularly suitable for the real estate industry) (Mouri, 2005; Oliver, 1997).
Once the consumers receive the marketing message regarding the product
or service, the behavioral tendencies build up quickly and consumers are more
apt to make a purchase (Dodds et al., 1991); however, this typically depends
on the perceived value of the product or service (Monroe, 2011). When the lOMoAR cPSD| 59078336
G. Dash et al. Journal of Business Research 122 (2021) 608–620 3.1. Sample
The sample included customers involved in prospective real estate
transactions in northern India. Responses came from customers of five firms
and were required to meet the following three criteria. First, responses needed
to be fully complete in all aspects. Second, the firms needed to adhere to the
new real estate regulations, including the Real Estate Regulation and
Development Act, 2016 (RERA). Third, respondents needed to be first-time
homebuyers who were in the process of buying a home. Most customers in the
sample are from Gen-Z (73%) and born after liberalization. The remaining
respondents were born within the next five years, such that all respondents are
considered “Millennials.” The majority of respondents are highly educated and
working in IT & other service-related industries (76%). Further, most (greater
than 50%) of the buyers are working couples. Cluster random sampling was
undertaken with regard to geographical locations in the catchment area (e.g.,
Fig. 2. Path Analysis of the Conceptual Framework and Hypotheses.
New Delhi, Ghaziabad, Noida, and Gurugram). This area was selected because
all of these cities are part of a single urban cluster. Additionally, northern India,
specifically the national capital region (NCR), is the largest urban cluster with
the highest concentration of sellers and buyers in India. Another important
criterion was compliance with RERA and the NCR has a very good RERA
compliance record. A cluster random sampling procedure was instituted and
the sampling frame was decided as per data available from the firms. The
sample was finalized by only including customers who were in the process of
finalizing their deals (i.e., an agreement exists, but registration is still pending).
Access to the customers was achieved through the five major NCR firms’
brokers and agents. Table 1 presents descriptive statistics for the sample.
3.2. Procedure & measurement
A questionnaire was developed with 21 items. Standard and reverse coded
items were included to ensure proper respondent participation. As lOMoAR cPSD| 59078336
G. Dash et al. Journal of Business Research 122 (2021) 608–620 Table 1
service quality, professional competence, and experience with front line
Demographic profile of the respondents (n = 508).
employees) (Mouri, 2005; Oliver, 1997) (S1, S2, S3) and purchase intention Category Sub-Category No of Respondents Percentage Gender Male 322 63.39 Female 186 36.61 Age (years) Below (or equals) 25 373 73.43 26–30 135 26.57 Income (INR) (p.a.) Less than 500,000 214 42.13 Above 500,000 294 57.87 Education College Graduate 367 72.24 Post Graduate & Above 141 27.76 Occupation IT & ITES 385 75.79 Self-employed & others 123 24.21 Cluster New Delhi 115 22.64 Ghaziabad 102 20.08 Noida 162 31.89 Gurugram 129 25.39 Table 2
Reliability estimates and factor loadings. Factors Scale Items Factor Loading No. of Items retained Cronbach’s α Remarks Brand Identity (BID) 1 m1 0.925 3 0.851 All three items retained 2 m2 0.769 3 m3 0.915 Brand Image (BIM) 1 m5 0.802 3 0.715 All three items retained 2 m6 0.845 3 m7 0.781 Brand Integrity (BIN) 1 m10 0.929 3 0.906 All three items retained 2 m11 0.904 3 m12 0.916
Brand Interaction (BINT) 1 m14 0.898 3 0.842
Three items retained, m16 dropped 2 m15 0.838 3 m17 0.883
CustomerSatisfaction (CS) 1 S1 0.815 3 0.868 All three items retained 2 S2 0.875 3 S3 0.897
Purchase Intention (PI) 1 P1 0.833 4 0.882
Four items retained, P4 dropped 2 P2 0.860 3 P3 0.857 4 P5 0.808
discussed in the conceptual framework, all four dimensions of the Marketing
consisted of five items (willingness to buy, capability to buy, future intentions
4.0 model were measured using multiple items for each dimension. Namely,
to buy, repurchase decisions, and need to purchase) (Shao et al., 2004;
Brand Identity (3 items) (signage, sophistication and reputation) (Tsaur et al.,
Blackwell et al., 2001) (P1, P2, P3, P4, P5). Items were developed and
2016; Rajagopal, 2008; Aaker, 1997) (m1, m2, m3); Brand Image (3 items)
determined by analyzing their relevance and suitability for the real estate
(mystery, sensuality and intimacy) (Cho, 2011; Roberts, 2004) (m5, m6, m7);
sector. 5-point Likert scales were used for all of the questions where ‘5′
Brand Integrity (3 items) (trust, expertise and sincerity) (Erdem & Swait, 2004;
reflected “strongly agree” and ‘1’ reflected
Campelo et al., 2011) (m10, m11, m12) and Brand Interaction (4 items) “strongly disagree.”
(consumption, contribution, creation and distribution) (Schivinski et al., 2016)
(m14, m15, m16, m17). Customer satisfaction consists of three items (overall lOMoAR cPSD| 59078336
G. Dash et al. Journal of Business Research 122 (2021) 608–620
3.3. Measurement model validation: analyzing normality, reliability, & validity
measures: The Parsimony Goodness-of-Fit Index (PGFI) and the Parsimonious
Normed Fit Index (PNFI). Parsimonious Comparative Fit Index (PCFI) was
Following data collection, responses were analyzed, and examined for
included as an extra measure. All of these indices well exceeded the 0.5 or
normality, reliability, and validity to confirm their suitability prior to conducting
greater standard for fit and were considered satisfactory (See Table 3).
data analysis and determining results. Skewness and Kurtosis were checked
and were within limits. The authors also performed factor analysis and
3.4. Evaluation of the measurement model
assessed Cronbach alphas for content and construct validity, as well as
reliability. Marketing 4.0 had four dimensions (12 items), CS had three items,
To further assess the various goodness of fit measures, the measurement
PI had four items, and these factors explained
model was evaluated in accordance with Fornell and Larcker (2006) (See Table
4). AVE for all of the constructs was more than 0.5. Further, Cronbach alpha for
all the constructs was more than 0.7. Similarly, MSV for all of the constructs
was less than the corresponding AVE. These values reflect no validity concerns in the measurement model.
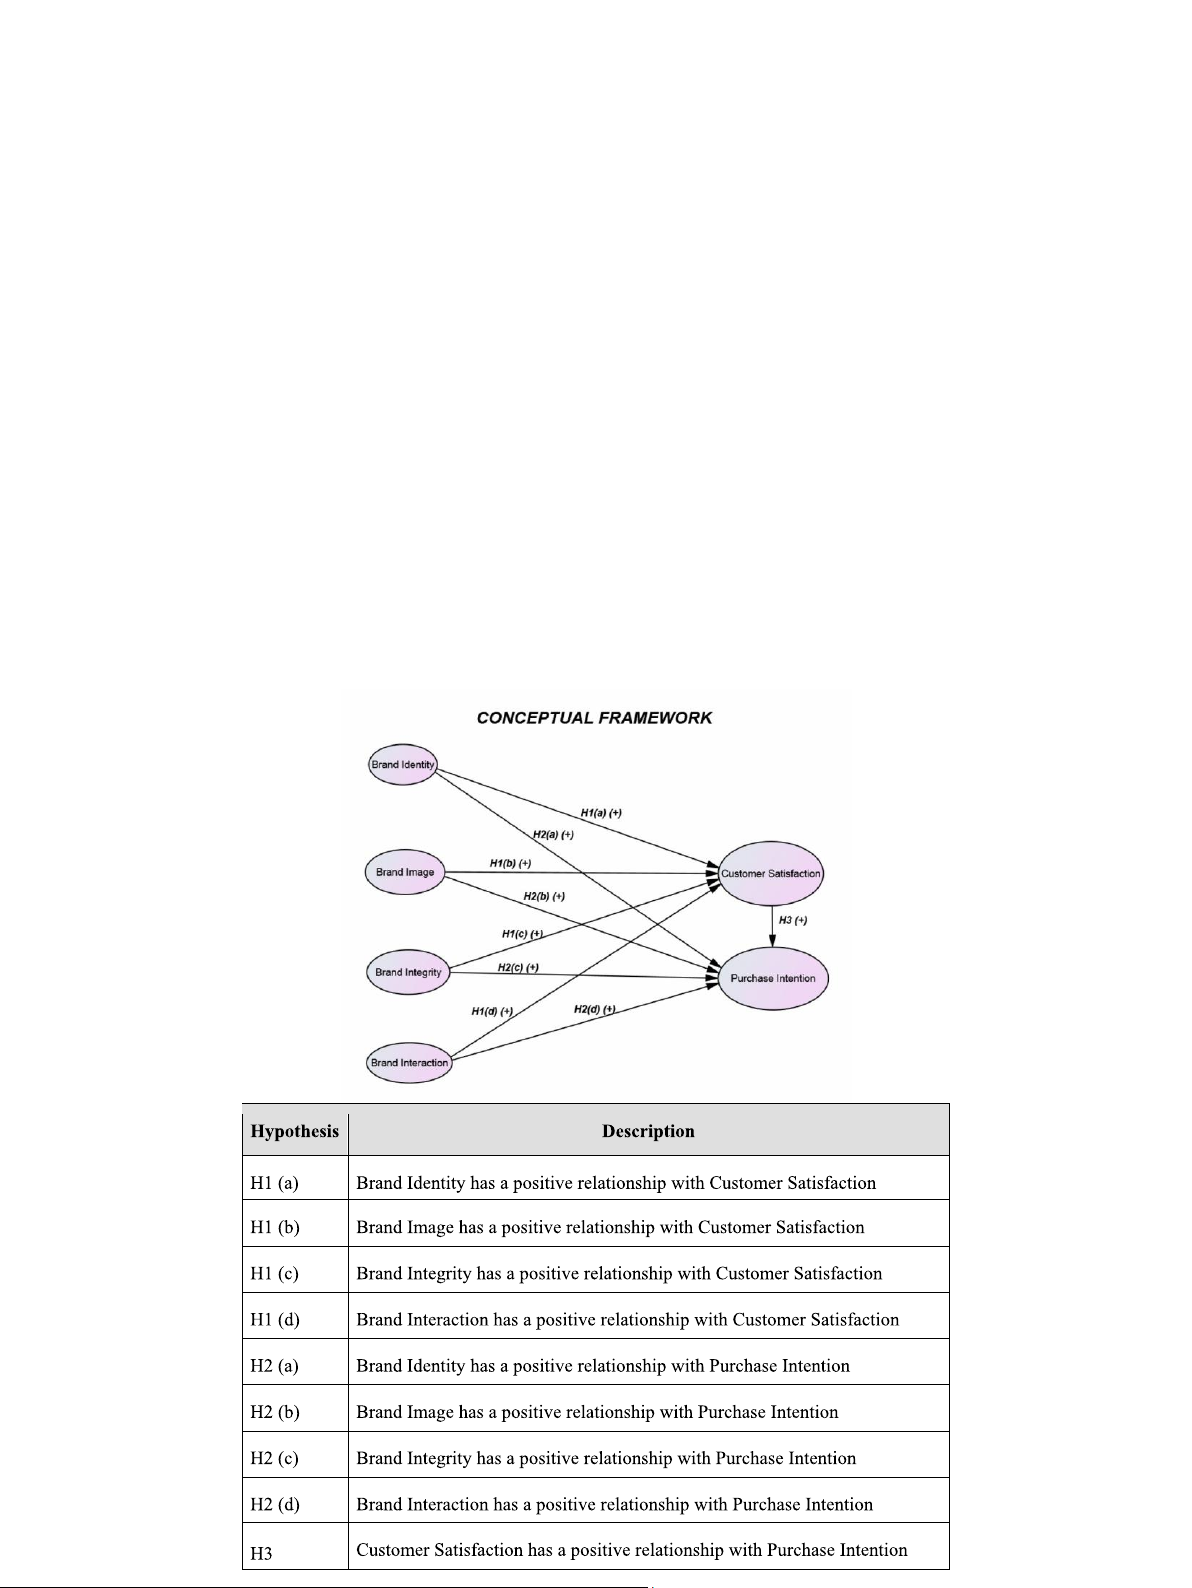
After the measurement model was validated, the authors explored the final
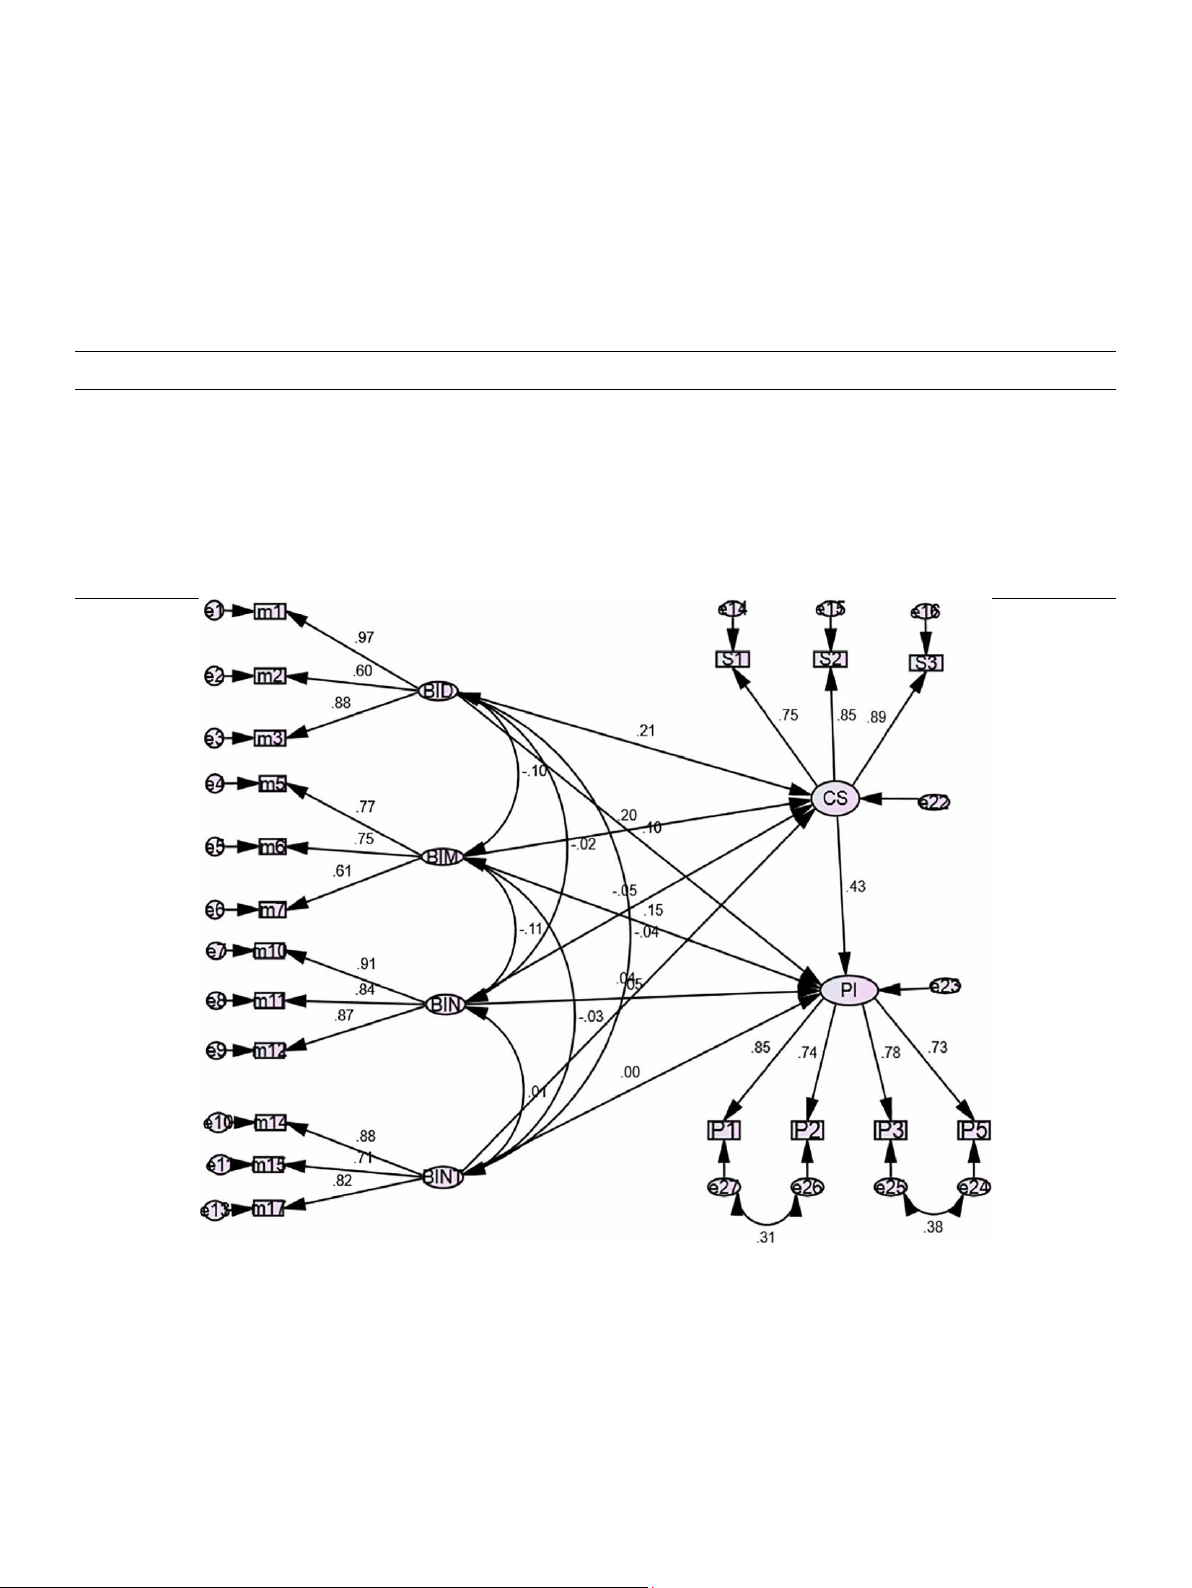
path analysis to test the conceptual framework. The authors validated the
customer satisfaction and purchase intention constructs and analyzed the
relationship structures by examining the relationships between the four
dimensions of Marketing 4.0 as well as their impact on customer satisfaction
and purchase intention. Furthermore, the authors examined the impact of
customer satisfaction on purchase intention (Fig. 4). In concert with the
previous EFA and CFA findings for all of the constructs, factors from the
variables under their respective domains
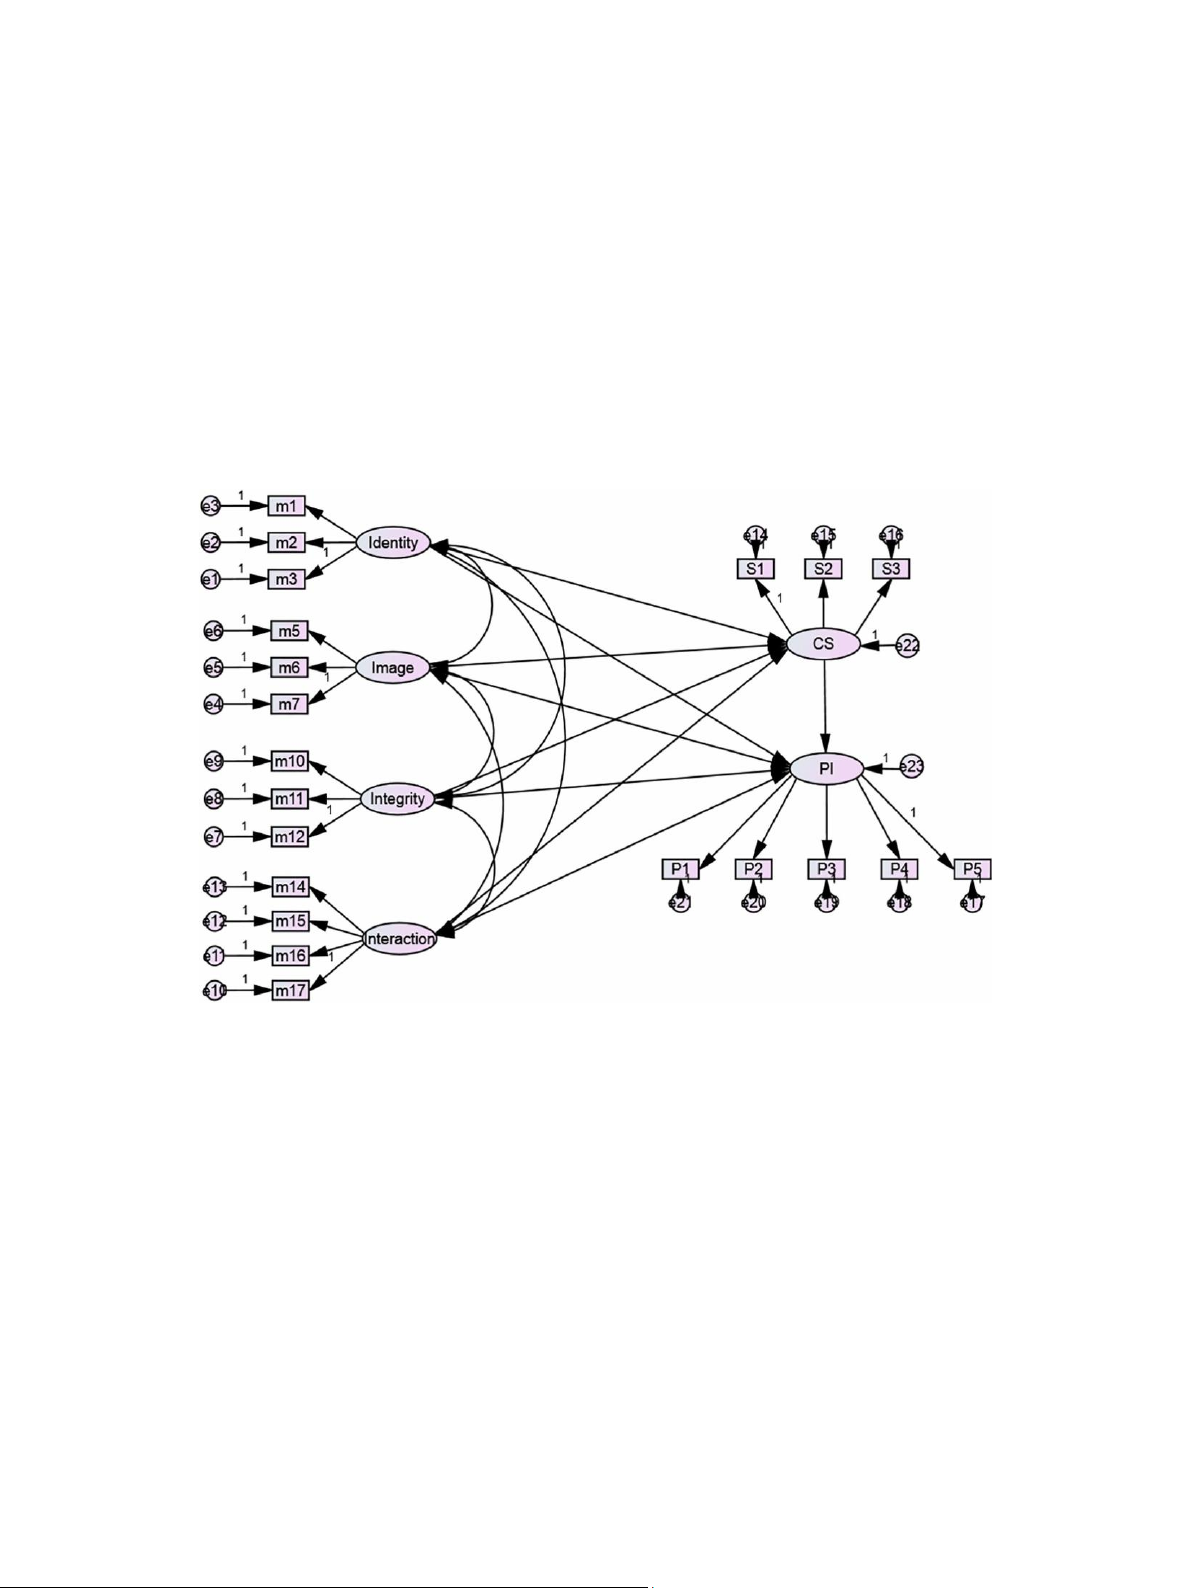
Fig. 3. Confirmatory Factor Analysis (pooled).
77% of the total variance. The reliability of the individual scales as well as the
factor loadings of the Marketing 4.0 (12), CS (3) and PI (4) items against the six
factors are shown in Table 2. For all of the six constructs in the conceptual
framework, factor loadings, as well as reliability measures, were well above
threshold values. In total, only two items were dropped out of the 21 original items.
CFA: To validate the EFA findings, CFA was conducted and found to be
satisfactory. All the Goodness-of-Fit measures (absolute, incremental and
parsimonious) meet threshold limits (see Fig. 3).
Absolute Fit Measures: Goodness-of-fit Index (GFI), Adjusted GFI (AGFI)
along with Root Mean Square Residual (RMSR) and Root Mean Square Error of
Approximation (RMSEA) were assessed for this measure. GFI was 0.941 and
AGFI was 0.918. Further, RMSR and RMSEA were 0.052. All of the assessed
measures are satisfactory and the overall model is a good fit (See Table 3).
Incremental Fit Measures: All of the four measures, Relative Fit Index (RFI)
at 0.923, Comparative Fit Index (CFI) at 0.963, Tucker-Lewis Index (TLI) at 0.954
and Normed Fit Index (NFI) at 0.939 were on the upper side of threshold limits (See Table 3).
Parsimonious Fit Measures: Two parsimony of fit indices were introduced
to overcome potential problems faced by the absolute and incremental lOMoAR cPSD| 59078336
G. Dash et al. Journal of Business Research 122 (2021) 608–620 Table 3
Amos goodness-of-fit measures for CFA. Absolute CMIN/DF 2.393 Fit Goodness-of-Fit Index (GFI) 0.941 Measures
Adjusted Goodness-of-Fit Index (AGFI) 0.918
Root Mean Square Residual (RMSR) 0.052
Root Mean Square Error of Approximation (RMSEA) 0.052 Incremental Relative Fit Index (RFI) 0.923 Fit Tucker-Lewis Index (TLI) 0.954 Measures Normed Fit Index (NFI) 0.939 Comparative Fit Index (CFI) 0.963 Parsimonious
Parsimonious Goodness of Fit Index (PGFI) Parsimonious 0.669 Fit Normed Fit Index (PNFI) 0.741 Measures
Parsimonious Comparative Fit Index (PCFI) 0.761
were calculated. Hence, the authors reduced the final measures considered for
purchase intention is surprising, especially considering the high level of analysis to six.
potential respondent interaction. Therefore, H2(a) suggests that brand identity
relates positively to purchase intention and this hypothesis is supported. 4. Results
Similarly, H2(b) suggests that brand image relates positively to purchase
intention and this hypothesis is also supported. However, the other two
In the first equation, customer satisfaction is the dependent variable and
hypotheses, H2(c) which states that brand integrity relates positively to
brand identity, brand image, brand integrity and brand interaction are the
purchase intention and H2(d) which states that brand interaction relates
independent variables. In the second equation, purchase intention is the
positively to purchase intention are not supported by this study’s data. Hence,
dependent variable and brand identity, brand image, brand integrity and brand
the impact of these four elements on both customer satisfaction and purchase intention are similar.
interaction are the independent variables. In the third, and final equation,
purchase intention is the dependent variable and customer satisfaction is the
In Stage III, this paper also measures the impact of customer satisfaction on
independent variable. In summary, a single path analysis was developed to
purchase intention and it is highly significant (β = 0.43). H3 suggests that
visualize the results of these analyses in a simple manner.
customer satisfaction relates positively to purchase intention. This hypothesis
Before exploring the results of the Structural Equation Model (SEM), the
is strongly supported suggesting that customer satisfaction relates strongly
authors analyzed the various Goodness-of-Fit measures to find the model
with, and appears to be important in boosting, customers’ purchase intentions.
fitness. GFI is 0.941, AGFI is 0.918. Further, RMSR is 0.052 and RMSEA is 0.052.
Furthermore, with regard to the analysis of purchase intentions, as
Further, the authors also found Comparative Fit Index (CFI) at 0.963, Tucker-
expected, P1, P2 and P3 & P5 have high-levels of covariance. The willingness
Lewis Index (TLI) at 0.954 and Normed Fit Index (NFI) at 0.939 and all of these
to buy (P1) and capability to buy (P2) received similar responses from the
important measures are above threshold levels prescribed in past prominent
millennials. This is because the willingness to buy is often closely related to a
research (MacCallum et al., 1996; Shevlin & Miles, 1998; Hu & Bentler, 1999;
consumer’s capability to buy (Shao et al., 2004; Blackwell et al., 2001). Similarly,
Mulaik et al., 1989). The findings are similar to the G-o-F measures found in
future intentions to buy (P3) and need to purchase (P5) also received similar
CFA as all of the six constructs are pooled together.
responses. This implies that future intentions are closely related to the needs
Path analysis was conducted in three stages (See Fig. 4 & Table 5).
of the customers (Shao et al., 2004; Blackwell et al., 2001).
Standardized estimates are used for testing the hypotheses. Stage I examines
the relationship between four dimensions of Marketing 4.0 and customer 5. Discussion
satisfaction. This study found that brand identity (β = 0.22) and brand image (β
Much of the world’s economy is becoming increasingly digital; however, the
= 0.20) have the strongest, and a significant, positive relationship with
north Indian real estate market has been slow to evolve and adopt new
customer satisfaction, whereas brand integrity and brand interaction are not
technology (Shankar, 2020). Albeit today, many more real estate firms in
significant. Incidentally, brand integrity has a negative moderate impact on
northern India have a digital presence than five years ago, many real estate
customer satisfaction while brand interaction has a positive moderate impact
firms still employ traditional marketing strategies and try to utilize momentary
on customer satisfaction. Consequently, H1(a) suggests that brand identity
incentives to drive consumer behavior (Shankar, 2020). As Vohra (2020:1)
relates positively to customer satisfaction and this hypothesis is strongly
explains, “One of the remarkable facts about the Indian real estate sector is
supported. Similarly, H1(b) suggests that brand image relates positively to
how fastidiously it clings to age-old ways of working…” and how “remarkably
customer satisfaction and this hypothesis is also supported. However, H1(c)
cold [the sector is] to the use of cutting-edge technology. However, traditional
suggesting that brand integrity relates positively to customer satisfaction and
techniques, such as incentives including free offers and low-price promises, are
H1(d) suggesting that brand interaction relates positively to customer
associated with increased competition and decreased profit margins. By
satisfaction are not supported.
exploring, in detail, the intricacies of the customer relationship, this research
Stage II examines the relationship between the four dimensions of
provides a portal into the effectiveness of marketing in the digital world and to
Marketing 4.0 and purchase intention. Again, brand identity (β = 0.10) and
the future real estate consumer. For instance, Gen- Z/Millennials in India are
more highly educated and technologically savvy than prior generations and,
brand image (β = 0.15) have the strongest, and a significant, relationship with
consequently, demand higher technology expectations of real estate firms.
purchase intention, while brand integrity and brand interaction are not
Also, interestingly, Indian Gen- Z/Millennial first-time homebuyers typically
significant. Brand integrity has a positive moderate impact on purchase
take more time to buy a house and generally consider their first home purchase
intention while brand interaction has practically no influence on purchase
to be a long-term investment. Understanding the nuances associated with this
intention. The lack of a significant relationship between brand interaction and lOMoAR cPSD| 59078336
G. Dash et al. Journal of Business Research 122 (2021) 608–620
growing consumer segment (growing in both wealth and proportion of
relationship (Aaker, 1997, Mindrut et al., 2015). When brand identity was
potential homebuyers) may be a key success factor for Indian real estate firms.
measured through an analysis of signage, sophistication and reputation,
This study aimed to assess the impact of the integration of the four
sophistication was found to be most crucial for millennials. This indicates that
dimensions of Marketing 4.0 on customer satisfaction and purchase intention.
millennials are aware of the industry and its offerings. Likewise, brand image
This study is particularly important since no previous study has empirically
also had a significant relationship with both customer satisfaction and
analyzed the integration of this model. Therefore, this study serves as the basis
purchase intention. This finding is consistent with the outcomes of the prior
for future scholarly inquiries in this domain.
studies (Keller, 2001; Cretu & Brodie, 2007) suggesting that enhanced brand Table 4
Evaluation of the measurement model (Fornell & Larcker). Mean SD Cronbach Alpha CR AVE MSV CS BID BIM BIN BINT PI CS 3.49 1.066 0.868 0.873 0.697 0.226 0.835 BID 3.38 1.170 0.851 0.866 0.691 0.038 0.195 0.831 BIM 3.64 1.058 0.715 0.753 0.507 0.048 0.182 − 0.097 0.712 BIN 3.66 1.069 0.906 0.907 0.765 0.012 − 0.073 − 0.018 − 0.110 0.875 BINT 3.64 0.984 0.842 0.848 0.652 0.002 0.022 − 0.042 − 0.028 0.011 0.807 PI 3.62 0.966 0.882 0.860 0.606 0.226 0.475 0.163 0.218 0.000 0.004 0.778
Fig. 4. Three Stage Path Analysis.
Furthermore, this study’s participants (Gen-Z/Millennials) and context (India’s
image is key to increased customer satisfaction as well as a rise in purchase
real estate industry) are unique and interesting for testing the hypotheses and
intention. It is also consistent with the view proposed by Neupane (2015) that
the study’s data yielded some counter-intuitive findings.
brand image must offer a better-perceived quality, enhanced customer
satisfaction, loyalty and commitment along with the product or service delivered.
5.1. Analyzing the study’s findings
Furthermore, when brand image was assessed by analyzing mystery, sensuality
and intimacy, it was mystery and sensuality that appeared to influence
Consistent with the predicted relationships, brand identity was found to be
consumers to make decisions. Consequently, brands might consider putting
the strongest factor influencing both customer satisfaction and purchase
more effort into enhancing their brand identity and brand image because doing
intention. This finding is consistent with prior studies that reported similar lOMoAR cPSD| 59078336
G. Dash et al. Journal of Business Research 122 (2021) 608–620
so may result in a significant increase in customer satisfaction and purchase
have been diminished. As Gen-Z/Millennial buyers increase as a buyer intention.
segment, more nuanced approaches to real estate marketing may yield greater
Interestingly, the findings for the other two elements of Marketing
outcomes. For instance, interestingly, this study discovered a peculiar trend as
Gen-Z/Millennial buyers appear to be very active buyers as young, first-time
homebuyers flood the real estate market. This research also suggests that the Table 5
sharp correction in prices and long-term investment plans are attractive to this
Standardized regression weights. buyer segment. Hypothesis
Hypothesized Relationship Estimate P
Our study initiated the examination of some of the nuances inherent in the
subdimensions of branding. This subdimension-level analysis is novel and adds H1 (a) H1 Brand Identity Brand → CS 0.215 ***
a significant level of detail not examined in prior branding literature. However, (b) Image → CS 0.198 ***
our study is not perfect. In the next section we explore some study limitations. H1 (c) Brand Integrity → CS − 0.048 0.321
Furthermore, although the Indian real estate context allowed us a rare H1 (d)
Brand Interaction Brand → CS PI 0.037 0.447
opportunity to apply the Marketing 4.0 model to an emerging economy and H2 (a) Identity → PI 0.095 *** H2 (b) Brand Image → 0.154 ***
industry with heavy involvement by millennial buyers, our understanding is far H2 (c) Brand Integrity → PI 0.050 0.279
from complete. Therefore, the next section also discusses several future H2 (d) H3 Brand Interaction CS → PI PI 0.002 0.959
research opportunities for expanding on our work. 5.2. Limitations and → 0.432 ***
directions for future research *** = 0.01 or less.
Great care was taken in formulating the research design for this study, but
4.0—brand integrity and brand interaction—are not in line with the previous
no research effort is perfect. For example, methodologically, we were limited
literature. Although the three items for brand integrity did not yield statistically
to geographical cluster sampling versus being able to conduct a larger-scale
significant results, among the three measures, trust was the most salient. This
study examining all of India. The sheer size of India, geographically and
is not surprising considering the huge amount of investment and risk
population-wise, rendered a complete national study impractical. However, we
associated with a real estate transaction. Furthermore, brand integrity does
did collect a large number of survey responses for our target demographic and
not significantly predict customer satisfaction and purchase intention. In fact,
were able to generate an excellent response rate. Therefore, this study
the findings reflect that brand integrity has an unexpected negative impact,
provides valuable insights into Marketing 4.0 and its application in the highly-
although not significant, on customer satisfaction. Although prior literature
populated north Indian national capital region. Next, our survey required
(Erdem & Swait, 2004; Campelo et al., 2011) has proposed a high and positive
significant amounts of self-reported data. We used some reverse coded items
relationship between brand integrity and customer satisfaction and purchase
to validate completeness and consistency and, although we have no reason to
intention, the findings of this study counter prior studies. Similarly, prior
suspect that respondents were not truthful in their assessments, it is possible
studies indicate that brand interaction in the digital age is significant and an
that their assessments sometimes were inaccurate. Furthermore, our study
important dimension for marketers to reach customers in an effort to raise
presents nine hypotheses, but only found support for five of those hypotheses
their satisfaction and their intentions to buy (Gensler et al., 2013; Li, 2010;
and some of those findings are counter- intuitive. It is not clear to us why some
Schivinski et al., 2016). However, in contrast with those studies, this study
of our hypotheses failed to supply the expected results, but future studies, as
identified a negligible impact of brand interaction on customer satisfaction and
we discuss below, may be able to discover ways to resolve these unintended purchase intention. outcomes.
Several issues may be contributing to the unexpected findings. First, the
This study presents one of the first empirical analyses of Marketing 4.0 and
respondents are young consumers (Millennials), unique in their buying habits,
opens the door to many future research opportunities. Opportunities include
beliefs, opinions and marketing experiences (Millennials, 2019). Second, the
further analyzing the nuances and counter-intuitive findings presented here,
study is based in an emerging market, while prior studies are typically
the need to explore new, different, and evolving contexts, including new
conducted in established markets and different country contexts. It is possible
geographies and industries, and the necessity to continue to examine the
that the study’s context and sample is so unique that it might present unique
incongruent use of technology by buyers and sellers. For example, as noted
variability in the findings. Third, it is possible that the lack of impact of brand
above, this study finds that brand identity and brand image are strong
integrity on customer satisfaction and purchase intention is less about age and
predictors of customer satisfaction and purchase intention in the Indian real
experience of the buyers and the establishment of the markets and more about
estate market, but that, counter-intuitively, brand integrity and brand
local cultural complexities of the area where the data was collected (northern
interaction are not significant predictors. Typically, scholars expect these four
India). In case any of these assertions are correct, this paper calls for more
elements to move in the same direction and to be consistently significant
demographically and geographically diversified studies to identify the best
(Moon et al., (2008); Shao et al., 2004; Blackwell et al., 2001). That was not the
marketing mix for different demographics and geographic locations, as well as
case in this study. Perhaps future studies could explore nuances associated
emerging market considerations.
with these counter intuitive findings. For instance, this study includes all four
elements of Marketing 4.0 and their subdimensions (which load heavily on the
Alternatively, another potential reason why the findings opposed prior
four elements); however, maybe there is more to learn about the
studies may be the nature of the northern India real estate industry and its
subdimensions and their direct relationships with customer satisfaction and
level of maturity. Extant literature focusing on brand interaction indicates that
purchase intention. Future studies could attempt to parse out the individual
firms must enhance their digital presence because target audiences are more
subdimensions of these four constructs to see the underlying direct
engaged, comfortable and informed through the use of digital platforms (Tiago &
relationships between the subdimensions and the dependent variables—
Veríssimo, 2014). For promotions as well as outreach and other contact
customer satisfaction and purchase intention. Even for the constructs that
programs, the use of social media is developing into a necessity for nearly all
were found to be significant—brand identity and brand image—benefits may
marketing teams in all industries (Rapp et al., 2013). This research indicates
be gleamed from deeper exploration of their subdimensions. There are
that Millennials and Gen-Z customers are highly active on social media, at an
opportunities to conduct studies using constructs and scales such as Masstige
accelerating rate, and that they use and trust peer group reviews to inform
mean score scale (Paul, 2015; Paul, 2018, 2019; Kumar & Paul, 2018; Kumar,
their level of satisfaction and buying decisions (Millennials, 2019). If the
Paul & Unnithan, 2020) as proxy for brand image.
maturity of the northern India real estate industry is not up-to-speed with
customer’s desires regarding brand interaction (i.e., real estate firms are not
Additionally, future studies could explore the significance of the sample
keeping pace with the technology available or other tools to enhance brand
demographics and industry with regard to the influence of Marketing 4.0. This
interaction), the impact on customer satisfaction and purchase intentions may
study’s sample comes from a specific industry (real estate) and an emerging lOMoAR cPSD| 59078336
G. Dash et al. Journal of Business Research 122 (2021) 608–620
market (India) and these factors may have contextual and cultural aspects
Atilgan, E., Aksoy, S., & Akinci, S. (2005). Determinants of the brand equity: A verification
unique from previous studies. Consequently, although this study’s sample,
approach in the beverage industry in Turkey. Marketing Intelligence & Planning, 23(3),
237–248. https://doi.org/10.1108/02634500510597283.
industry, and location offer academia unique insights into the broader
Ball, D., Simoes Coelho, P., & Mac˜ has, A. (2004). The role of communication and trust in´
application of Marketing 4.0, using a novel sample (Millennials) in a growing
explaining customer loyalty: An extension to the ECSI model. European Journal of
industry in an emerging economy might have also presented some unexpected
Marketing, 38(9/10), 1272–1293.
outcomes. These unanticipated findings call for more exploration and
Bataineh, A. Q. (2015). The impact of perceived e-WOM on purchase intention: The mediating
variability in the samples, industries, economies and locations of future studies
role of corporate image. International Journal of Marketing Studies, 7(1).
https://doi.org/10.5539/ijms.v7n1p126.
of Marketing 4.0. There are opportunities to carry out future studies in the
Berens, G., van Riel, C. B. M., & van Bruggen, G. H. (2005). Corporate associations and consumer
context of other countries using the tenets and constructs from our study.
product responses: The moderating role of corporate brand dominance.
Finally, this study shows almost zero influence by brand interaction
Journal of Marketing, 69(3), 35–48. https://doi.org/10.1509/jmkg.69.3.35.66357.
on customer satisfaction and purchase intention. This provides a significant gap
Berger, J., & Heath, C. (2007). Where consumers diverge from others: Identity signaling and
product domains. Journal of Consumer Research, 34(2), 121–134. https://doi.
for future research in emerging economies since it appears that the northern org/10.1086/519142.
Indian real estate companies are not adequately adapting to the latest
Beverland, M. (2011). Brand authenticity. In M. Uncles (Ed.), Perspectives on brand management
challenges posed by digital and social media platforms. As Kotler et al. (2016)
(pp. 266–290). Prahran, Australia: Tilde University Press.
explains, there is large incongruence between the buyers and sellers on
Biel, A. L. (1992). How brand image drives brand equity. Journal of Advertising Research, 32(6),
technology usage parameters and this incongruence is consistent across all
6–12. https://doi.org/10.1097/PAT.0b013e328348a6e7.
Blackwell, R. D., Miniard, P. W., & Engel, J. F. (2001). Consumer Behavior. Mike Roche: Ohio.
emerging economies. Future research should focus on the digital interaction of
Boulding, W., Kalra, A., Stalein, R., & Zeithaml, V. A. (1993). A dynamic process model of service
the brands with customers in various industry and geographic contexts, based
quality: From expectations to behavioral intentions. Journal of Marketing Research, 30(1),
on the tenets outlined in prior studies (Paul & Rosenbaum, 2020; Arya et al.
7–27. https://doi.org/10.2307/3172510. (2019). 6. Conclusion
Bruwer, J., & Buller, C. (2012). Country-of-origin (COO) brand preferences and associated
knowledge levels of Japanese wine consumers. Journal of Product & Brand Management,
21(5), 307–316. https://doi.org/10.1108/10610421211253605.
This study’s evaluation of Marketing 4.0, one of the first of its kind, extends
Butler, J. K. (1991). Toward understanding and measuring conditions of trust: Evolution of a
prior research and assesses the relationships within the Marketing 4.0 model.
conditions of trust inventory. Journal of Management, 17(3), 643–663. https://
This paper also examined the relationships between Marketing 4.0, customer
doi.org/10.1177/014920639101700307.
satisfaction and purchase intention. Review of previous literature provided the
Campelo, A., Aitken, R., & Gnoth, J. (2011). Visual rhetoric and ethics in marketing of
destinations. Journal of Travel Research, 50(1), 3–14. https://doi.org/10.1177/
foundation for the development of hypotheses and the design of a new 0047287510362777.
theoretical framework including all six constructs. Although, the inclusion of
Carroll, B.A. and Ahuvia, A.C. (2006, April), Some antecedents and outcomes of brand love.
brand interaction into the newest version of Kotler’s (2016) marketing model
Marketing Letters. https://doi.org/10.1007/s11002-006-4219-2.
seems clear and simple, our findings suggest that there are important
Caruana, A. (2002). Service loyalty: The effects of service quality and the mediating role of
customer satisfaction. European Journal of Marketing, 36(7/8), 811–828. https://
contextual elements that may impact the four constructs’ influence on
doi.org/10.1108/03090560210430818.
customer satisfaction and purchase intentions. This study found that brand
Chang, C. H., & Tu, C. Y. (2005). Exploring store image, customer satisfaction and customer loyalty
identity and brand image have a positive and significant effect on both
relationship: Evidence from Taiwanese hypermarket industry.
customer satisfaction and purchase intention. However, counter to previous
Journal of American Academy of Business, 7, 197–202.
findings, brand integrity and brand interaction were not significant predictors
Chitty, B., Ward, S., & Chua, C. (2007). An application of the ECSI model as a predictor of
satisfaction and loyalty for backpacker hostels. Marketing Intelligence & Planning, 25, 563–
of customer satisfaction and purchase intention. In line with the findings of
580. https://doi.org/10.1108/02634500710819941.
prior studies, this study found that customer satisfaction does have a significant
Cho, E. (2011), Development of a brand image scale and the impact of love marks on brand
positive impact on purchase intention. Although this work strongly supports
equity. Graduate Thesis and Dissertations. Iowa State University, (2011)
many previously observed theoretical relationships for marketing elements, it 1–198.
also challenges some strongly held relational assumptions. Practically,
Chun, R., & Davies, G. (2006). The influence of corporate character on customers and
employees: Exploring similarities and differences. Journal of the Academy of Marketing
marketing professionals, especially in burgeoning economies and growing
Science, 34(2), 138–146. https://doi.org/10.1177/0092070305284975.
industries, appear best served by focusing on brand identity and brand image.
Cornwell, T. B., & Coote, L. V. (2005). Corporate sponsorship of a cause: The role of identification
Ultimately, this study fills a theoretical gap with regard to branding and the
in purchase intent. Journal of Business Research, 58(3 SPEC. ISS.), 268–276.
evolution from Marketing 3.0 to Marketing 4.0. Furthermore, this paper adds
https://doi.org/10.1016/S0148-2963(03)00135-8.
Cretu, A. E., & Brodie, R. J. (2007). The influence of brand image and company reputation where
to scholars’ and practitioners’ understanding regarding the most appropriate
manufacturers market to small firms: A customer value perspective. Industrial Marketing
mix for marketing efforts in a digital world. However, this paper also calls for
Management, 36(2), 230–240. https://doi.org/ 10.1016/j.indmarman.2005.08.013.
additional planning and diligence in testing Marketing 4.0, especially in
Da Silva, R. V., & Syed Alwi, S. F. (2008). Online corporate brand image, satisfaction and loyalty.
emerging markets and in various geographic contexts and environments. Journal of Brand Management, 16(3), 119–144. https://doi.org/10.1057/ palgrave.bm.2550137.
Das, G. (2012). From brands in general to retail brands: A review and future agenda for brand References personality measurement. The Marketing Review, 12(1). https://doi.org/
10.1362/146934712x13286274424389.
Aaker, D. (1996), Building strong brands. The Free Press. New York. https://doi.org/
Davies, G., Chun, R., Da Silva, R., & Roper, S. (2003). Corporate Reputation and Competitiveness. 10.1057/bm.1996.8. London: Routledge.
Aaker, J.L. (1997), Dimensions of Brand Personality. Journal of Marketing Research; 34, 3;
DeShields, J., Oscar, W., Kara, A., & Kaynak, E. (2005). Determinants of business student
ABI/INFORM Global pg. 347 https://doi.org/10.2139/ssrn.945432.
satisfaction and retention in higher education: Applying Herzberg’s two-factor theory.
Aghekyan, M., Forsythe, S., Kwon, W. S., & Chattaraman, V. (2012). The role of product brand
International Journal of Educational Management, 19(2), 128–139. https://doi.
image and online store image on perceived risks and online purchase intentions for apparel.
org/10.1108/09513540510582426.
Journal of Retailing and Consumer Services, 19(3), 325–331.
Dholakia, N., Zwick, D., and Denegri-Knott, J. (2010). Technology, consumers, and marketing
Ahearne, M., Bhattacharya, C. B., & Gruen, T. (2005). Antecedents and consequences of
theory. Handbook of Marketing Theory, 1, Sage, 494–511.
customer-company identification: Expanding the role of relationship marketing. Journal of
Dobni, D., & Zinkhan, G. M. (1990). In search of brand image: A foundation analysis. ACR North
Applied Psychology, 90(3), 574–585. https://doi.org/10.1037/0021- 9010.90.3.574. American Advances.
Akin, M. (2011). Predicting consumers’ behavioral intentions with perceptions of brand
Dodds, W. B., Monroe, K. B., & Grewal, D. (1991). Effects of price, brand, and store information
personality: A study in cell phone markets. International Journal of Business and
on Buyers’ product evaluations. Journal of Marketing Research, 28(3), 307.
Management, 6(6). https://doi.org/10.5539/ijbm.v6n6p193.
https://doi.org/10.2307/3172866.
Arya, V., Sethi, D., & Paul, J. (2019). Does digital footprint act as a digital asset?– Enhancing
Doorn, van, J., Lemon, K. N., Mittal, V., Nass, S., Pick, D., Pirner, P., & Verhoef, P. C. (2010).
brand experience through remarketing. International Journal of Information Management,
Customer engagement behavior: Theoretical foundations and research directions. Journal 49, 142–156.
of Service Research, 13(3), 253–266. https://doi.org/10.1177/ 1094670510375599. lOMoAR cPSD| 59078336
G. Dash et al. Journal of Business Research 122 (2021) 608–620
Erdem, T., & Swait, J. (1998). Brand equity as a signaling phenomenon. Journal of Consumer
Kumar, A., Paul, J., & Unnithan, A. B. (2020). ‘Masstige’ marketing: A review, synthesis and
Psychology, 7(2), 131–157. https://doi.org/10.1207/s15327663jcp0702_ 02.
research agenda. Journal of Business Research., 113(384–398). https://doi.org/
Erdem, T., & Swait, J. (2004). Brand credibility, brand consideration, and choice. Journal of
10.1016/j.jbusres.2019.09.030.
Consumer Research, 31(1), 191–198. https://doi.org/10.1086/383434.
Kuo, Y. F., Wu, C. M., & Deng, W. J. (2009). The relationships among service quality, perceived
Erevelles, S., & Leavitt, C. (1992). A comparison of current models of consumer
value, customer satisfaction, and post-purchase intention in mobile value- added services.
satisfaction/dissatisfaction. Journal of Consumer Satisfaction, Dissatisfaction and
Computers in Human Behavior, 25(4), 887–896. https://doi.org/ 10.1016/j.chb.2009.03.003.
Complaining Behavior, 5, 104–114.
Labrecque, L. I., vor dem Esche, J., Mathwick, C., Novak, T. P., & Hofacker, C. F. (2013). Consumer
Fennis, B. M., & Pruyn, A. T. H. (2007). You are what you wear: Brand personality influences on
power: Evolution in the digital age. Journal of Interactive Marketing, 27(4), 257–269.
consumer impression formation. Journal of Business Research, 60(6), 634–639.
Lau, G. T., & Lee, S. H. (1999). Consumers’ trust in a brand and the link to brand loyalty.
https://doi.org/10.1016/j.jbusres.2006.06.013.
Retrieved from Journal of Market-Focused Management, 4(4), 341–370 http://www.
Fornell, C., & Larcker, D. F. (2006). Evaluating structural equation models with unobservable
springerlink.com/index/L480730T35182442.pdf.
variables and measurement error. Journal of Marketing Research, 18(1), 39.
Li, C. (2010). Groundswell. Winning in a World Transformed by Social Technologies.
https://doi.org/10.2307/3151312.
Strategic Direction, 26(8), 27–32. https://doi.org/10.1108/sd.2010.05626hae.002.
Fuller, J. B., Hester, K., Barnett, T., Frey, L., Relyea, C., & Beu, D. (2006). Perceived external
Lok Sabha takes up real estate bill, Congress assures support, (2016). The Economic
prestige and internal respect: New insights into the organizational identification process.
Times, 15 March 2016. https://economictimes.indiatimes.com/news/politics-and-
Human Relations, 59(6), 815–846. https://doi.org/10.1177/ 0018726706067148.
nation/lok-sabha-takes-up-real-estate-bill-congress-assures-support/articleshow/
Gensler, S., Volckner, F., Liu-Thompkins, Y., & Wiertz, C. (2013). Managing brands in the ¨ social 51408464.cms.
media environment. Journal of Interactive Marketing, 27(4), 242–256. https://
Lu, J., Kadane, J. B., & Boatwright, P. B. (2008). The dirt on bikes: An illustration of CART models
doi.org/10.1016/j.intmar.2013.09.004.
for brand differentiation. Journal of Product and Brand Management, 17 (5), 317–326.
Giese, J., & Cote, J. (2000). Defining consumer satisfaction. Academy of Marketing Science
https://doi.org/10.1108/10610420810896077.
Review, 1, 1–24. https://doi.org/10.1111/j.1365-2850.2008.01371.x.
MacCallum, R. C., Browne, M. W., & Sugawara, H. M. (1996). Power analysis and determination
Gilal, F. G., Zhang, J., Paul, J., & Gilal, N. G. (2019). The role of self-determination theory in
of sample size for covariance structure modeling. Psychological Methods, 1(2), 130–149.
marketing science: An integrative review and agenda for research.
https://doi.org/10.1037/1082-989X.1.2.130.
European Management Journal, 37(1), 29–44.
Martensen, A., Gronholdt, L., & Kristensen, K. (2000). The drivers of customer satisfaction and
Goi, M. T., Goi, C. L., & Wong, D. (2014). Constructing a brand identity scale for higher education
loyalty: Cross-industry findings from Denmark. Total Quality Management, 11(4–6), 544– institutions. Journal of Marketing for Higher Education, 24(1), 59–74.
553. https://doi.org/10.1080/09544120050007878.
https://doi.org/10.1080/08841241.2014.906017.
McKnight, D. H., Choudhury, V., & Kacmar, C. (2002). Developing and validating trust measures
Gonzalez, M. E. A., Comesa´ na, L. R., & Brea, J. A. F. (2007). Assessing tourist behavioral ˜
for e-commerce: An integrative typology. Information Systems Research, 13 (3), 334–359.
intentions through perceived service quality and customer satisfaction. Journal of
https://doi.org/10.1287/isre.13.3.334.81.
Business Research, 60(2), 153–160. https://doi.org/10.1016/j.jbusres.2006.10.014. Grewal,
McQuitty, S., Finn, A., & Wiley, J. B. (2000). (2000), Systematically varying consumer satisfaction
D., & Levy, M. (2010). Marketing (Second Edition). New York: McGraw-Hill.
and its implications for product choice. Academy of Marketing Science
Hernandez, A., Küster, I., Vila, N., & Trinidad, J. (2012).´ Influencia del intercambio de Review, 10, 1–16.
experiencias eC2C en las actitud hacia la marca en las redes sociales. Vila Real: XXII
Mengzia, Z. (2007). Impact of Brand Personality on PALI: A Comparative Research between Two
Jornadas Luso Espanolas de Gest˜ ion Científic´ a.
Different Brands. International Management Review, 3(3), 36.
Hu, L. T., & Bentler, P. M. (1999). Cutoff criteria for fit indexes in covariance structure analysis:
Millennials and Indian real estate-How is this journey shaping up? (2019). Square Yards, 6
Conventional criteria versus new alternatives. Structural Equation Modeling, 6(1), 1–55.
December 2019. https://www.squareyards.com/blog/millennials-and-indian-real- estate-
https://doi.org/10.1080/10705519909540118.
how-is-this-journey-shaping-up.
Huh, J., Denise, E., & Reid, L. N. (2009). Direct-to-consumer advertising skepticism and the use
Mindrut, S., Manolica, A., & Roman, C. T. (2015). Building Brands Identity. Procedia Economics
and perceived usefulness of prescription drug information sources. Health Marketing
and Finance, 20, 393–403. https://doi.org/10.1016/S2212-5671 (15) 00088-X.
Quarterly, 26(4), 293–314.
Monroe, K. B. (2011). Some personal reflections on pricing research. Review of Marketing
Jamal, A., & Goode, M. M. (2001). Consumers and Brands: A Study of the Impact of Self- Image
Research, 8, 209–241. https://doi.org/10.1108/S1548-6435(2011)0000008010.
Congruence on Brand Preference and Satisfaction. Marketing Intelligence & Planning, 19,
Moon, J., Chadee, D., & Tikoo, S. (2008). Culture, product type, and price influences on consumer
482–492. https://doi.org/10.1108/02634500110408286.
purchase intention to buy personalized products online. Journal of Business Research, 61(1),
Jara, A. J., Parra, M. C., & Skarmeta, A. F. (2012). In Marketing 4.0: A new value added to the
31–39. https://doi.org/10.1016/j.jbusres.2006.05.012.
Marketing through the Internet of Things (pp. 852–857). IEEE.
Morrison, S., & Crane, F. G. (2007). Building the service brand by creating and managing an
Jara, A. J., Olivieri, A. C., Bocchi, Y., Jung, M., Kastner, W., & Skarmeta, A. F. (2014). Semantic Web
emotional brand experience. Journal of Brand Management, 14, 410–421. https://
of Things: An analysis of the application semantics for the IoT moving towards the IoT
doi.org/10.1057/palgrave.bm.2550080.
convergence. International Journal of Web and Grid Services, 10(2/3), 244.
Mouri, N. (2005), A Consumer-based Assessment of Alliance Performance: An Examination of
https://doi.org/10.1504/IJWGS.2014.060260.
Consumer Value, Satisfaction and Post-purchase behavior; University of Central Florida,
Joshi, R., & Garg, P. (2020). Role of brand experience in shaping brand love. International Journal 2005, 156 pages; AAT 3193496.
of Consumer Studies. https://doi.org/10.1111/ijcs.12618.
Mulaik, S. A., James, L. R., Van Alstine, J., Bennett, N., Lind, S., & Stilwell, C. D. (1989). Evaluation
Kane, G. C., Palmer, D., Phillips, A. N., Kiron, D., & Buckley, N. (2015). Strategy, not technology,
of goodness-of-fit indices for structural equation models. Psychological Bulletin, 105(3),
drives digital transformation. MIT Sloan Management Review and Deloitte University Press,
430–445. https://doi.org/10.1037/0033-2909.105.3.430. 14(1–25).
Napoli, J., Dickinson, S. J., Beverland, M. B., & Farrelly, F. (2014). Measuring consumer- based
Keller, K. L. (1993). Conceptualizing, Measuring, and Managing Customer-Based Brand Equity.
brand authenticity. Journal of Business Research, 67(6), 1090–1098. https://
Journal of Marketing, 57, 1–22. https://doi.org/10.2307/1252054.
doi.org/10.1016/j.jbusres.2013.06.001.
Keller, K. L. (2001). Building Customer-Based Brand Equity. (cover story). Marketing
Neupane, R. (2015). The effects of brand image on customer satisfaction and loyalty intention in
Management.. https://doi.org/10.1108/00251740510589733.
retail Super Market Chain UK. International Journal of Social Sciences and Management,
Kohler, T., Fueller, J., Stieger, D., & Matzler, K. (2011). Avatar-based innovation: Consequences of
2(1). https://doi.org/10.3126/ijssm.v2il.11814.
the virtual co-creation experience. Computers in human behavior, 27
Oliver, R. L. (1997). Satisfaction-A behavioral perspective on consumer: Review, criticism and (1), 160–168.
contribution. International Journal of Research Studies in Management, 3 (1), 75–82.
Kimery, K. M., & McCord, M. (2002). Third-party assurances: The road to trust in online retailing
https://doi.org/10.5861/ijrsm.2013.406.
(Vol. 2002-January). https://doi.org/10.1109/HICSS.2002.994158.
Parent, M., Plangger, K., & Bal, A. (2011). The new WTP: Willingness to participate.
Kirmani, A. and Zeithaml, V. (1993), “Advertising, Perceived Quality and Brand Image”. In: Brand
Business Horizons, 54(3), 219–229. https://doi.org/10.1016/j.bushor.2011.01.003.
equity and advertising: Advertising’s role in building strong brands (Eds) Aaker, David and
Paul, J. (2019). Masstige model and measure for brand management. European Management
Biel, Alexander, Hillsdale, NJ., Lawrence Erlbaum Associates.
Journal, 37(3), 299–312.
Koo, D. M. (2003). Interrelationships among Store Images, Store Satisfaction, and Store Loyalty
Paul, J. (2018). Toward a ’masstige’ theory and strategy for marketing. European Journal of
among Korea Discount Retail Patrons. Asia Pacific Journal of Marketing and Logistics, 15,
International Management, 12(5–6), 722–745.
42–71. https://doi.org/10.1108/13555850310765033.
Paul, J. (2015). Masstige marketing redefined and mapped. Marketing Intelligence & Planning.,
Kotler, P., Kartajaya, H., and Setiawan, I. (2011), Marketing 3.0: From Products to Customers to
33(5), 691–706. https://doi.org/10.1108/MIP-02-2014-0028.
the Human Spirit. NJ: John Wiley & Sons, Inc. https://doi.org/ 10.1002/9781118257883.
Paul, J., & Mas, E. (2019). Toward a 7-P framework for international marketing. Journal of
Kotler, P., Kartajaya, H., and Setiawan, I. (2016), Marketing 4.0: Moving from Traditional to Digital.
Strategic Marketing, 1–21. https://doi.org/10.1080/0965254X.2019.1569111.
NJ: John Wiley & Sons, Inc. https://doi.org/10.1111/j.1399- 5618.2004.00111.x.
Paul, J., & Rosenbaum, M. (2020). Retailing and consumer services at a tipping point:
Kristensen, K., Martensen, A., & Gronholdt, L. (1999). Measuring the impact of buying behaviour
New conceptual frameworks and theoretical models. Journal of Retailing and Consumer
on customer satisfaction. Total Quality Management, 10, S602–S614.
Services, 101977. https://doi.org/10.1016/j.jretconser.2019.101977.
Kumar, A., & Paul, J. (2018). Mass prestige value and competition between American versus Asian
Rajagopal, D. (2008). Interdependence of Personality Traits and Brand Identity in Measuring
laptop brands in an emerging market—Theory and evidence.
Brand Performance. SSRN. https://doi.org/10.2139/ssrn.1309864.
International Business Review, 27(5), 969–981. lOMoAR cPSD| 59078336
G. Dash et al. Journal of Business Research 122 (2021) 608–620
Rapp, A., Beitelspacher, L. S., Grewal, D., & Hughes, D. E. (2013). Understanding social media
Zarantonello, L., & Schmitt, B. H. (2010). Using the brand experience scale to profile consumers
effects across seller, retailer, and consumer interactions. Journal of the Academy of
and predict consumer behavior. Journal of Brand Management, 17, 532–540.
Marketing Science, 41(5), 547–566.
https://doi.org/10.1057/bm.2010.4.
Reichheld, F. and Teal, T. (1996), The Loyalty Effect, Harvard Business School Press. Boston, MA.
Zhang, C., & Mo, W. (2008). Sell a management the convenience post. Taipei City: the Ding Mouw.
Retrieved from https://scholar.google.co.uk/scholar?q=The+loyalty+
Zhang, Y. (2015). The Impact of Brand Image on Consumer Behavior: A Literature Review.
effect+1996&btnG=&hl=zh-CN&as_sdt=0%2C5#3.
Business and Management, 3(January), 58–62. https://doi.org/10.4236/ ojbm.2015.31006.
Riezebos, R., & Riezebos, H. J. (2003). Brand management: A theoretical and practical approach. Pearson Education.
Dr Ganesh Dash, Saudi Arabia. Ganesh started his career with Jaipur National University, Jaipur
Roberts, K. (2004). Lovemarks: The future beyond brands (1st ed.). New York: Powerhouse Books.
and currently is a Faculty member with Saudi Electronic University, Riyadh, K. S.A. He teaches
Rory, P. M. (2000). A Consumer-Orientated framework of brand equity and loyalty.
both services marketing & marketing papers with advanced research methodology and
International Journal of Marketing Research, 42(1), 65–78.
marketing research & analytics). With more than fifteen years of experience under his belt, he is
Rust, R. T., & Oliver, R. L. (1994). Service quality: Insights and managerial implications from the
available for teaching, research, and consultancy services across the globe. He has presented
frontier. Service Quality: New Directions in Theory and Practice, 1–19. https://
numerous research papers in national and international seminars and conferences. He has
doi.org/10.4135/9781452229102.n1.
published more than thirty papers in journals of repute. He currently specializes in marketing
Ruvio, A. (2008). Unique like everybody else? The dual role of consumers’ needs for uniqueness.
analytics for the development of rural marketing skills and mechanisms.
Psychology and Marketing, 25(5), 444–464. https://doi.org/10.1002/ mar.20219.
S¸ahin, A., Zehir, C., & Kitapçi, H. (2011). The effects of brand experiences, trust and satisfaction
on building brand loyalty; an empirical research on global brands. Procedia - Social and
Dr Kip Kiefer, Rollins College-Florida. Dr. Kip Kiefer is an Associate Professor at Rollins College-
Behavioral Sciences, 24, 1288–1301. https://doi.org/10.1016/j. sbspro.2011.09.143.
Florida, USA. He is an award-winning teacher and researcher having earned Best Instructor
Schiffman, L. G., & Kanuk, L. L. (2010). Consumer Behavior. New Jersey: Pearson-Prentice Hall.
Awards at the Air Force Academy for both core and elective courses and won the Academy of
Schivinski, B., Christodoulides, G., & Dabrowski, D. (2016). Measuring consumers’ engagement
Management’s coveted Sumantra Ghoshal Research Award. Dr. Kiefer consults for a number of
with brand-related social-media content: Development and validation of a scale that
organizations including small start-up firms such as Paranoid Fan and medium-sized enterprises
identifies levels of social-media engagement with brands. Journal of Advertising Research,
such as Therapy West Inc. Prior to joining Rollins, Dr. Kiefer served over 21 years as an American
56(1), 64–80. https://doi.org/10.2501/JAR-2016-004.
Air Force officer conducting Acquisitions Program Management. His assignments included a wide
Shankar, A. (2020). Four innovations that will define real estate in the new normal. CNBC, 8 July
variety of programs ranging from large- scale space launch acquisitions to entrepreneurial
2020. https://www.cnbctv18.com/real-estate/four-innovations-that- will-define-real-
emerging technology exploration. In one of his final Air Force assignments, Dr. Kiefer managed
estate-in-the-new-normal-6290251.htm.
several elements of the Air Force’s Unmanned Aerial Vehicle (drone) research, development and
Shugan, S. M. (2002). The cost of thinking. Journal of Consumer Research, 7(2), 99. testing programs.
https://doi.org/10.1086/208799.
Shao, C. Y., Baker, J. A., & Wagner, J. A. (2004). The effects of appropriateness of service contact
Dr Justin Paul, USA. Dr Justin Paul, a former faculty member of University of Washington, is
personnel dress on customer expectations of service quality and purchase intention: The
currently a full Professor in the Ph.D & MBA programs at the University of Puerto Rico, San Juan,
moderating influences of involvement and gender. Journal of Business Research, 57(10),
PR, USA and holds a title- ‘Distinguished Scholar’ with India’s premier business school- IIM (IIM-
1164–1176. https://doi.org/10.1016/S0148-2963(02)00326-0.
K). He is well known as an author/co-author of best selling text books – Business Environment
Shevlin, M., & Miles, J. N. V. (1998). Effects of sample size, model specification and factor loadings
(4th edition), International Marketing, (2nd edition) Management of Banking & Financial
on the GFI in confirmatory factor analysis. Personality and Individual Differences, 25(1), 85–
Services (2nd edition) and Export-Import Management (2nd edition) by McGraw-Hill, Pearson &
90. https://doi.org/10.1016/S0191-8869(98)00055-5.
Oxford University Press respectively. He serves as Editor in Chief, International J of Consumer
Shi, Y.Y. (2006), The international well-known image of the cartoon character authorization
studies. He served as a full time faculty member with the Rollins College-Florida, and Nagoya
merchandise brand, brand relates to article quality and relate to quality to the research of
University – Japan, accredited by AACSB & AMBA in the past. Dr. Paul is known as for developing
brand loyalty influence. The Da Yep University. Master’s thesis.
and introducing Masstige model and measure for brand management, Masstige theory for
Sreejesh, S., Paul, J., Strong, C., & Pius, J. (2020). Consumer response towards social media
marketing, CPP Model for internationalization of firms, 7-P Framework for Performance &
advertising: Effect of media interactivity, its conditions and the underlying mechanism.
International Marketing and SCOPE framework for success of SMEs. His articles have been
International Journal of Information Management, 54, Article 102155.
downloaded over 700,000 times, which rank him among the most downloaded academicians in
Steenkamp, J. B. E. M., Batra, R., & Alden, D. L. (2003). How perceived brand globalness creates
the field of business and economics. He is an author of over 90 articles in SSCI listed journals, out
brand value. Journal of International Business Studies, 34(1), 53–65. https://
of which 40+ are in journals ranked as A & A star by Australian Business Deans Council. He served
doi.org/10.1057/palgrave.jibs.8400002.
as the youngest Department Chairperson at Indian Institute of Management (IIM), the premier
Taylor, S. A., Sharland, A., Cronin, J. J., & Bullard, W. (1993). Recreational service quality in the
business school in South Asia at age 30. He has taught full courses at Aarhus University- Denmark,
international setting. International Journal of Service Industry Management, 4(4), 68–86.
Grenoble Eco le de Management- France, Universite De Versailles -France, Warsaw University-
https://doi.org/10.1108/09564239310044316.
Poland, Vilnus & ISM Universities, Lithuania and has been a visiting professor and invited speaker
Teas, R. K. (1993). Expectations, performance evaluation, and consumers’ perceptions of quality.
at University of Chicago, Vienna University of Economics and Business, Deakin University-
Journal of Marketing, 57(4), 18. https://doi.org/10.2307/1252216.
Australia, University of Queensland, University of Puget Sound, St.Martyn’s University-USA, VSE-
Temporal, P. (2006). Branding for survival in Asia. Journal of Brand Management, 12(5), 374–378.
University of Prague, Fudan University-Shanghai, and UIBE- Beijing. He has conducted corporate
https://doi.org/10.1057/palgrave.bm.2540232.
training many times for South East Asian Bank-Mauritious, Al Omaniya Financial Services-Oman,
Tiago, M. T. P. M. B., & Veríssimo, J. M. C. (2014). Digital marketing and social media:
South Indian Bank, Federal Bank and Thomas Cook. He has also authored/co-authored two more
Why bother? Business Horizons, 57(6), 703–708.
books namely International Business and Services Marketing. He is also known as an Author of 3
Toldos-Romero, M. de la P., & Orozco-Gomez, M. M. (2015). Brand personality and ´ purchase
Best Selling Case studies pub by Ivey-Canada & distributed by Harvard Business School (1. LV in
intention. European Business Review, 27(5), 462–476. https://doi.org/ 10.1108/EBR-03-
Japan 2. Ferro Industries- Exporting Challenge 3. L’oserie- Turnaround challenges). 2013-0046.
Tsaur, S. H., Yen, C. H., & Yan, Y. T. (2016). Destination brand identity: Scale development and
validation. Asia Pacific Journal of Tourism Research, 21(12), 1310–1323.
https://doi.org/10.1080/10941665.2016.1156003.
Vassileva, B. (2017). Marketing 4.0: How technologies transform marketing organization. Obuda ´
university e-Bulletin, 7(1), 47.
Voeth, M., & Herbst, U. (2008). The concept of brand personality as an instrument for advanced
non-profit branding–an empirical analysis. Journal of Non-profit & Public Sector Marketing,
19(1), 71–97. https://doi.org/10.1300/j054v19n01_04.
Vohra, S. (2020). Technology can help India’s real estate sector but no one’s listening. Quartz
India, 24 January 2020. https://qz.com/india/1790677/indian-real-estate- must-use-
technology-to-tide-over-rera-blues/.
Yannopoulou, N., Koronis, E., & Elliott, R. (2011). Media amplification of a brand crisis and its
effect on brand trust. Journal of Marketing Management, 27(5–6), 530–546.
https://doi.org/10.1080/0267257X.2010.498141.
Yang, Y.R. (2006), The research of the server industry brand image. The Fu Ren University. Master’s thesis.
Yang, Z., & Peterson, R. T. (2004). Customer perceived value, satisfaction, and loyalty: The role of switching costs. Psychology and Marketing, 21(10), 799–822. https://doi. org/10.1002/mar.20030.
Tài liệu liên quan:
-
Final Exam: Key Research Concepts and Methodologies | Môn Business research method - Trường Đại học Quốc tế, Đại học Quốc gia Thành phố Hồ Chí Minh
106 53 -
Final Exam Notes on Structured & Unstructured Abstracts | Môn Business research method - Trường Đại học Quốc tế, Đại học Quốc gia Thành phố Hồ Chí Minh
101 51 -
Sampling Methods Review - Summary of Business Research Techniques | Môn Business research method - Trường Đại học Quốc tế, Đại học Quốc gia Thành phố Hồ Chí Minh
97 49 -
Literature Review on Online Shopping Attitude and Intentions | Môn Business research method - Trường Đại học Quốc tế, Đại học Quốc gia Thành phố Hồ Chí Minh
101 51