Microeconomics - Giáo trình: Principles & Market Interactions môn Xác suất thống kê| Trường Đại học Ngoại Thương
Rather than being self-sufficient, people can specialize inproducing one good or service and exchange it for other goods ·Countries also benefit from trade and specialization. Tài liệu giúp bạn tham khảo, ôn tập và đạt kết quả cao. Mời đọc đón xem!
Môn: Xác suất thống kê (FTU) 355 tài liệu
Trường: Trường Đại học Ngoại Thương 1.1 K tài liệu
Tác giả:


Preview text:
20:42, 27/01/2026
Microeconomics - Giáo trình: Principles & Market Interactions - Studocu MICROECONOMICS
Chapter 1. Ten Principles of Economics
What economics is all about
Scarcity: the limited nature of society’s resources
oNeeds/wants (unlimited) > supplying ability (limited)
o→ We have to deal with scarcity in our daily lives
Economics: the study of how society manages its scarce resources, e.g.
oHow people decide what to buy, how much to work, save, and spend
oHow firms decide how much to produce, how many workers to hire
The principles of how people make decisions 1. People face tradeoffs
All decisions involve tradeoffs. Example: going to a party the night before your midterm leaves less time for studying
Society faces an important tradeoff: efficiency vs. equality
Efficiency: when society gets the most from its scarce resources
Equality: when prosperity is distributed uniformly among society’s members
2. The cost of something is what you give up to get it
Making decisions requires comparing the costs and benefits of alternative choices.
The opportunity cost (OC) of any item is whatever must be given up to obtain it.
3. Rational people think at the margin Rational people
osystematically and purposefully do the best they can to achieve their objectives
omake decisions by evaluating costs and benefits of marginal changes -
incremental adjustments to an existing plan. Marginal thinking
oMarginal cost (MC): The change in total cost resulting from a change from quantity
oMarginal benefit (MB): The change in total benefit resulting from a change from
quantity, ( the additional benefits arising from a unit increase, is a maximum
amount a consumer is willing to pay for an additional good or service. It is also
the additional satisfaction or utility that a consumer receives when the additional good or service is purchased)
4. People respond to incentives
Incentive: something that induces a person to act, i.e. the prospect of a reward or punishment
Rational people respond to incentives
The principle of how people interact
5. Trade can make everyone better off 20:42, 27/01/2026
Microeconomics - Giáo trình: Principles & Market Interactions - Studocu
Rather than being self-sufficient, people can specialize in producing one good or service
and exchange it for other goods
Countries also benefit from trade and specialization
oGet a better price abroad for goods they produce
oBuy other goods more cheaply from abroad than could be produced at home
6. Markets are usually a good way to organize economic activity
Market: a group of buyers and sellers (need not be in a single location)
competitive market a market in which there are many buyers and many sellers so that
each has a negligible impact on the market price
“Organize economic activity” means determining owhat goods to produce ohow to produce them ohow much of each to produce owho gets them A
allocates resources through the decentraliz market economy ed decisions of many
households and firms as they interact in markets.
Each of these households and firms acts as if “led by an invisible hand” to promote general economic well-being. Economic mechanism omarket economy (1) oplanning economy (2) omixed economy (3) 2 3 1
7. Governments can sometimes improve market outcomes
Important role of gov: enforce property rights (with police, courts)
People are less inclined to work, produce, invest, or purchase if large risk of their property being stolen
The principles of how the economy as a whole works
8. A country’s standard of living depends on its ability to produce goods and services.
9. Prices rise when the government prints too much money
10. Society faces a short-run tradeoff between inflation and unemployment
Chapter 2: The market forces of supply and demand Demand
The quantity demanded of any good is the amount of the good that buyers are willing and able to purchase 20:42, 27/01/2026
Microeconomics - Giáo trình: Principles & Market Interactions - Studocu
Law of demand: the claim that the quantity demanded of a good falls when the price of the good rises, other things equal
oPrice (P) ↑ → Quantity demanded (QD) ↓
oPrice (P) ↓ → Quantity demanded (QD) ↑
oP and QD: inverse relationship
Market Demand as the Sum of Individual Demands ( e.g: At a price of $2.00, Catherine demands
4 ice-cream cones, and Nicholas demands 3 ice-cream cones. The quantity demanded in the
market at this price is 7 cones) Demonstrating Demand
Demand schedule: a table that shows the relationship between the price of a good and the quantity demanded
Example: Helen’s demand for lattes
Notice that Helen’s preferences obey the Law of Demand Demand curve Demand function P = -aQD + b Q = -cP + d D Q = f(Px,Py,I,T,E,N) D P : price of the good itself x P : price of related goods y I: Income of consumers T: Taste of consumers E: Expectation of consumers N: Number of consumers
Determinants in demand function Price of related goods (P y)
oSubstitute goods: Two goods for which an increase in the price of one leads to an
increase in the demand for the other (e.g: Suppose that the price of frozen yogurt falls.
The law of demand says that you will buy more frozen yogurt. At the same time, you will
probably buy less ice cream. Because ice cream and frozen yogurt are both cold, sweet,
creamy desserts, they satisfy similar desires. When a fall in the price of one good reduces
the demand for another good, the two goods are called substitutes. Substitutes are often
pairs of goods that are used in place of each other)
oComplementary goods: two goods for which an increase in the price of one leads to a
decrease in the demand for the other ( e,g suppose that the price of hot fudge falls.
According to the law of demand, you will buy more hot fudge. Yet in this case, you will
buy more ice cream as well because ice cream and hot fudge are often used together. 20:42, 27/01/2026
Microeconomics - Giáo trình: Principles & Market Interactions - Studocu
When a fall in the price of one good raises the demand for another good, the two goods
are called complements.)
oKing Camp Gillett (1855 - 1932) Income of consumer (I) oI ↑ → QD ↑ I ↓ → QD ↓
→ Positive → Normal goods (If the demand for a good falls when income falls, the good is called a normal good) oI ↓ → QD ↑ I ↑ → QD ↓
→Inverse → Inferior goods (An example of an inferior good might be bus rides. As
your income falls, you are less likely to buy a car or take a cab and more likely to ride a bus)
oEngel curve: Attitude toward any goods depends on buyer’s income, not on good’ quality Taste of consumer (T) Age Gender Religion Expectation of consumer (E)
Forecast of consumers about the market in the future and based on that focus, they’d have
the equivalent activity at the current time
Movement and shift of the demand curve
Movement: Px – endogenous ( nội sinh ) variable
Shift: The rest determinants - exogenous variables
Any change that raises the quantity that buyers wish to purchase at any given price shifts the
demand curve to the right. Any change that lowers the quantity that buyers wish to purchase at
any given price shifts the demand curve to the left.
There is a simple way to tell when it is necessary to shift a curve: When a variable that is not
named on either axis changes, the curve shifts. Income is on neither the x-axis nor the y-axis of
the graph, so when Emma’s income changes, her demand curve must shift. Supply
The quantity supplied of any good is the amount that the sellers are willing and able to sell.
Law of supply: the claim that the quantity supplied of a good rises when the price of the good rises
oPrice (P) ↑ → Quantity supplied (QS) ↑
oPrice (P) ↓ → Quantity supplied (QS) ↓ Demonstrating supply 20:42, 27/01/2026
Microeconomics - Giáo trình: Principles & Market Interactions - Studocu
Supply schedule: A table that shows the relationship between the price of a good and the quantity supplied Supply curve Supply function
oP = aQS + b ( Kiểu như y=aX + b) oQ = cP + d S Q = f (Px, Pi, G, Te, E, N) S P : price of the good itself x P : price of input y G: government’s policy Te: technology E: seller’s expectation N: number of sellers
Determinants in supply function Price of inputs (Pi)
P ↑ → C (cost of production) ↑ → Profit ↓ → QS ↓ i
P ↓ → C ↓ → Profit ↑ → QS ↑ i Government’s policies Tax → QS ↓ Subsidy → QS ↑ Quota Expectation
Suppliers' forecast about the market in the future → Change their current supply accordingly
Movement and shift of the supply curve
The market supply curve holds other things constant, the curve shifts when one of the factors changes
(e.g the price of sugar falls. Sugar is an input into producing ice cream, so the fall in the price of sugar
makes selling ice cream more profitable. This raises the supply of ice cream )
Movement: Px - endogenous variable
Shift: The rest factors - exogenous variables
Supply and demand together
Equilibrium: P has reached the level where quantity supplied equals quantity demanded
Equilibrium price: the price that equates quantity supplied with quantity demanded
Equilibrium quantity: the quantity supplied and quantity demanded at the equilibrium price
The equilibrium is found where the supply and demand curves intersect. At the equilibrium
price, the quantity supplied equals the quantity demanded.
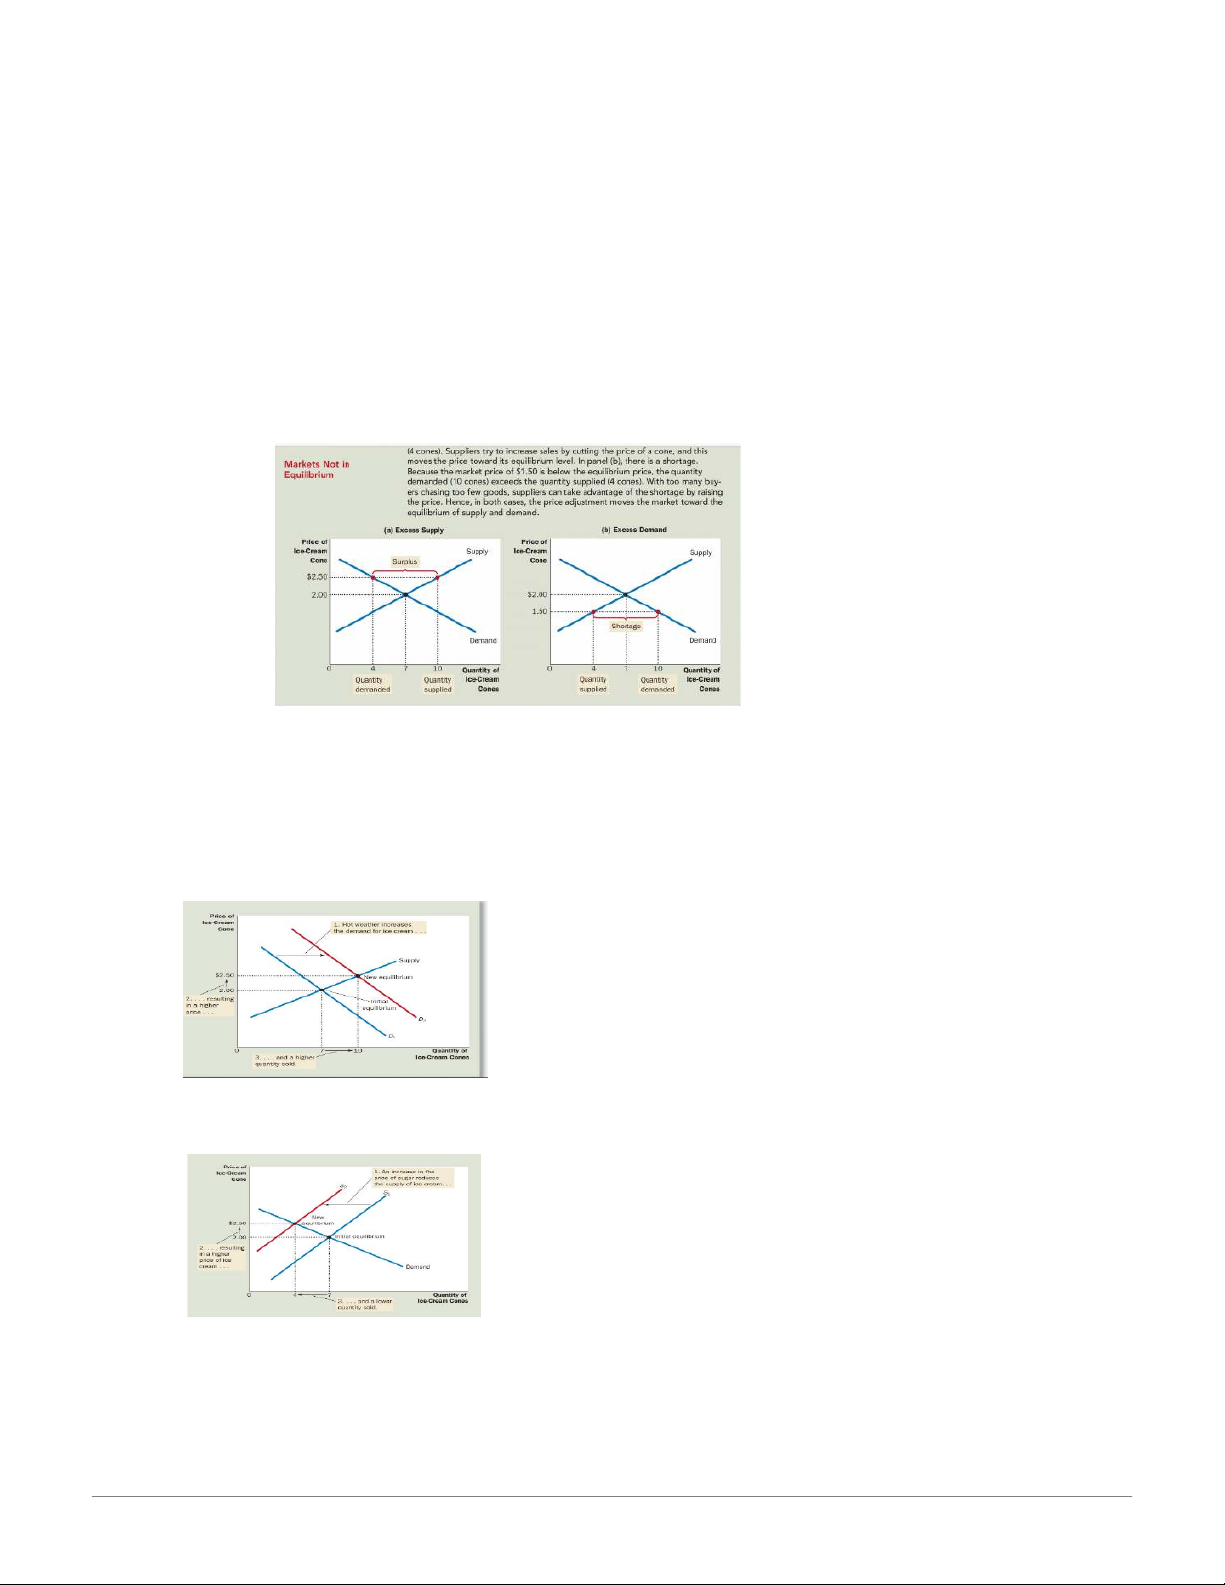
Shortage : a situation in which quantity demanded is greater than quantity supplied 20:42, 27/01/2026
Microeconomics - Giáo trình: Principles & Market Interactions - Studocu
Surplus : a situation in which quantity supplied is greater than quantity demanded
Law of supply and demand the claim that the price of any good adjusts to bring the quantity supplied
and the quantity demanded for that good into balance ( Once the market reaches its equilibrium, all
buyers and sellers are satisfied, and there is no upward or downward pressure on the price. In most free
markets, surpluses and shortages are only temporary because prices eventually move toward their equilibrium levels. )
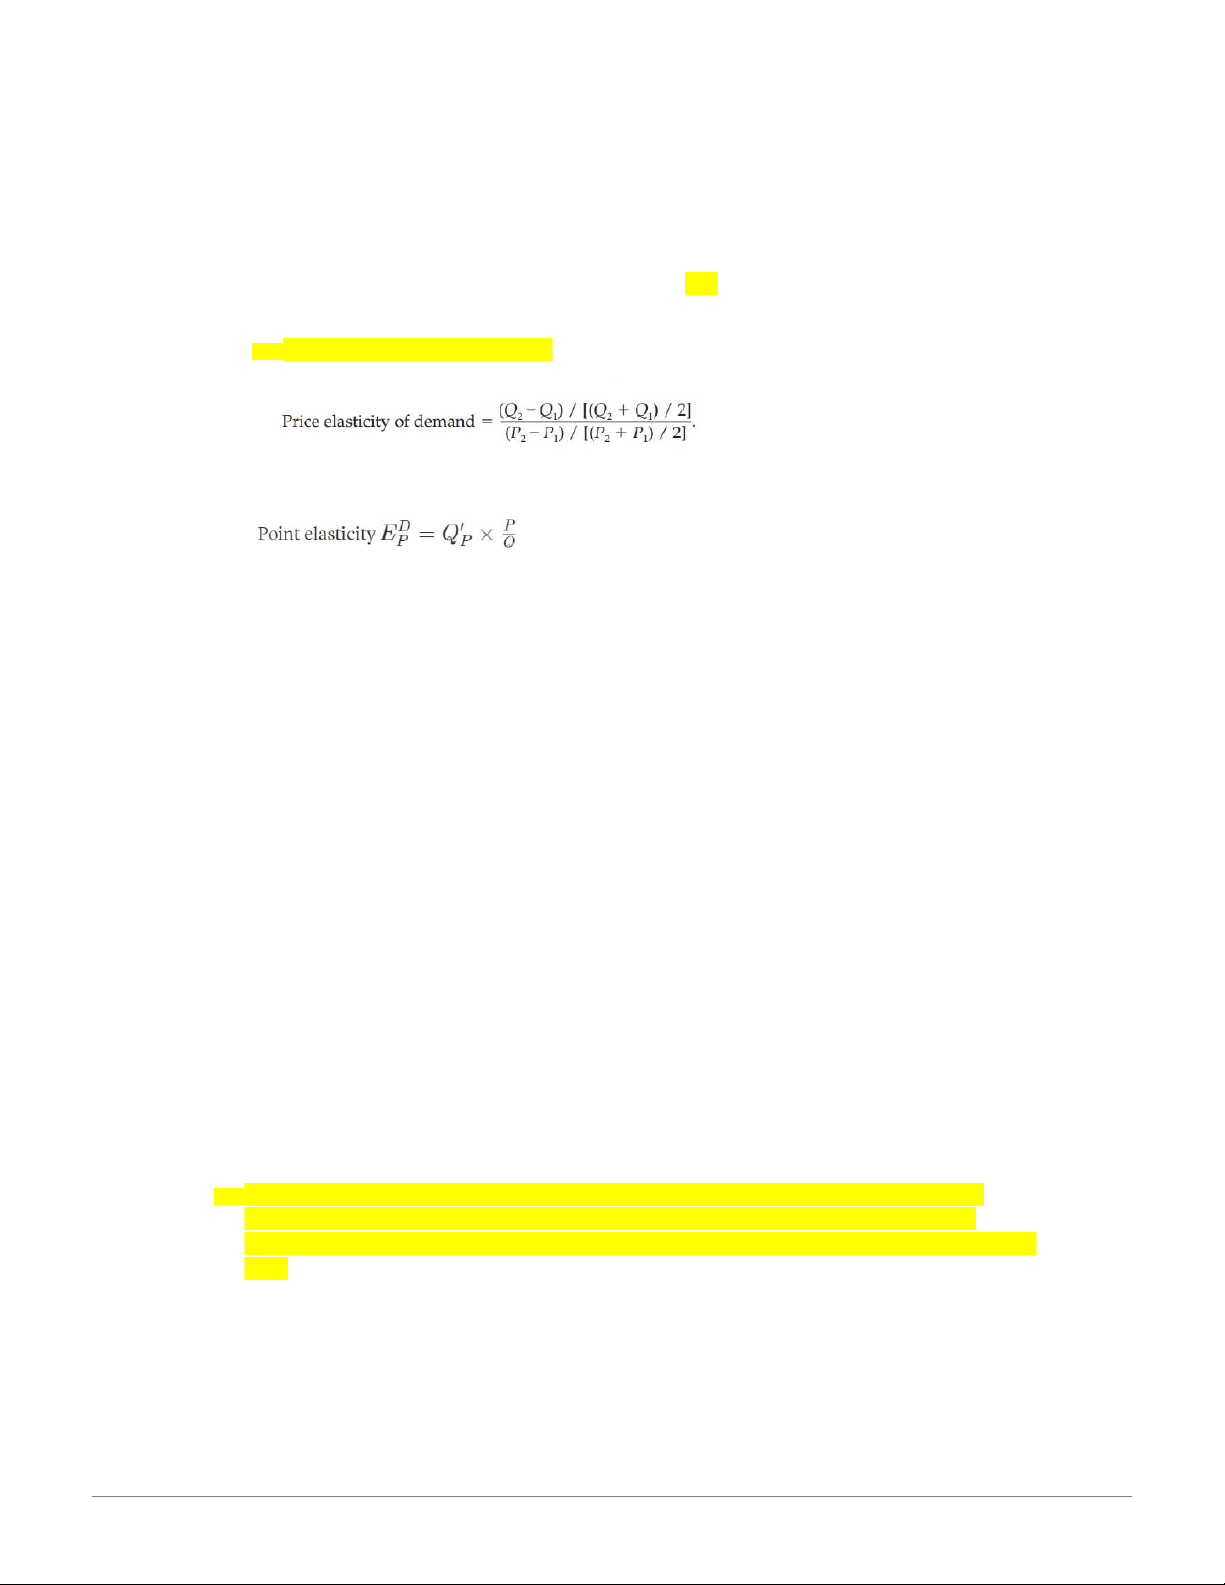
Three Steps for Analyzing Changes in Equilibrium
1. Decide whether the event shifts the supply or demand curve (or perhaps both).
2. Decide in which direction the curve shifts.
3. Use the supply-and demand diagram to see how the shift changes the equilibrium price and quantity.
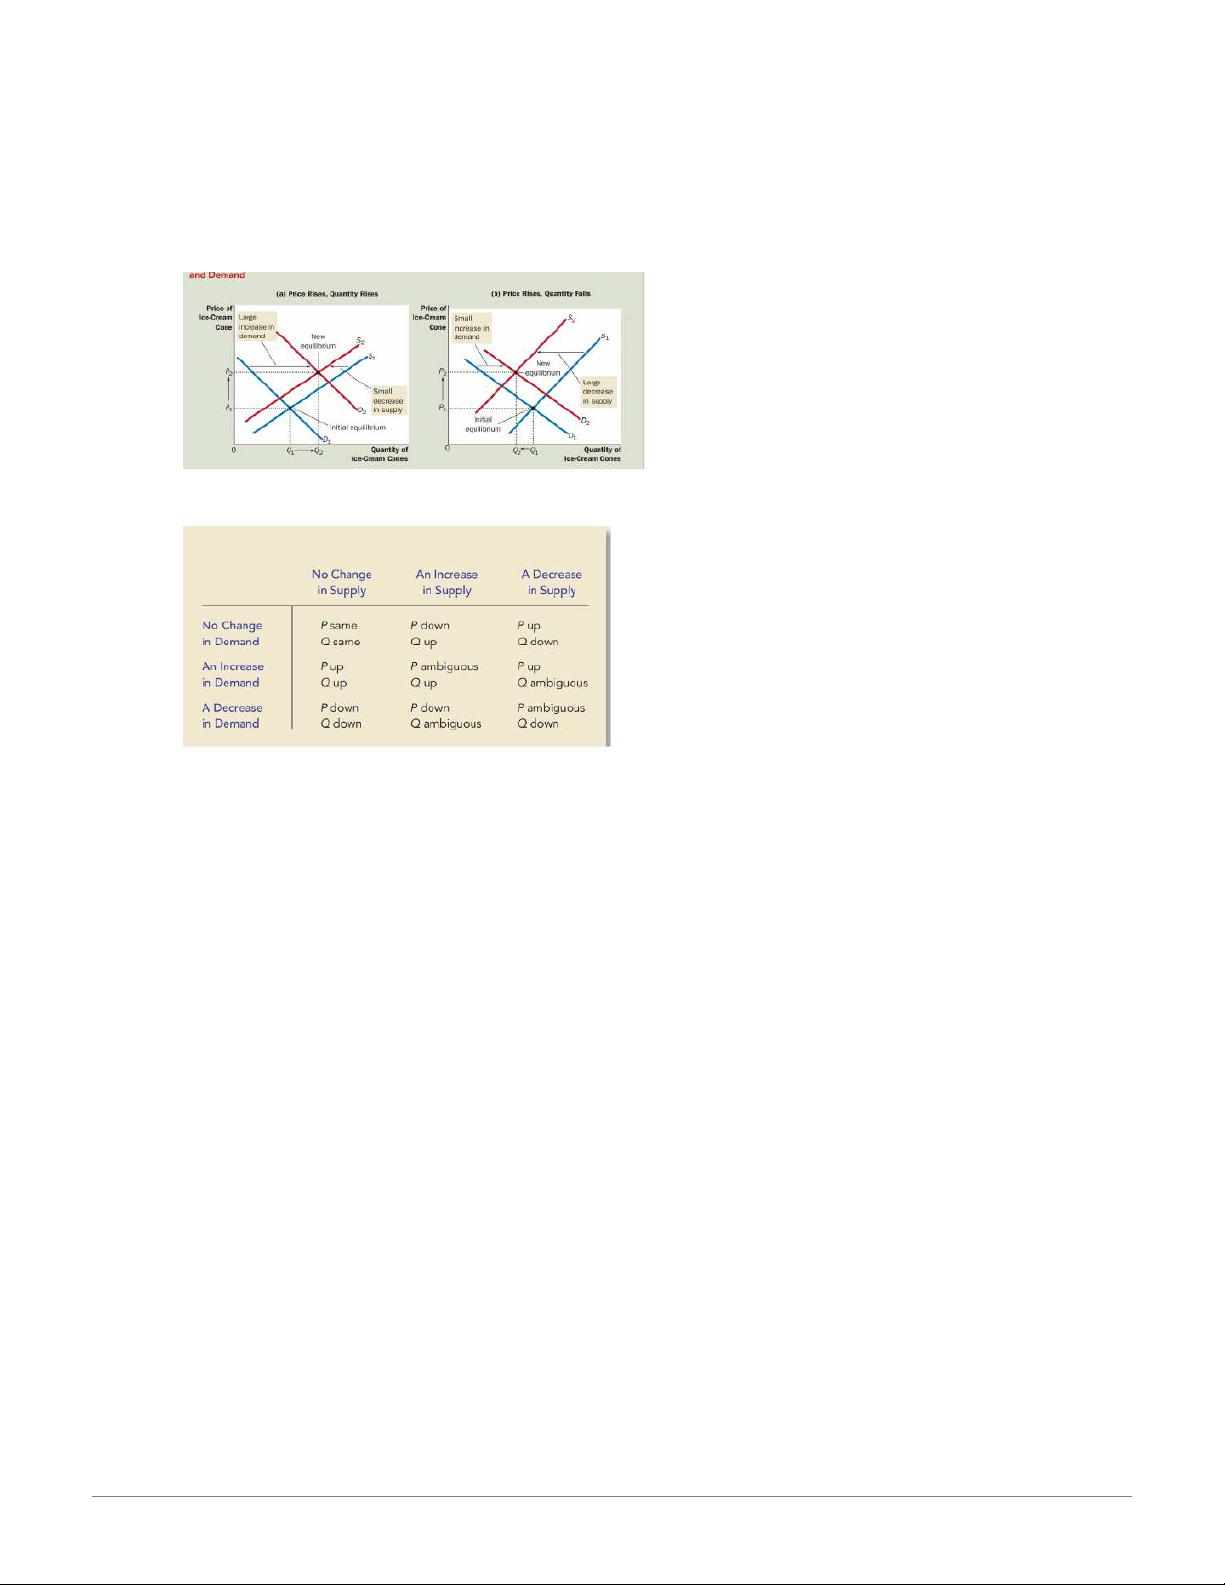
How an increase in demand affects the equilibrium?
( trời nóng nên nhu cầu ăn kem tăng => giá kem tăng => người bán
sản xuất nhiều hơn => tạo ra “equilibrium” mới )
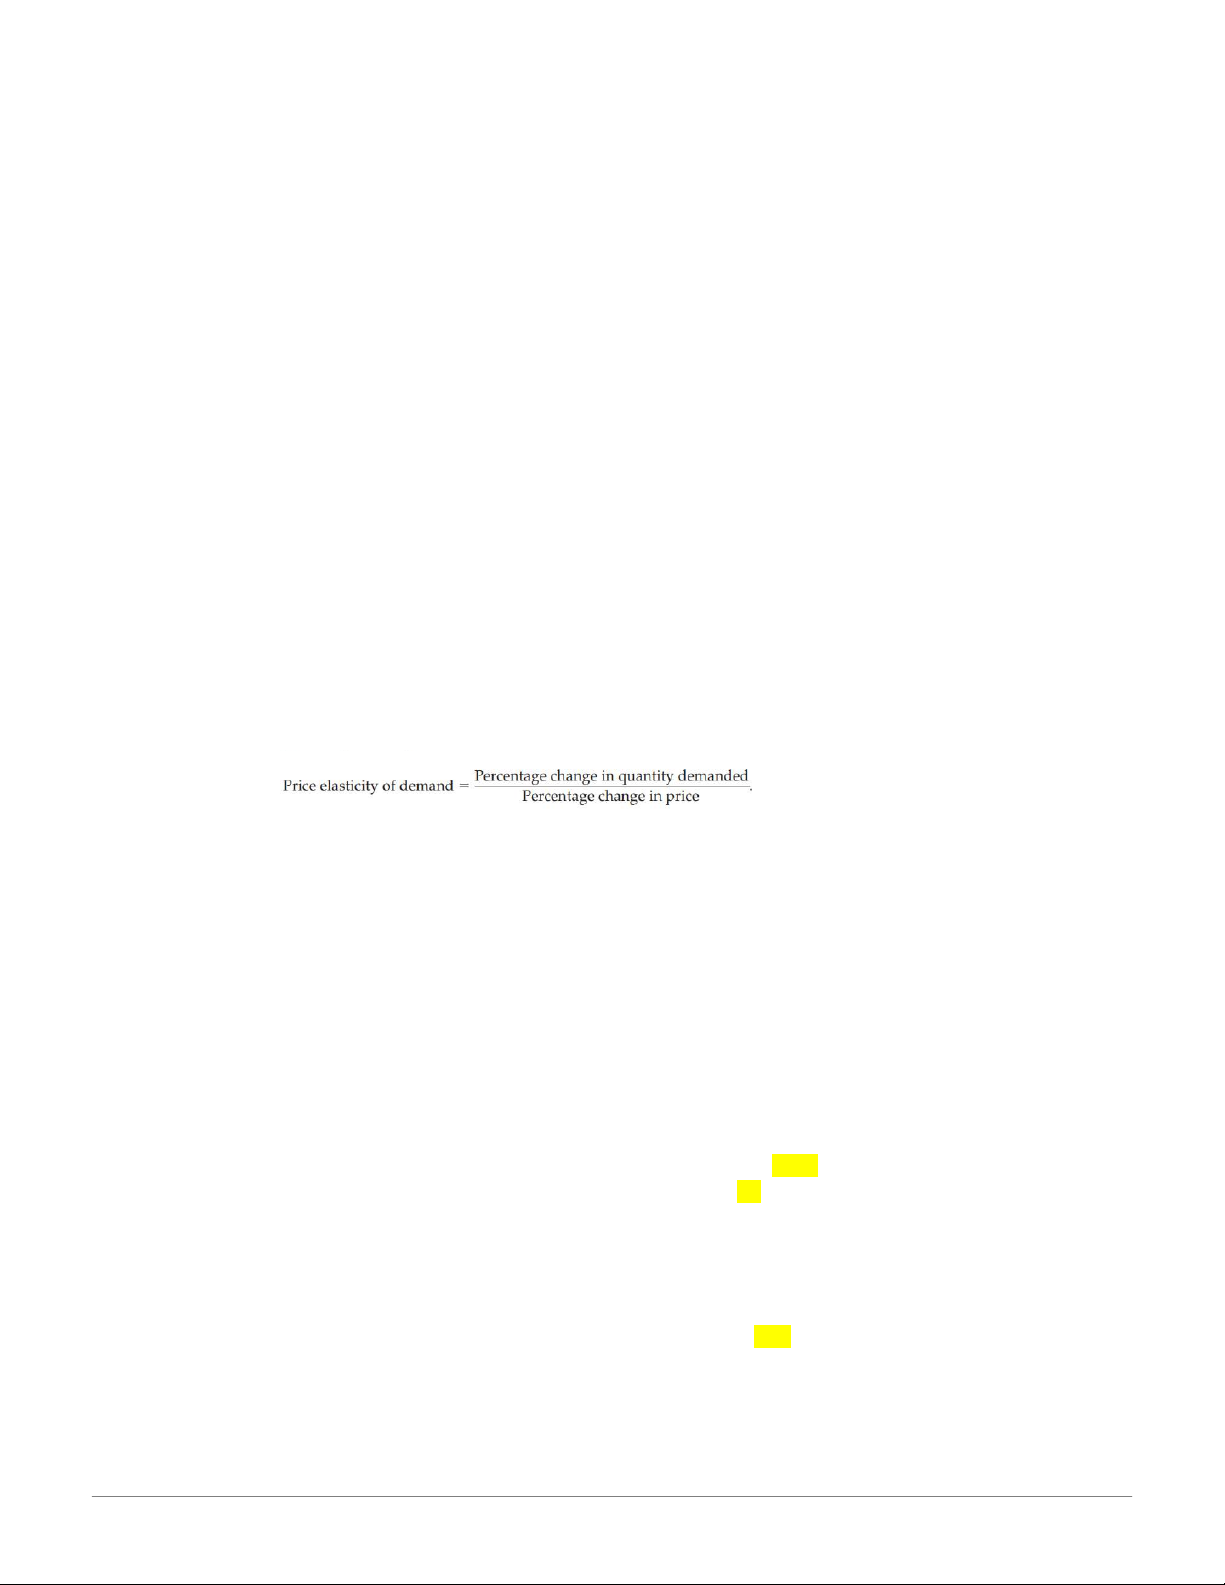
How a decrease in supply affects the equilibrium?
( giá đường tăng => làm ít kem đi (cung giảm) => giá kem tăng => bán được ít hơn )
A shift in both supply and demand 20:42, 27/01/2026
Microeconomics - Giáo trình: Principles & Market Interactions - Studocu Summary
CHAPTER 3 : ELASTICITY AND ITS APPLICATION
The Elasticity of Demand
Elasticity: A measure of how much buyers and sellers respond to changes in market
conditions. A measure of the responsiveness of quantity demanded or quantity supplied to
one of its determinants ( yếu tố quyết định )
price elasticity of demand : a measure of how much the quantity demanded of a good
responds to a change in the price of that good, computed as the percentage change in
quantity demanded divided by the percentage change in price
Demand for a good is said to be elastic if the quantity demanded responds substantially to
changes in the price. Demand is said to be inelastic if the quantity demanded responds only
slightly to changes in the price. ( Nếu giá thành thay đổi mà cầu thay đổi rất ít thì gọi là
inelastic, nếu giá thành thay đổi mà cầu THAY ĐỔI RẤT NHIỀU thì mình gọi là elastic”
The price elasticity of demand for any good measures how willing consumers are to buy less of the good as its price rises
Rules about what determines the the price elasticity of demand
-Availability of close substitutes : Goods with close substitutes tend to have more elastic demand
because it is easier for consumers to switch from that good to others ( sản phẩm dễ dàng bị thay
thế, E.g : butter and margarine: giá bơ tăng, giá bơ thực vật giữ nguyên thì nguồn cầu của bơ sẽ 20:42, 27/01/2026
Microeconomics - Giáo trình: Principles & Market Interactions - Studocu
rớt mạnh mẽ. Ngược lại với bơ, trứng không dễ bị thay thế, vậy nên demand for eggs is less
elastic than the demand for butter )
-Necessities versus Luxuries ( Characteristics of goods) : Necessities tend to have inelastic
demands, whereas luxuries have elastic demands. ( Cái gì thiết yếu thì sẽ inelastic, cái gì cao cấp
thì sẽ elastic, tùy thuộc vào góc nhìn của mỗi người )
-Definition of the Market : The elasticity of demand in any market depends on how we draw the
boundaries of the market. Narrowly defined markets tend to have more elastic demand than
broadly defined markets because it is easier to find close substitutes for narrowly defined goods
( VD: nếu thị trường của mình là đồ ăn thì sẽ rất inelastic vì không có gì để thay thế đồ ăn, nếu
thị trường là kem, một category nhỏ hơn, thì sẽ elastic vì có những món thay thế được kem, nếu
thị trường là kem vanilla, một category nhỏ hơn nữa, thì sẽ càng elastic thì vị kem nào cũng thay
thế được kem vani). Thị trường càng nhỏ thì càng có elastic demand
-Time Horizon : Goods tend to have more elastic demand over longer time horizons ( VS : giá
xăng tăng, trong vài tháng đầu nguồn cầu sẽ giảm đi một tí. Sau một thời gian dài, vì giá xăng
tăng nên sẽ có thêm nhiều người mua xe tiết kiệm xăng, dung phương tiện công cộng hoặc
chuyển nhà đến gần chỗ làm. Sau vài năm, nguồn cầu của xăng sẽ ngày càng giảm nhiều hơn )
Computing the price of Elasticity of demand
CHU Y : LẤY SAU – TRƯỚC = A RỒI LẤY A/TRƯỚC x100% ( LÀM ƠN ĐỪNG QUÊN )
VD: Giá kem tăng 10% thì nguồn cầu giảm 20%. Khi đó, elasticity of demand được tính là : 20%/10% = 2
the elasticity is 2, reflecting that the change in the quantity demanded is proportionately twice as large as the change in the price
THE MIDPOINT METHOD: A BETTER WAY TO CALCULATE PERCENTAGE CHANGES AND ELASTICITIES
Problem: The elasticity from point A to point B seems different from the elasticity from point B to point A.
VD: Point A: Price = $4 Quantity = 120
Point B: Price = $6 Quantity = 80
Đi từ A-B, Giá tăng 50%, cầu giảm 0.33% => price elasticity = 0.66%
Đi từ B-A, giá giảm 33%, cầu tăng 50%, price elasticity = 1.5 KHÔNG BẰNG NHAU
Dùng midpoint method: Tìm số ở giữa 2 đầu và đuôi ( THƯỜNG SỬ DỤNG KHI TÌM ELASTICITY GIỮA 2 ĐIỂM)
VD : giữa 4 và 6 là 5, giữa 120 và 80 là 100
Với midpoint là 5, khi đi từ A – B, giá thay đổi : (6-4)/5 x 100 = 40%. 20:42, 27/01/2026
Microeconomics - Giáo trình: Principles & Market Interactions - Studocu
Ngược lại, khi đi từ B-A, giá thay đổi : (4-6)/5 x 100 = 40% BẰNG NHAU
Công thức tổng quát của midpoint: Point elasticity :
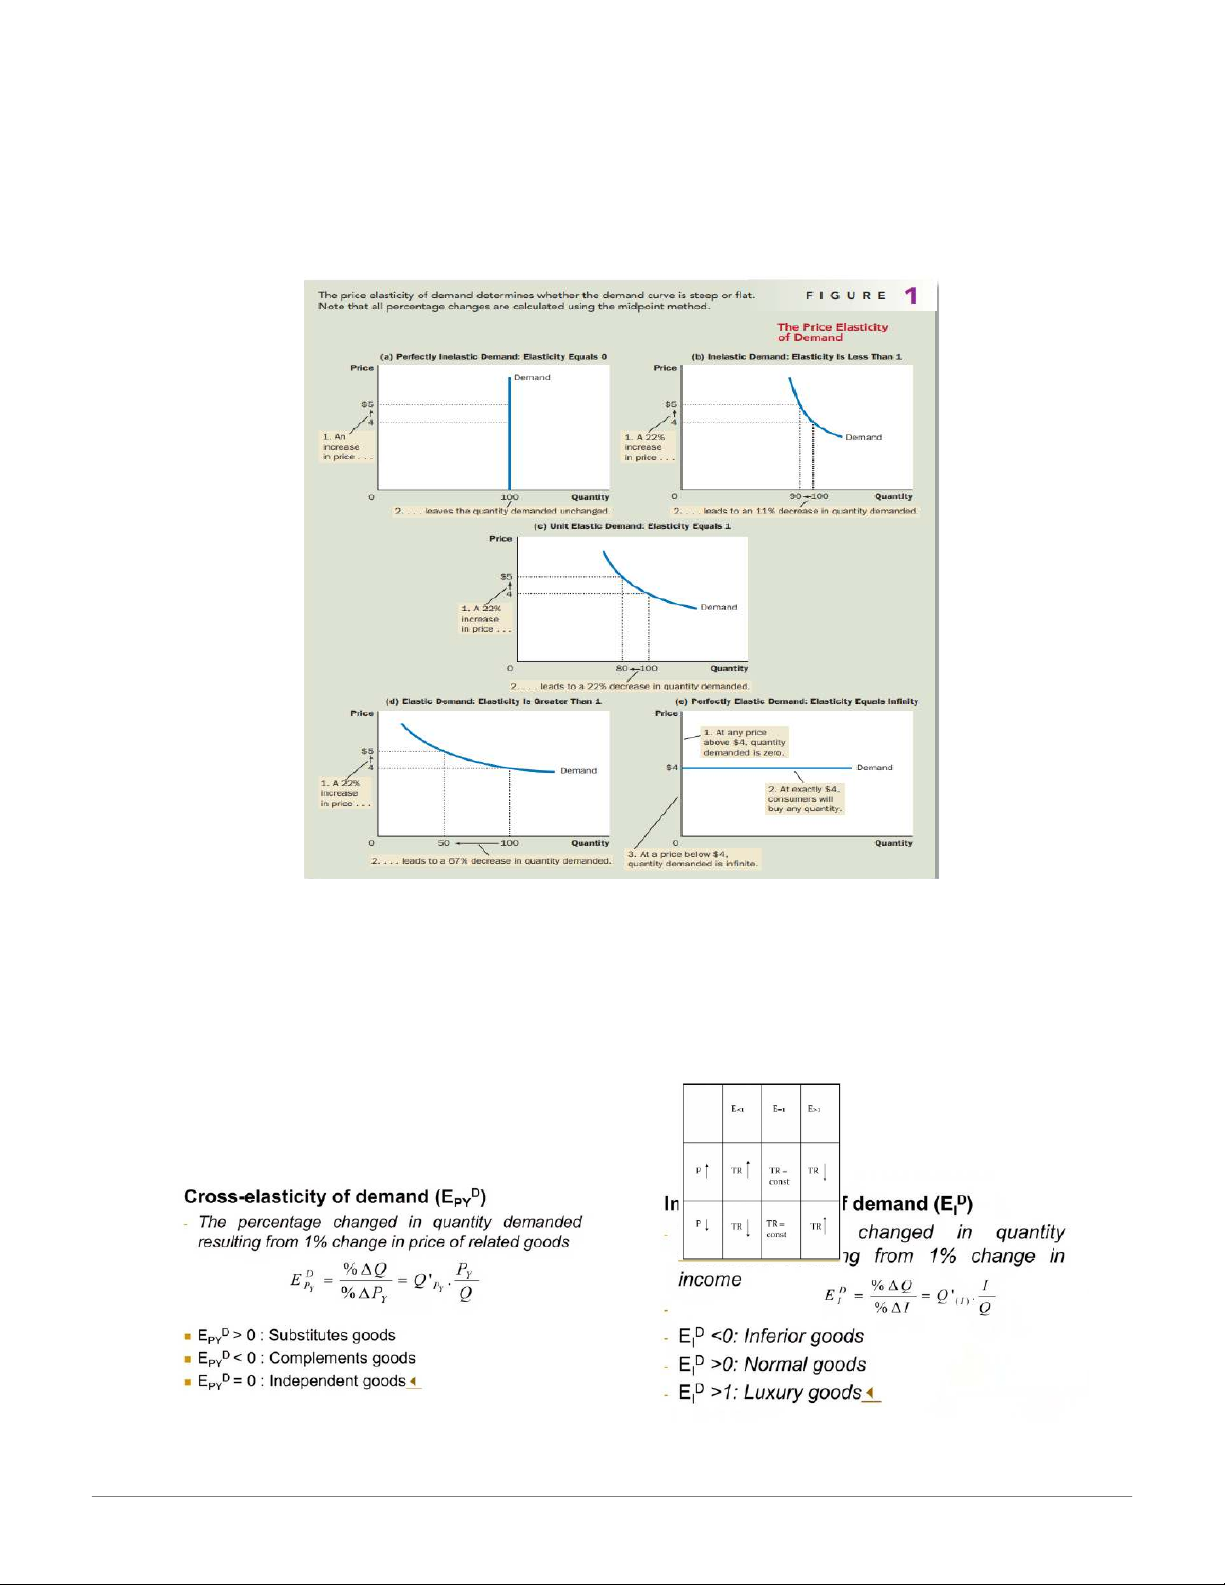
THE VARIETY OF DEMAND CURVES |E|<1: Inelastic demand oSteep demand curve
oLarge change in price, small change in quantity demanded
oConsumers are not very sensitive to the change in price.
oThe good is hard to substitute or necessity. |E|>1: Elastic demand oFlat demand curve
oSmall change in price, large change in quantity demanded
oConsumers are very sensitive to change in price.
oThe good is easy to substitute or not necessity.
|E|=1: Unitary-elastic demand oSlope down demand curve.
o%change in price equals to %change in quantity demanded.
|E|=0: Perfectly Inelastic demand
oDemand curve is parallel to the vertical axis
oChange in price doesn't affect quantity demanded
oConsumers are not sensitive to change in price oThe good is irreplaceable
|E|=infi: Perfectly elastic demand
oDemand curve is parallel to the horizontal axis.
oChange in price affects totally quantity demanded
oConsumers are perfectly sensitive to change in price
oThe good is in the perfect competition market.
The flatter the demand curve that passes through a given point, the greater the price elasticity of
demand. The steeper the demand curve that passes through a given point, the smaller the price
elasticity of demand. ( Qua 1 điểm, đường càng bẹt thì elastic càng lớn, đường càng dốc thì elastic càng nhỏ ) 20:42, 27/01/2026
Microeconomics - Giáo trình: Principles & Market Interactions - Studocu
TOTAL REVENUE AND THE PRICE ELASTICITY OF DEMAND
Total revenue: the amount paid by buyers and received by sellers of the good.
In any market, total revenue is P × Q
If demand is inelastic, an increase in the price causes an increase in total revenue
If demand is elastic: An increase in the price causes a decrease in total revenue
The relationship between Elasticity and Total Revenue 20:42, 27/01/2026
Microeconomics - Giáo trình: Principles & Market Interactions - Studocu
CHAPTER 4 : THEORY ON CUSTOMER’S BEHAVIOUR
Theory on consumer’s utility Definitions : Utility (U):
oThe benefit of satisfaction a person gets from consuming goods or services. oAn abstract concept. oUnit - Free
oDepends on consumer's perception (subjectivity)
oWe choose a option because it brings us highest utility oE.g: 2 6-member families: -
1st family : live in Hang Dao street w only apartment of 15m2, very happy
- 2nd family: 150m2 in My Dinh area, also happy Total Utility (TU)
oThe total benefit or satisfaction a person gets from the consumption of goods and services
oDepends on the person's level of consumption - more consumption generally gives more total utility Marginal utility (MU)
oThe change in total utility resulting from the change in the quantity of consumed goods and services
The principle of diminishing marginal utility
In a certain time period, continuous consumption will lead to increase in total utility but a decrease in marginal utility
How to take advantage of this principle to make money L supply the right amount ( Hermes always
choose their costumer, create a shortage in their market Consumer’s surplus
The difference between the market price and the price buyer willing to pay
The area below demand curve and above price line
Theory on consumer’s choice Consumer’s preferences 20:42, 27/01/2026
Microeconomics - Giáo trình: Principles & Market Interactions - Studocu Some assumptions -
Preferences do not depend on good’s price or consumer’s income -
People can sort all the possible combinations of good that might be consumed into 3 groups:
preferred, not preferred and different - Consumers prefer more or less -
Consumer’s preference is transitive
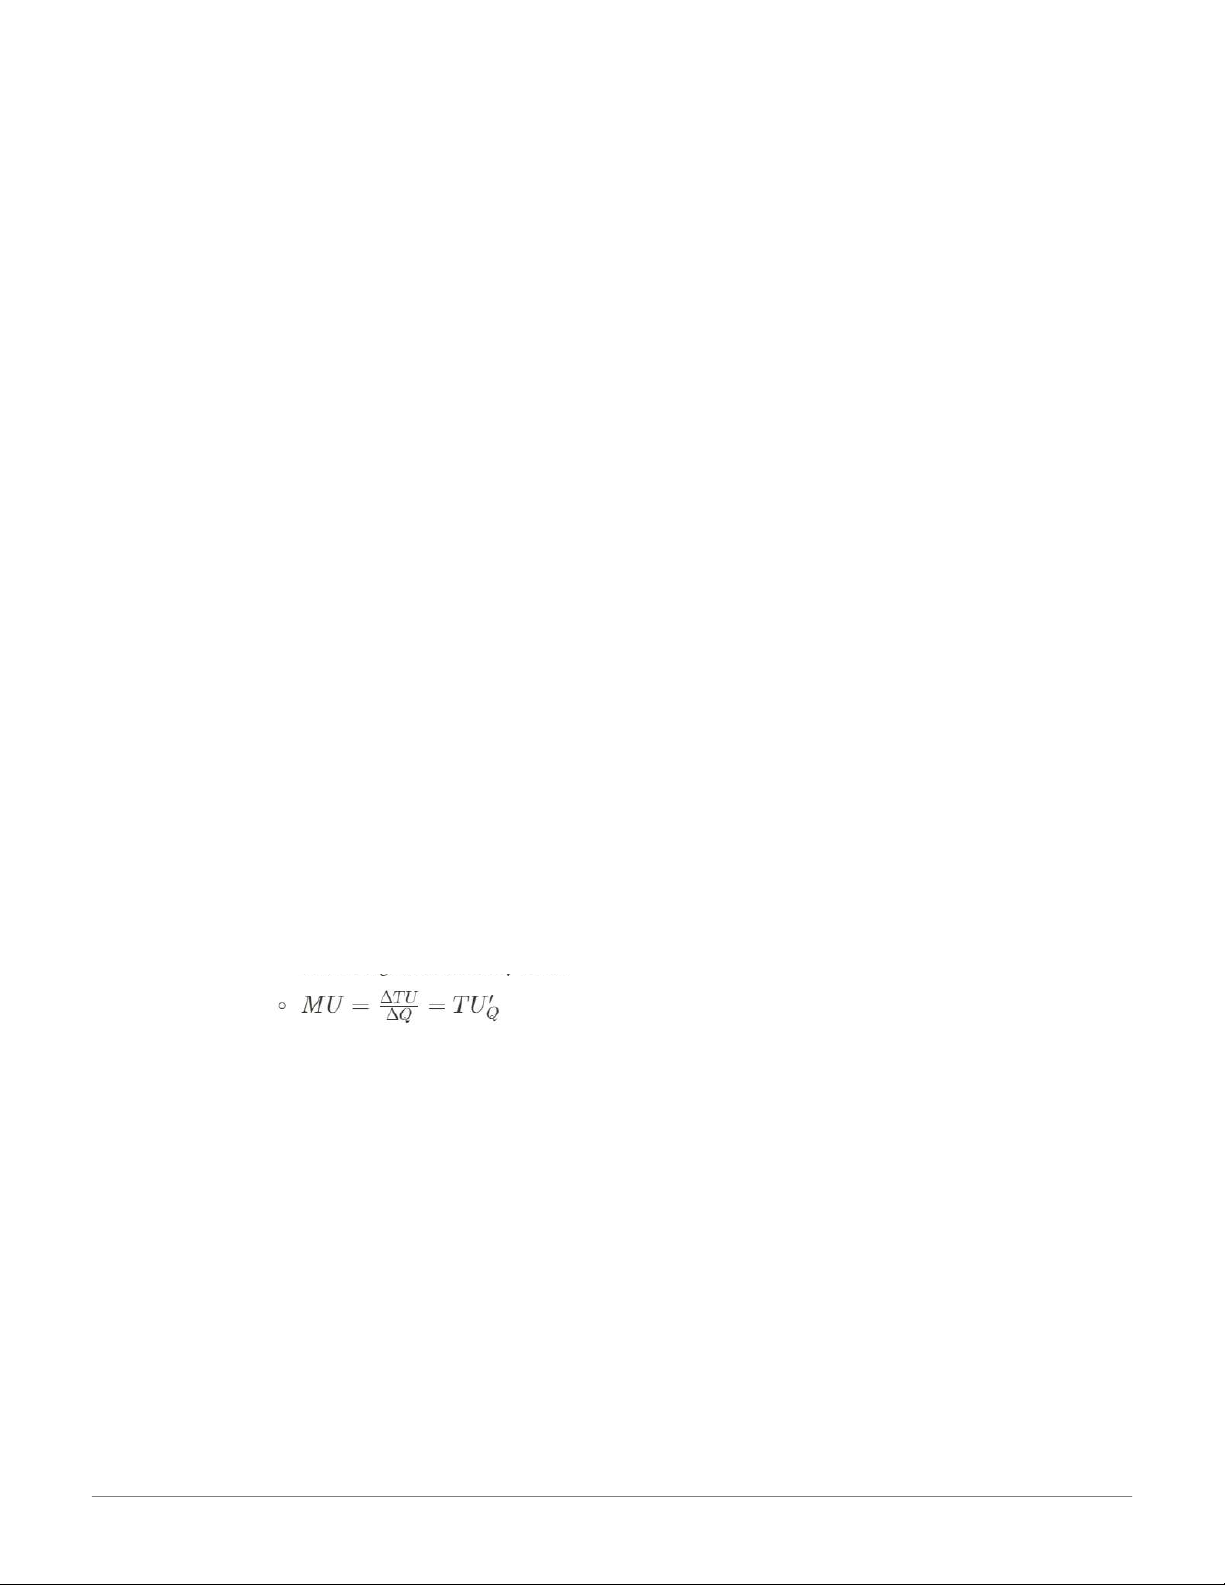
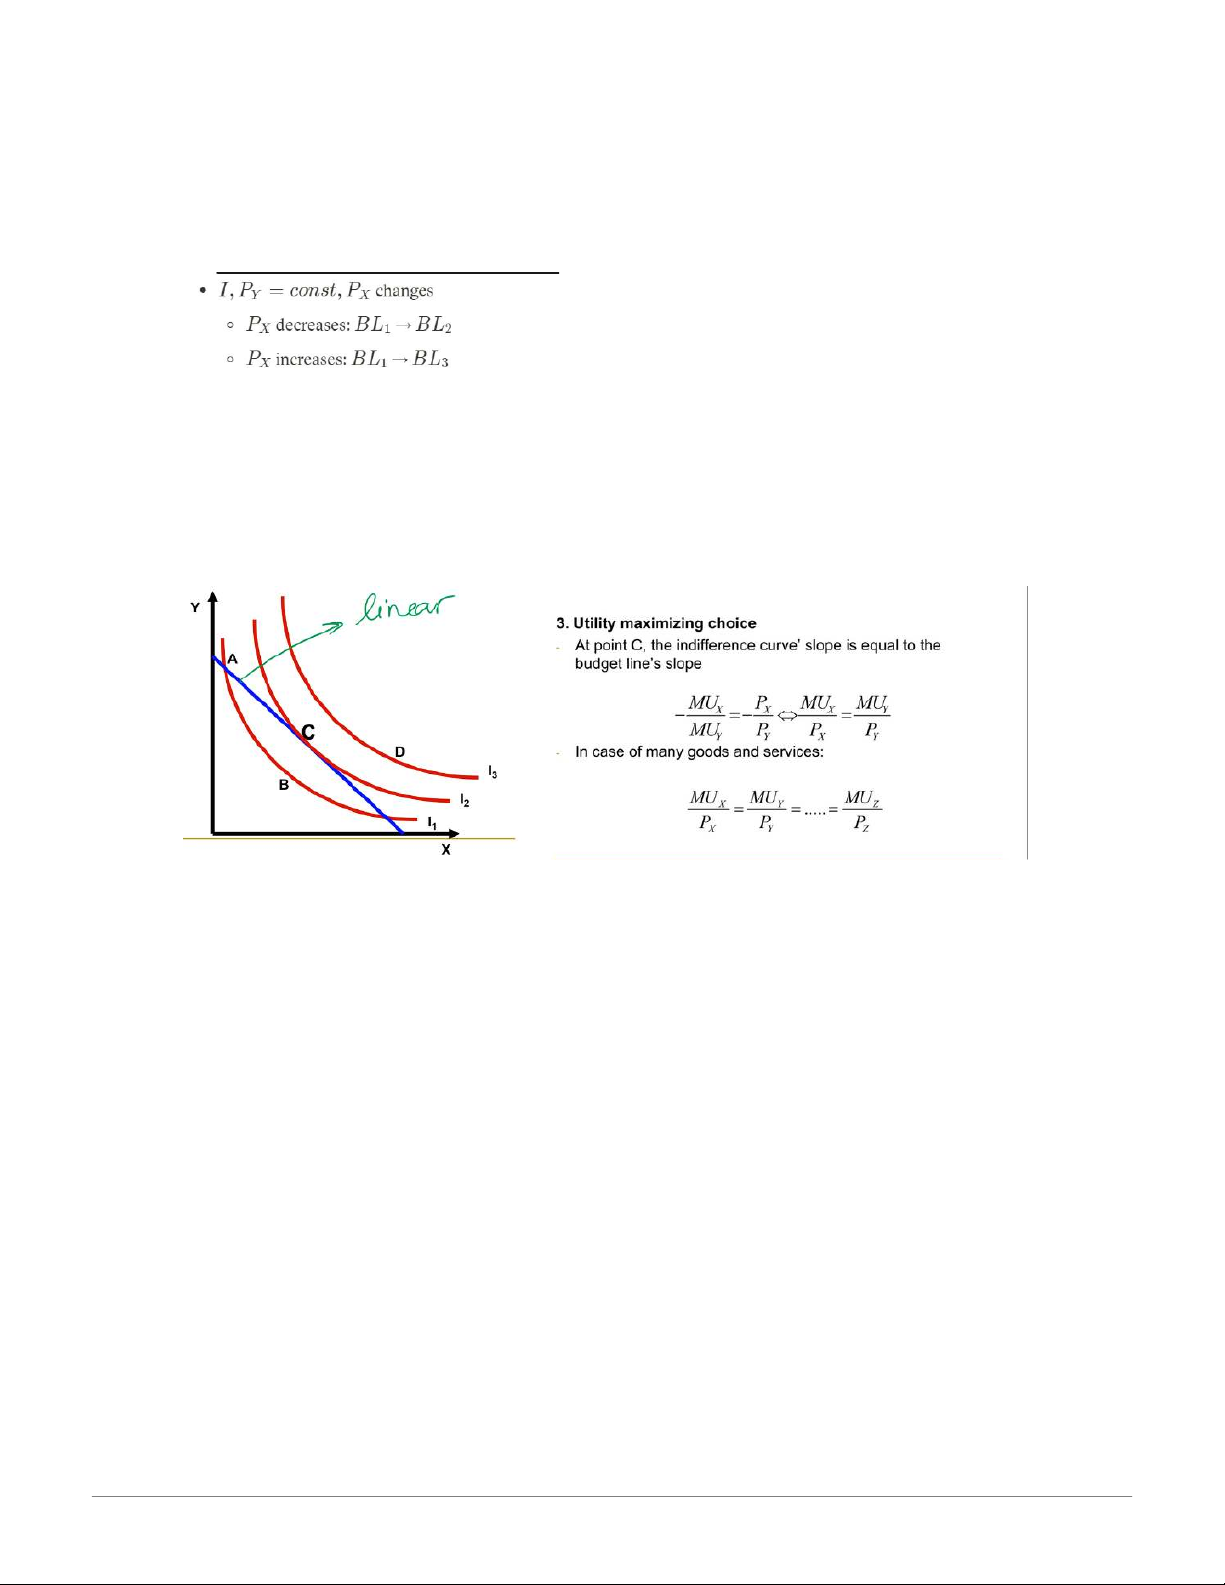
Indifference curve: shows the various combinations or consumption quantities that lead to the same
level of well-being or happiness
Indifference curve’s characteristics -
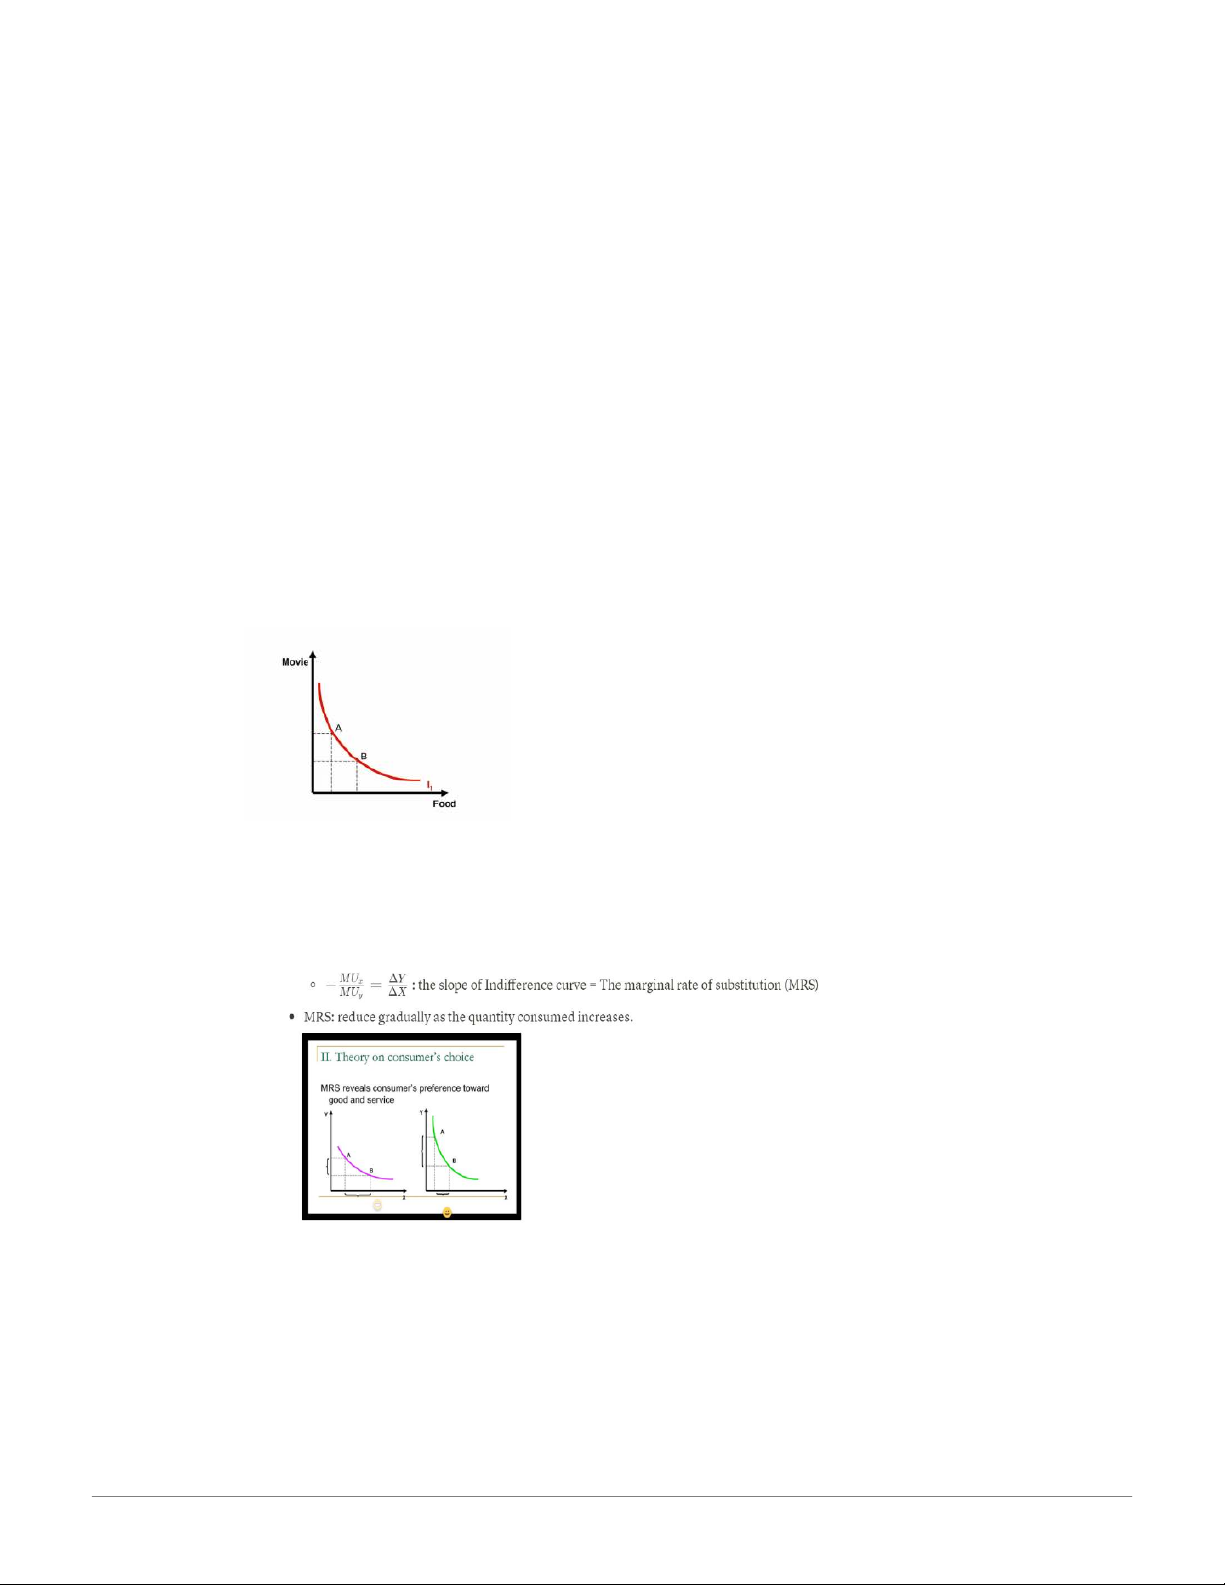
Downward sloping, the closer to the right hand side, the higher utility consumer can gain - Never intersect - Slop of indifference curve -
Special Indifference curve
Perfect substitute good Perfect Complement Goods 20:42, 27/01/2026
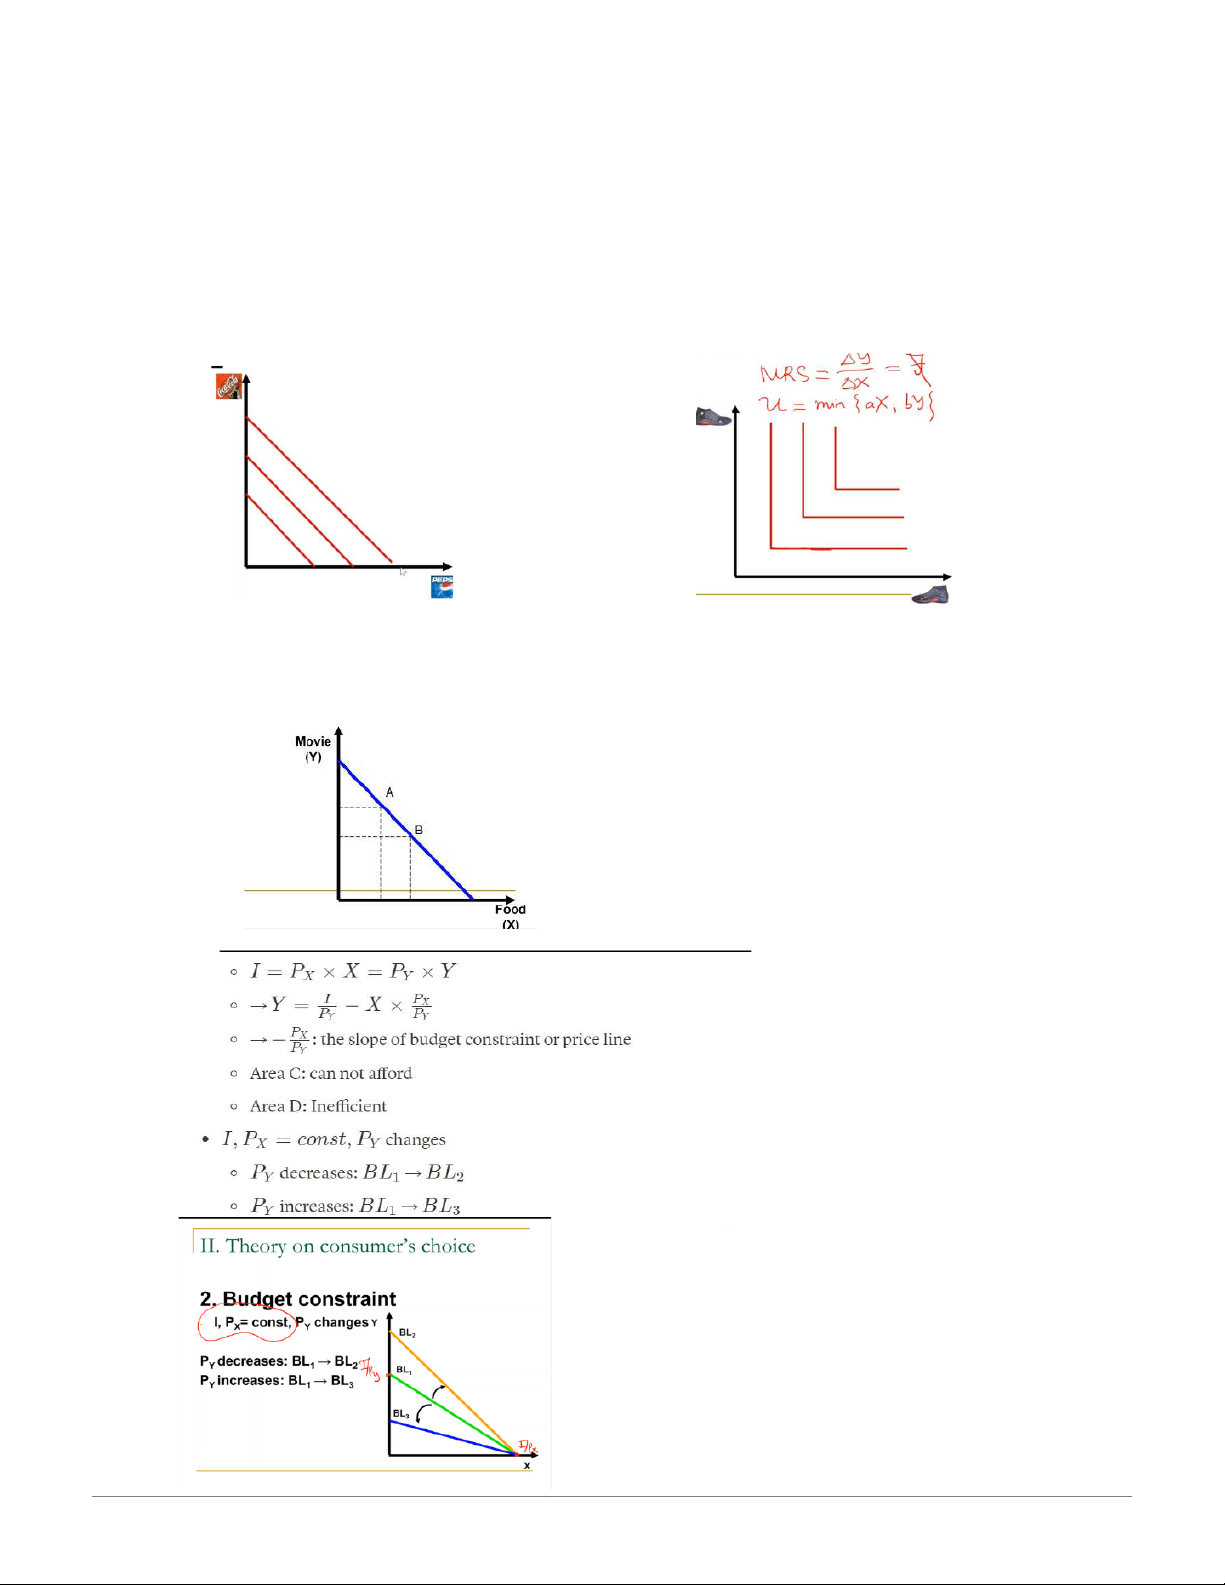
Microeconomics - Giáo trình: Principles & Market Interactions - Studocu Budget Constraint
Budget line (BL) : shows the various combination of consumption that consumer can get from the available income 20:42, 27/01/2026
Microeconomics - Giáo trình: Principles & Market Interactions - Studocu
Optimal consumption combination
CHAPTER 5: THEORY IN FIRM’S BEHAVIOUR Theory on production Definition -
Production : the process to make inputs become outputs
Inputs: consider only L and non-L : Material (M) Labour (L) Capital (K) Outputs Goods ( Tangible) Services ( Intangible) - Short run and Long run
Short run : a period or time in which the quantity or at least on inputs is fixed ( fixed input( and
the quantities of the other inputs can be varied ( variable inputs )
Long run : is a period of time in which the quantity of all inputs can be varied
No specific time that can be marked on the calendar to separate the short run from the long run Production function
The maximum quantity of outputs gained from certain quantity of inputs at current technology
constraint in a certain time period Q = f ( Xi) 20:42, 27/01/2026
Microeconomics - Giáo trình: Principles & Market Interactions - Studocu
Cobb- Douglas production function
For production, the function is Q= output L= labor input K= capital input
Alpha and beta = labor and capital’s share of output Theory on cost Cost in short-run
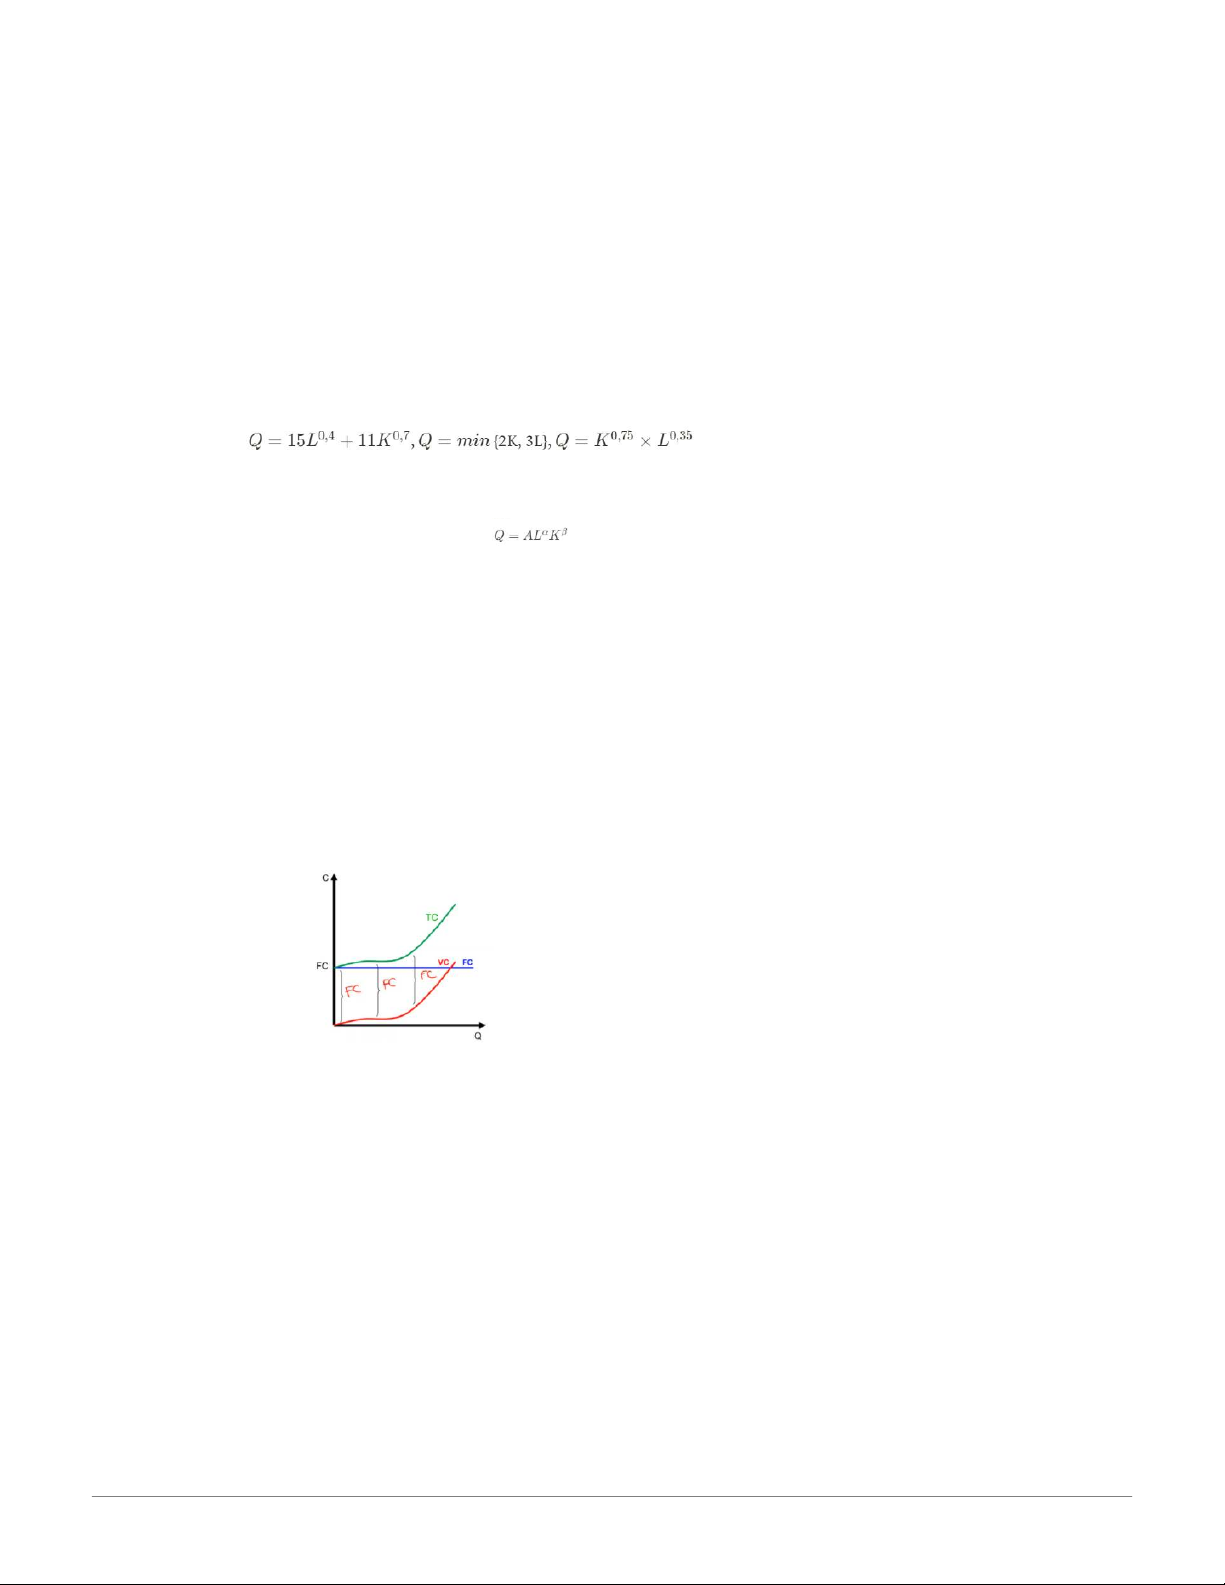
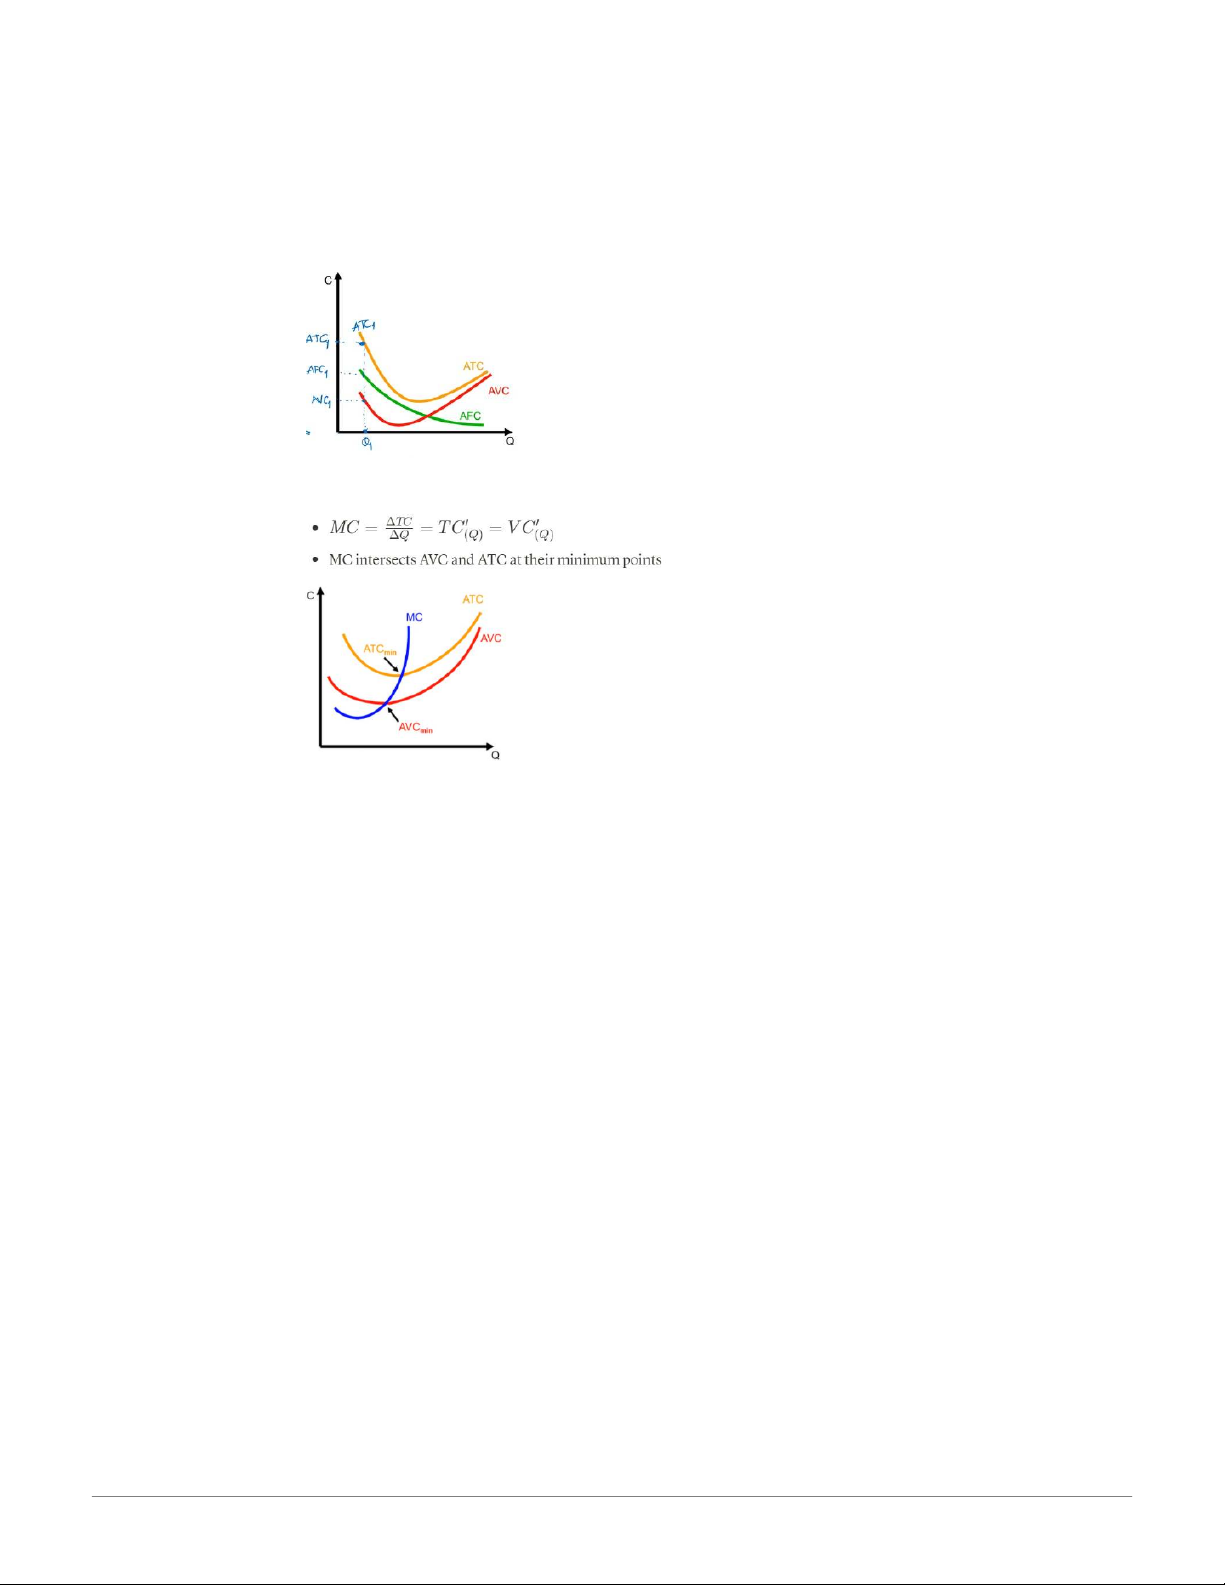
Fixed cost (FC): the cost of a variable input, independent with the output level (horizontal line )
Variable cost (VC) : the cost of a variable input, varies with the output level ( upward sloping)
Total cost (TC) : is the sum of toal fixed cost and total variable cost TC=VC+FC Average cost
Average fixed cost (AFC): is total fixed cost per unit of output AFC = FC/Q
Average variable cost (AVC): is total variable cost per unit of output AVC = VC/Q
Average curves (except AFC) are U-shaped
Average total cost (ATC): is total cost per unit of output AFC = TC/Q = AVC + AFC
Marginal cost (MC) : is the change in total cost results from a unit increase in output 20:42, 27/01/2026
Microeconomics - Giáo trình: Principles & Market Interactions - Studocu
Economic cost, Accounting cost and sunk cost
Economics cost : total amount paid for inputs used in production, includes
Explicit cost: amount paid for inputs that do not belong to firm’s owner
Implicit cost : amount paid for inputs that belong to the firm;s owner
Economic cost = Explicit cost + Implicit cost + Opportunity cost
Accounting cost : Amount paid for inputs used in production and reported in accounting notes
Economic cost = Accounting cost + opportunity cost
Sunk cost L Amount paid for inputs used in production which neither be refundable nor
changeable by future decisions/actions 20:42, 27/01/2026
Microeconomics - Giáo trình: Principles & Market Interactions - Studocu
Tài liệu liên quan:
-

Bảng giá trị phân phối thống kê poisson và student môn Xác suất thống kê| Trường Đại học Ngoại Thương
27 14 -

Bảng giá trị quyết định thống kê wilcoxon rank-sum test môn Xác suất thống kê| Trường Đại học Ngoại Thương
29 15 -

Bài 1 Định nghĩa cổ điển về xác suất môn Xác suất thống kê| Trường Đại học Ngoại Thương
26 13 -

Exercises for probability & statistics môn Xác suất thống kê| Trường Đại học Ngoại Thương
26 13 -

Đề thi cuối kỳ lý thuyết môn Xác suất thống kê| Trường Đại học Ngoại Thương
27 14