Overview of session - Ngôn ngữ anh | Học viện Tòa án

Spread. The spread of a distribution refers to the variability of the data. If the observations cover a wide range, the spread is larger. If the observations are clustered around a single value, the spread is smaller. Tài liệu giúp bạn tham khảo, ôn tập và đạt kết quả cao. Mời bạn đọc đón xem!

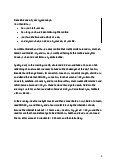
SESSION 2 – Summary Statistics (Central tendency)
Single variable data
- Scalar – a number
- 2-dimensional vector (bivariate data) – a couple of two numbers
Four Ways to Describe Data Sets
When you compare two or more data sets, focus on four features:
Center. Graphically, the center of a distribution is the point where
about half of the observations are on either side.
Spread. The spread of a distribution refers to the variability of the
data. If the observations cover a wide range, the spread is larger. If
the observations are clustered around a single value, the spread is
smaller.
Shape. The shape of a distribution is described
by , symmetry skewness, number of peaks, etc.
Unusual features. Unusual features refer to gaps (areas of the
distribution where there are no observations) and .outliers
Should mention Maximum and Minimum
Group 1 also mentioned: Frequency of variables
Summary statistics for variability
Range – maximum of dataset minus minimum of dataset
Mean Absolute Deviation – average of deviation
Standard deviation
Variance
We have learnt the majority of the important statistics terms
| 1/2

Preview text:

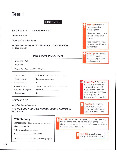
SESSION 2 – Summary Statistics (Central tendency) Single variable data - Scalar – a number -
2-dimensional vector (bivariate data) – a couple of two numbers
Four Ways to Describe Data Sets
When you compare two or more data sets, focus on four features: 
Center. Graphically, the center of a distribution is the point where
about half of the observations are on either side. 
Spread. The spread of a distribution refers to the variability of the
data. If the observations cover a wide range, the spread is larger. If
the observations are clustered around a single value, the spread is smaller. 
Shape. The shape of a distribution is described
by symmetry, skewness, number of peaks, etc. 
Unusual features. Unusual features refer to gaps (areas of the
distribution where there are no observations) and outliers. 
Should mention Maximum and Minimum
Group 1 also mentioned: Frequency of variables
Summary statistics for variability
Range – maximum of dataset minus minimum of dataset
Mean Absolute Deviation – average of deviation Standard deviation Variance
 We have learnt the majority of the important statistics terms