Probability and Statistics assignment
Probability and Statistics assignment
Môn: chủ nghĩa xã hội và khoa học 124 tài liệu
Trường: Trường Đại học Kinh Doanh và Công Nghệ Hà Nội 1.7 K tài liệu
Tác giả:


Preview text:
HANOI UNIVERSITY
FACULTY OF MANAGEMENT AND TOURISM
STATISTIC PROJECT
The proportion of FMT’s students taking part-time job
Tutor : Mr. Nguyen Hoang Viet
Tutorial’class: Tut 14 PAS
Tutorial’s time: Thurday 7.20am - 9.00am
Submission date: May 7, 2020 Student’s name Student ID Student’s name Student ID Nguyễn Thị Thu Hiền 1904010032 Phạm Thị Linh Quỳnh 1904050038 Bùi Khắc Tuấn 1904050042 Trịnh Huyền Thương 1904000109 Bùi Xuân Thủy 1904050050 Đàm Đình Bắc 1904040013 Phạm Thị Mai Lê 1904040057
Nguyễn Thị Mai Phương 1806090083
Downloaded by Nguyen Linh (vjt32@gmail.com) ABSTRACT
As far as our generations know, the workforce in Vietnam now accounts for an enormous
number of adolescents aged from 18 to 23 years old especially in college and university scholars
worldwide. Students are considered to be a labor force of well-conditioned, as knowledgeable
and physical capabilities to enter any career that appropriates them. In addition, students
working part-time have a steady monthly income, this source of remuneration helps them to pay
for living expenses, study, or other needs that lead to student labor increases significantly. This
report is produced in response to investigate whether the proportion of students working part-
time and the effects of positive and negative on their academic performance. In this context,
FMT's students in Hanoi University are targeted, and about 112 participating ones. Hopefully,
our research will be an ideal and useful reference that provides practical recommendations to
bring this project to life. 2 TABLE OF CONTENTS
1. Introduction. . . . . . . . . . . . . . . . . . . . . . . . . . . . . . . . . . . . . . . . . . . . . . . . . . . . . . . . . . . . . . . . 4
2. Research methodology. . . . . . . . . . . . . . . . . . . . . . . . . . . . . . . . . . . . . . . . . . . . . . . . . . . . . . . .5
2.1. Population and sample. . . . . . . . . . . . . . . . . . . . . . . . . . . . . . . . . . . . . . . . . . . . . . . . . . 5
2.2. Questionnaire design:. . . . . . . . . . . . . . . . . . . . . . . . . . . . . . . . . . . . . . . . . . . . . . . . . . 5
2.3. Sample size. . . . . . . . . . . . . . . . . . . . . . . . . . . . . . . . . . . . . . . . . . . . . . . . . . . . . . . . . . .6
2.4. Sampling method and data collection:. . . . . . . . . . . . . . . . . . . . . . . . . . . . . . . . . . . . . . 6
2.5. Data processing. . . . . . . . . . . . . . . . . . . . . . . . . . . . . . . . . . . . . . . . . . . . . . . . . . . . . . . .7
2.6. Significance level of test:. . . . . . . . . . . . . . . . . . . . . . . . . . . . . . . . . . . . . . . . . . . . . . . . 8
3. Descriptive Results and Findings. . . . . . . . . . . . . . . . . . . . . . . . . . . . . . . . . . . . . . . . . . . . . . 8
4. Results and Findings of the Hypothesis Test. . . . . . . . . . . . . . . . . . . . . . . . . . . . . . . . 16
4.1. Research question:. . . . . . . . . . . . . . . . . . . . . . . . . . . . . . . . . . . . . . . . . . . . . . . . . . . .16
4.2. Checking assumption:. . . . . . . . . . . . . . . . . . . . . . . . . . . . . . . . . . . . . . . . . . . . . . . . . 17
4.3. Hypotheses formulation:. . . . . . . . . . . . . . . . . . . . . . . . . . . . . . . . . . . . . . . . . . . . . . . 18
4.4. Rejection region:. . . . . . . . . . . . . . . . . . . . . . . . . . . . . . . . . . . . . . . . . . . . . . . . . . . . . 18
4.5. Conclusion. . . . . . . . . . . . . . . . . . . . . . . . . . . . . . . . . . . . . . . . . . . . . . . . . . . . . . . . . .19
5. Project Evaluation. . . . . . . . . . . . . . . . . . . . . . . . . . . . . . . . . . . . . . . . . . . . . . . . . . . . . . . . .21
5.1. Implication:. . . . . . . . . . . . . . . . . . . . . . . . . . . . . . . . . . . . . . . . . . . . . . . . . . . . . . . . .21
5.2. Limitation:. . . . . . . . . . . . . . . . . . . . . . . . . . . . . . . . . . . . . . . . . . . . . . . . . . . . . . . . . 21
Recommendations. . . . . . . . . . . . . . . . . . . . . . . . . . . . . . . . . . . . . . . . . . . . . . . . . . . . . . . . . . .22
REFERENCE. . . . . . . . . . . . . . . . . . . . . . . . . . . . . . . . . . . . . . . . . . . . . . . . . . . . . . . . . . . . . . 23
APPENDIX. . . . . . . . . . . . . . . . . . . . . . . . . . . . . . . . . . . . . . . . . . . . . . . . . . . . . . . . . . . . . . . . 25
APPENDIX A. . . . . . . . . . . . . . . . . . . . . . . . . . . . . . . . . . . . . . . . . . . . . . . . . . . . . . . . . . . 25
APPENDIX B. . . . . . . . . . . . . . . . . . . . . . . . . . . . . . . . . . . . . . . . . . . . . . . . . . . . . . . . . . . 28
APPENDIX C. . . . . . . . . . . . . . . . . . . . . . . . . . . . . . . . . . . . . . . . . . . . . . . . . . . . . . . . . . . 32
APPENDIX D. . . . . . . . . . . . . . . . . . . . . . . . . . . . . . . . . . . . . . . . . . . . . . . . . . . . . . . . . . . 43 3 1. Introduction
Most nowadays students are certain that part-time jobs are very easily accessible. It has
become a common case because of the training system in many universities in the form of
credit, so students can completely proactively arrange their schedule accordingly and still
perform to manage the working part-time well. Conspicuously that there are innumerable
reasons on what accounts for college students to choose to work part-time above other
activities to do in spare time. According to an article in 2021 on Studentloanhelpinfo.com,
not only because of increasing income but also helping students accumulate a lot of
experience, practical experience and expand their ability in social networks. Certainly that
part-time jobs are becoming the current trend because the market economy is strongly
competing, social knowledge and practical knowledge greatly affect students' ability to think
and work after graduation. Furthermore, the figure from a survey by Can Tho University
shows that there are 270 students out of 664 students working part-time so it is estimated
nearly 41 percent of students have part-time jobs during their studies. These proportions have
shown that partial employment at university attracts people's attention, especially in FMT -
Faculty of Management and Tourism’s undergraduates. With the result that, we make an
effort to inquire into this in our experimentation which concentrates on whether the
proportion of FMT’s students taking a part-time job is less than or equal to 41 percent.
Specifically, the compilation of this research's data was focused primarily on the collection
of responses to a designed questionnaire to determine the specific proportion of students
working part-time. Two primary statistical methods were used to investigate the data:
descriptive statistics and inferential statistics. Pie charts, bar charts, and other graphs were
used to visualize descriptive statistics, as well as inferential statistics such as sampling
method and hypothesis testing. After processing the data, the conclusion over ‘’the
proportion of FMT students taking a part-time job is more than 41 percent’’ was revealed and
it was, indeed, a good indicator for further recommendations and implications. 2. Research methodology 4 2.1. Population and sample
Presently, the number of students who are always looking for a part-time job while attending
university is increasing quotidian. Therefore, it is necessary to investigate the proportion of
students who take part-time jobs and its effects on them. The population of concern is aimed
at students of the Faculty of Management and Tourism (FMT) of Hanoi University. Due to
the limitation of time and cost to do a survey and analyze information for the entire
population, this survey is made with a sample of 112 students who were randomly selected
from FMT students of Hanoi University. 2.2. Questionnaire design
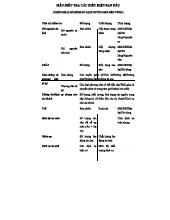
The approach to obtain information for this project is a questionnaire that included 13
questions related to the part-time jobs of FMT students, which is necessary for Hypothesis
testing, descriptive statistics in our project. For logical reasoning, the questionnaire is divided into 3 parts.
Part : To ensure the validity of the information observation, three personal questions about
name, ID number, major and academic year are required. Thus, another question added in
this part is to eliminate all the respondents who are not taking a part-time job. This part is in
charge of assembling inputs for the data process using R studio and Excel. 1. What is your full name? 2. Your student ID 3. Which year are you in? 4. Which major are you in?
5. Do you currently have a part-time job?
Part 2: Along with the report’s main purpose, we also pay attention to those who do not
work part-time to bring up the more incentive comparison.
6. When you are NOT working part-time, how does your GPA change over time?
7. Why don’t you take any jobs?
Part 3: This part contains questions to investigate further into the participation of part-time
workers of FMT at Hanoi University and collect data for observation and the hypothesis test.
The seven remaining questions have a specialized pertinence to the research topic.
Particularly, the eighth question is the cornerstone to indicate the most popular purposes for
working part-time FMT students. Furthermore, the combination of ninth to twelfth questions 5
deliver information about the learners’ effort over the part-time job requirements. Besides,
the degree of willingness to take a part-time job of FMT’s students is a really active factor
for report finding which clearly shown in question thirteenth. Finally, the responses of
whether part-time work outcomes have a negative or positive impact on students’ general
performance or not, quoted in the last question. Briefly, these questions are surveyed with the
expectation of collecting useful and realistic information for survey and evaluation.
8. If you are working, what are your main purposes?
9. Does the job relate to interest/major?
10. How much time do you spend on your job in 1 day?
11. Have you gained any soft skills?
12. Are these soft skills advantageous to your academic performance?
13. Level of your agreement in taking a job?
14. When you are working part-time, how does your GPA change over time? 2.3. Sample Size
In a broader sense, a sample is a manageable subset of the population that demonstrates
extremely succinct criteria for population characteristics. As a result, selecting sample size
necessitates not only full attention but also caution on the study area based. We chose a
population size equal to over one hundred to avoid a number of self-consciousness in
collecting data from a larger population size. Such an astronomical population (in thousands
of examples) posed many obstacles to its approach. After the benchmarks, the larger the
sample size, the higher the accuracy of the test when the sample size is asymptotic to the
population. Therefore, we decided to select a sample of 112 students of the Faculty of
Management and Tourism. For checking the assumption in the hypothesis test, when
population standard deviation is known, and the sample distribution is approximately normal
following theCentral Limit Theorem with large sample size: n=112, which is greater than 30;
z-test is applicable to evaluate part-time jobs effects on FMT’s undergraduates. 2.4.
Sampling method and data col ection a. Sampling method
In order to collect a relatively accurate result for this test, a simple (with alternative) random
sampling method is used to ensure that all students of the FMT had an equal chance to be 6
selected in the template the sample is not randomly selected, the results may be biased
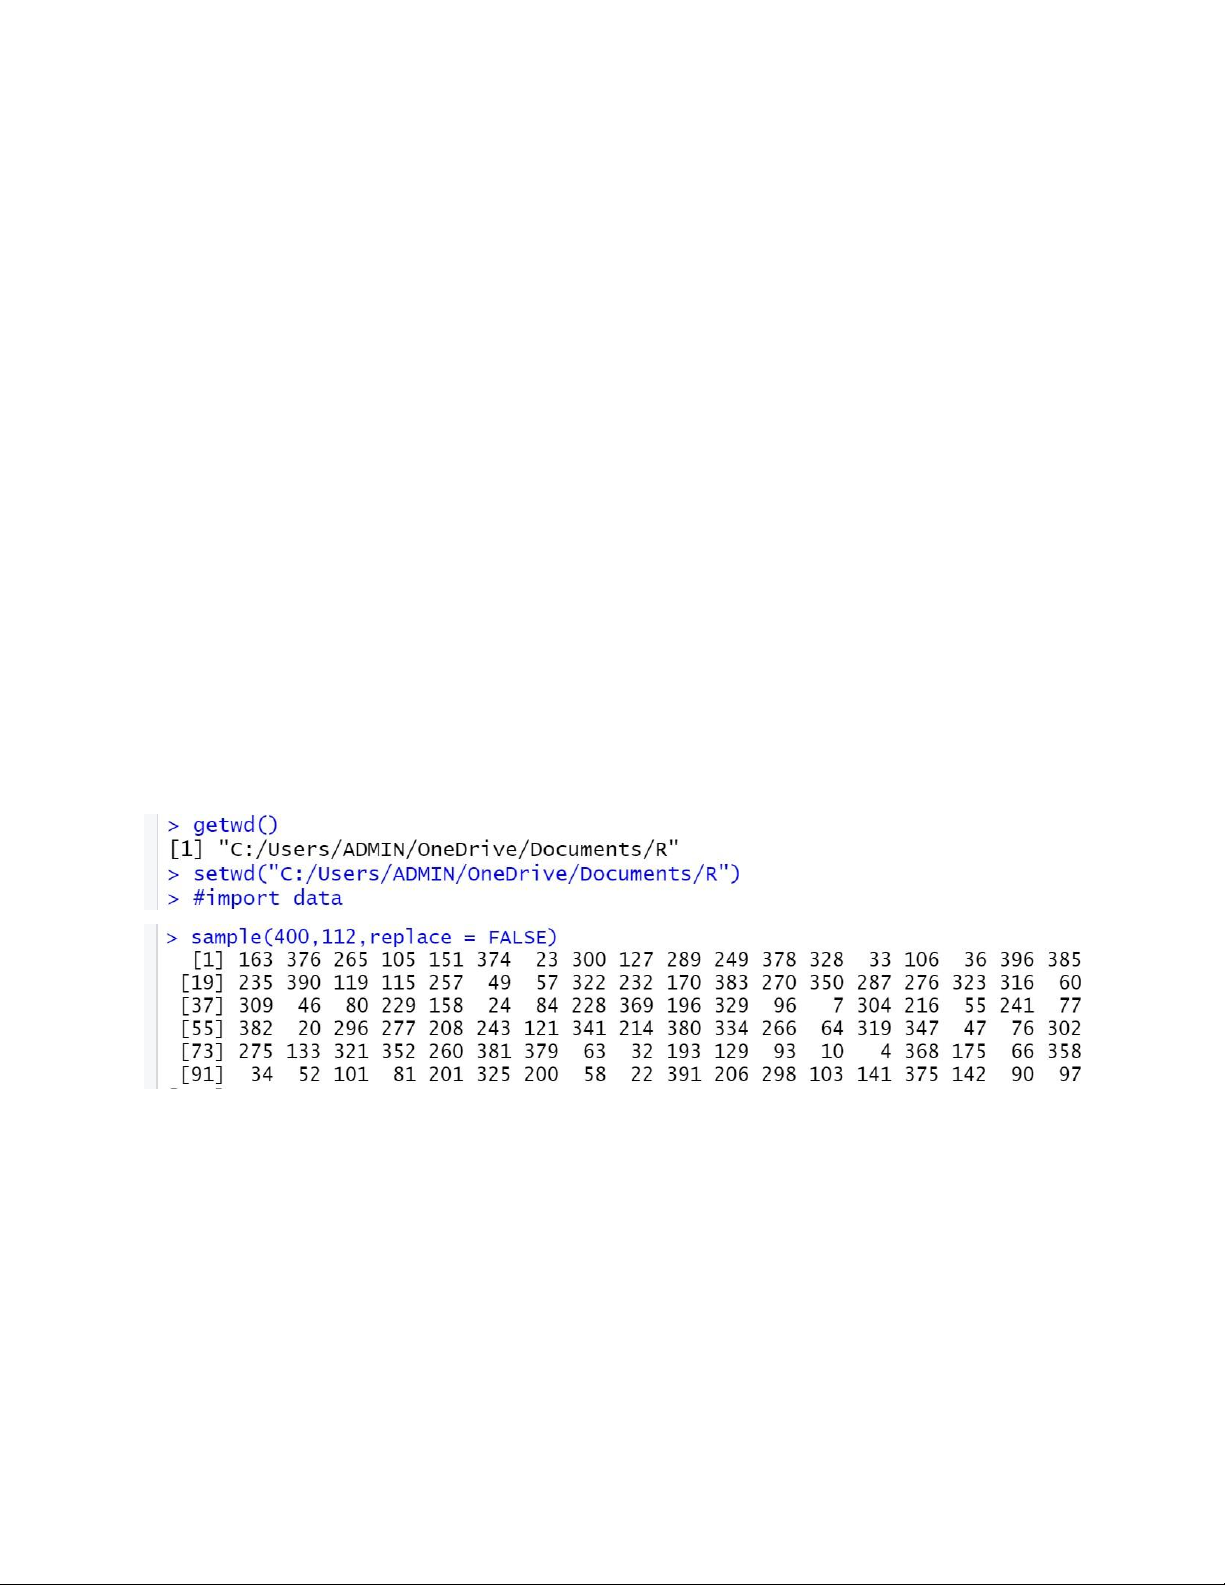
resulting in some error. We used RStudio to select a random sample of 112 students.
Step 1: Obtaining a list of population members.
Step 2: Numbering the list from 1 to 400 (population size) and applying this code:
x<-seq(1,400,1) for defining the sequence of 400 numbers (population size)
Step 3: Using R labs with this code:
Sample (x, size=112, replace=T)
x: a vector of one or more elements from which to be chosen
size: the number of items to be chosen (sample size= 112)
replace: specifies whether we want sampling with replacement (TRUE) or without replacement (False).
If this code is rerun m times then m definitely different samples of 112 variables will be
received. This is called a random sample. b. Data collection
We began our survey by distributing the questionnaire after we had finished proposing the
questionnaire and selecting the sample size. The information in this report was gathered
through a survey conducted among Hanoi University students from the Faculty of
Management and Tourism, that completed an online questionnaire designed by
googleform.doc. Team members contribute to teamwork by sending randomly FMT students
to fill out the online questionnaire and decide to close the form when received about 400
responses with acceptable quality. The decision of closing the form at the size of 112 is in
order to refrain from a number of difficulties in collecting data from a larger population
versus the low rate of responding. Literally, online data collection is a viable way given the
various advantages of online research such as saving time, saving human resources, and
easier way to export data. Furthermore, because FMT undergraduates were in a "rush hour"
of deadlines (projects, assignments) for a variety of subjects, the dilution of conducting
indirect surveys was unavoidable. After an in-depth group discussion, a form-closing agreement was conducted. 2.5. Data processing:
Performing the calculation procedure quickly and accurately, two main techniques, Rstudio
and Excel, were carried out. Specifically, the R technique has been applied to select random 7
samples and test assumptions (chart and QQ chart) by collecting the codes, listed in the
Appendix. For the sake of the organization along with recovery data, Excel is a popular
choice. To input and process the data in Rstudio and Excel, we followed steps:
Step 1: Collect the data output from Google form.
Step 2: Download and change to form of xlsx.
Step 3: Fix column ‘Name’ to make sure that there is no symbol of space, number or special character.
Step 4: Output fixed data and transfer to the form of CSV UTF-8.
Step 5: Use read.csv to read file csv. 2.6.
Significance level of test:
The significance level for a given hypothesis test denoted as alpha or reflects the quantity of
reasonable error or the possibility of rejecting a true null hypothesis. It is also known as the
Type I error outcome. The significance level in this study was set at 0.05 because it is the
standard level of significance in social research and with the small sample size in comparison
to the population size. As a result, the confidence level is equal to 95%.
3. Descriptive results and Findings
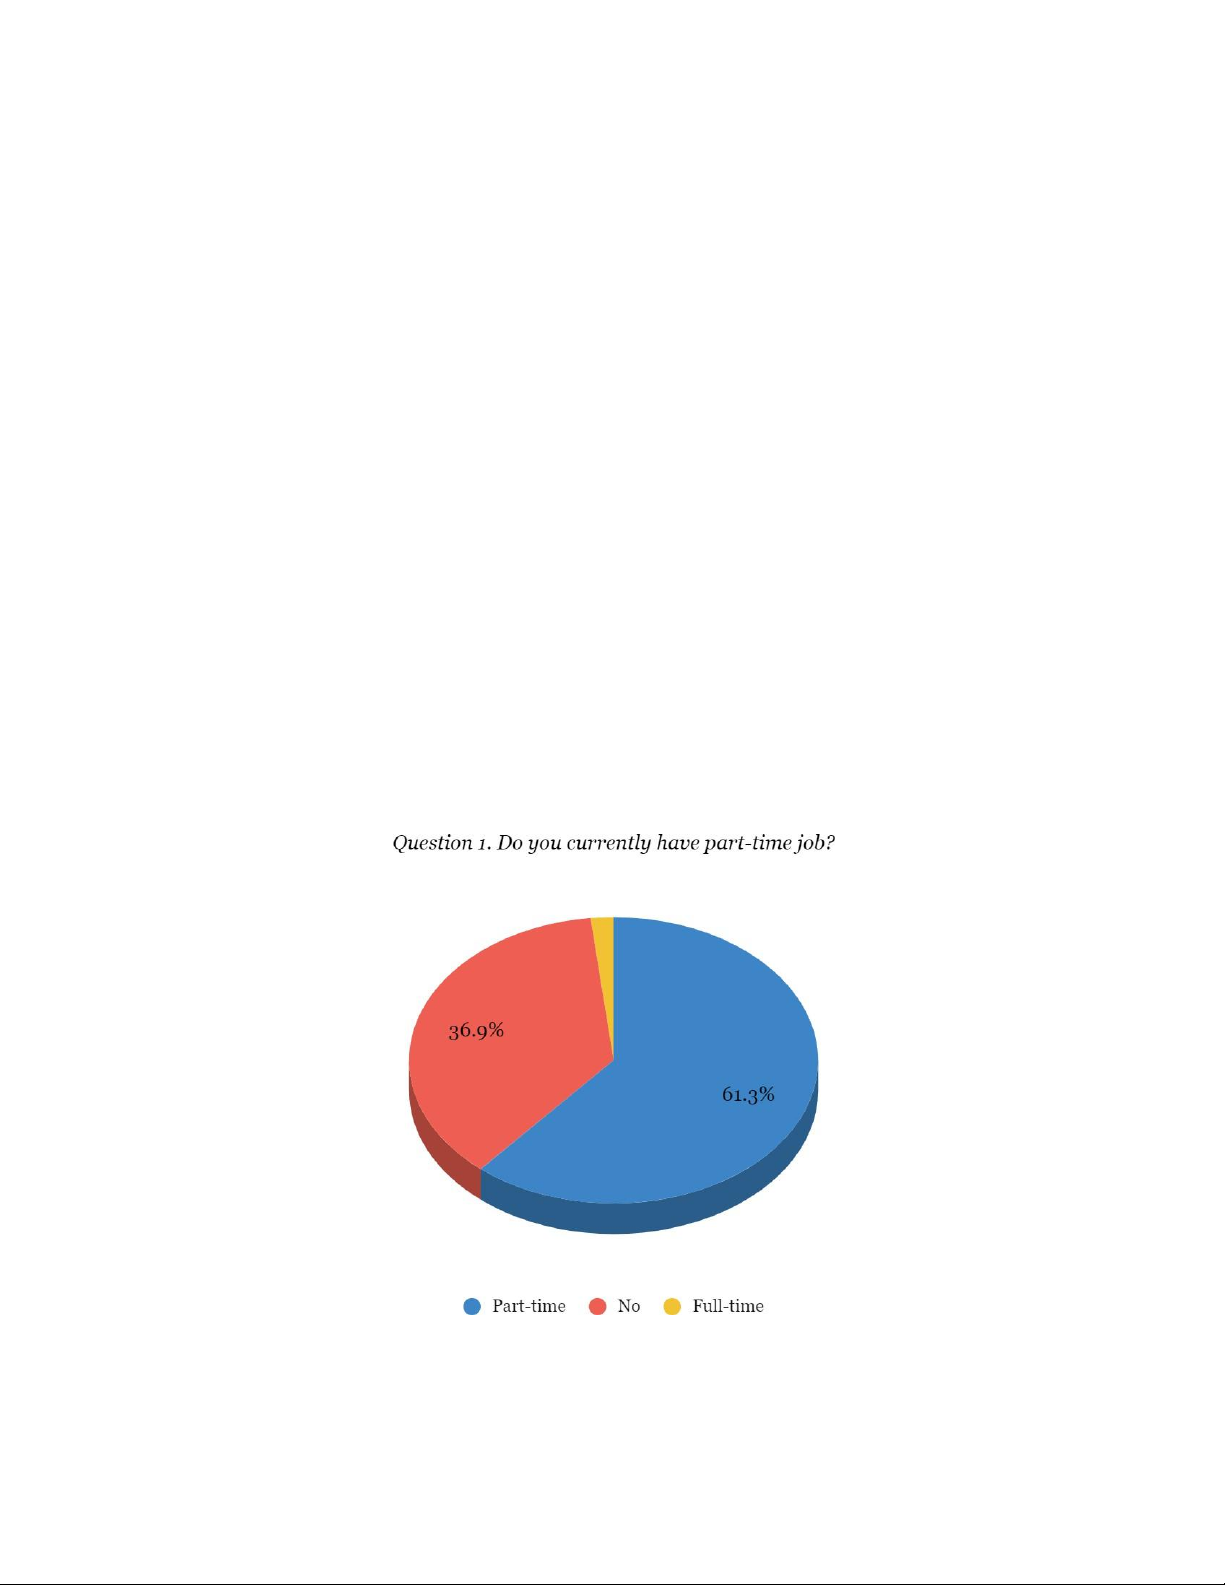
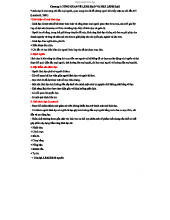
Figure 1: The proportion of FMT students having a job 8
With the goal of finding out whether part-time jobs for students affects the quality of learning
or not, we approached by asking a question to divide the students answered into two different
groups are working and not working; in which the working group is subdivided into full-time
and part-time working. As a result, we got the answers based on the 112 students selected in
our sample to indicate the percentage for each group. It can be seen that the percentage of
working people is the majority with 63.1% (61.3% part-time and 1.8% full-time), almost
double the rest of the group who do not work with 36.9%.
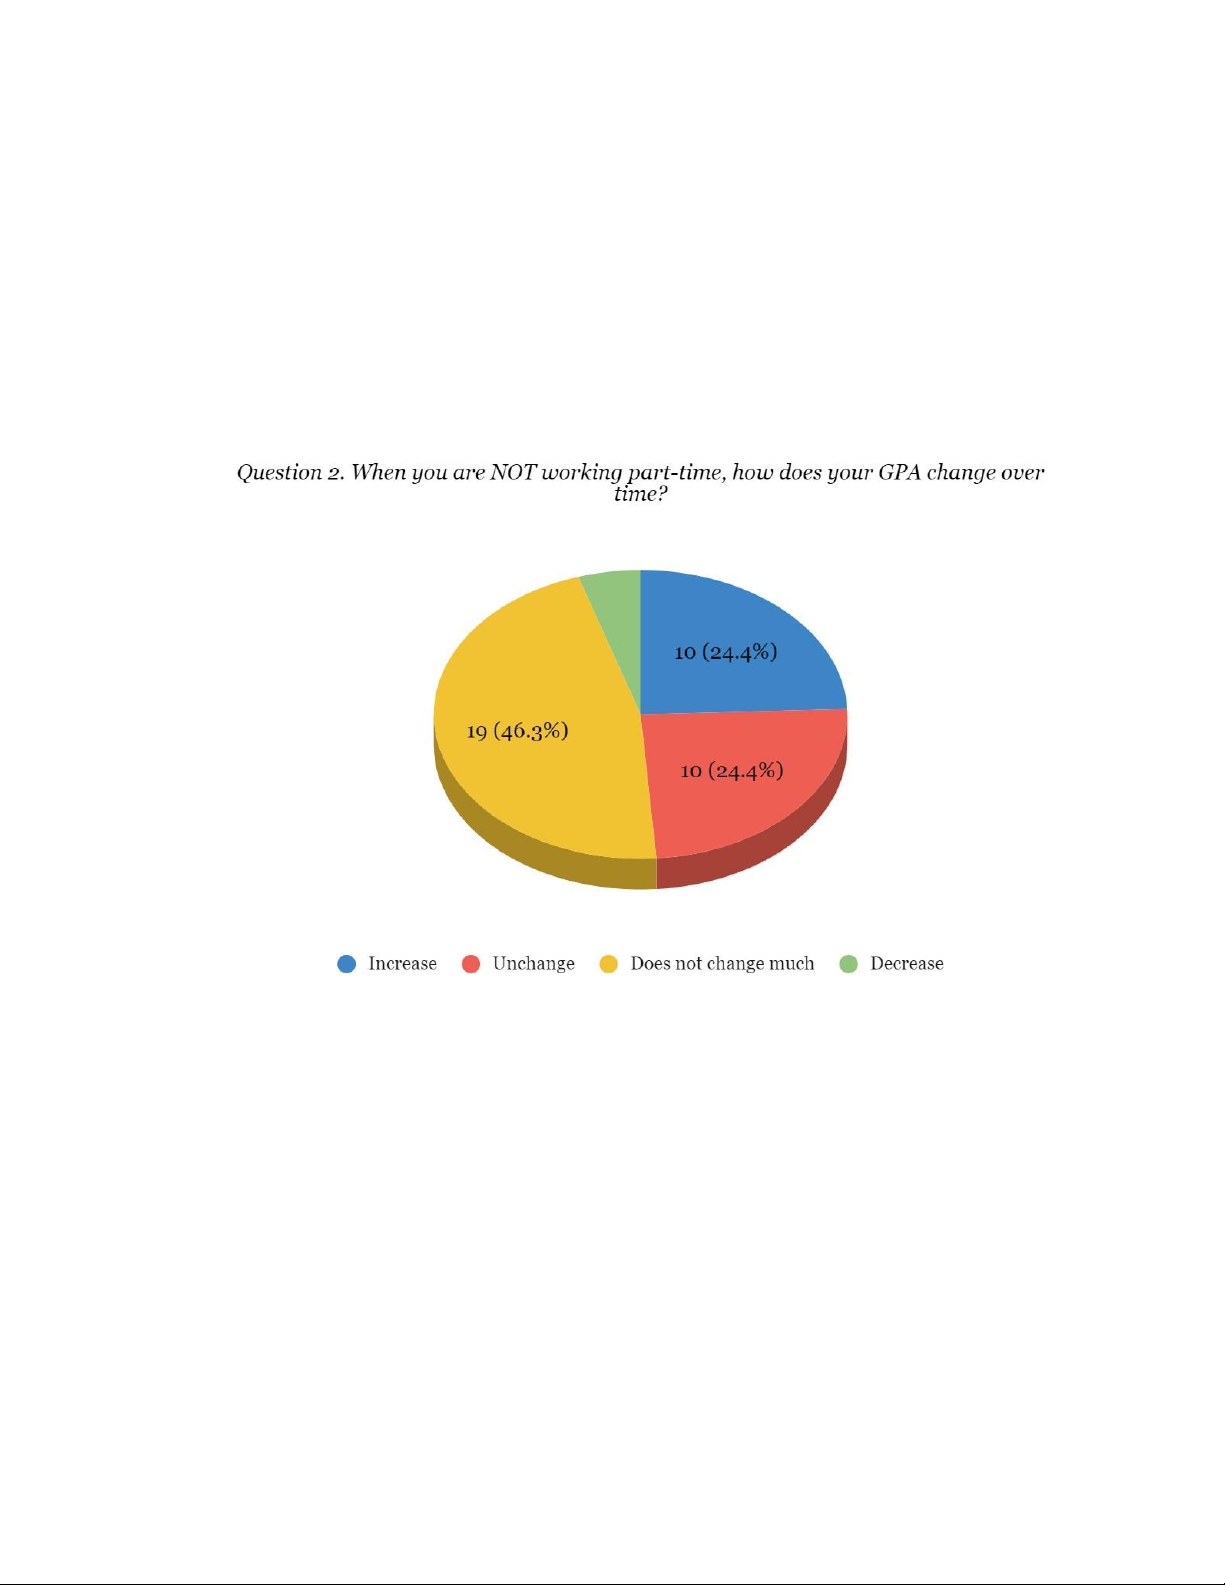
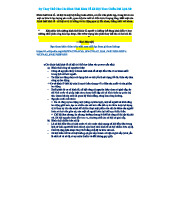
Figure 2. The change in GPA when students NOT having a job
Question 2 we just asked students in the non-working group with 41 respondents to
investigate how their GPA changes over time when they are not working and study is their
main concern. The results indicated that 29 respondents (more than 70%) answered that their
GPA had not changed or had changed but not significant, 10 respondents answered that their
GPA increased and the remaining 2 respondents answered that their GPA decreased. 9
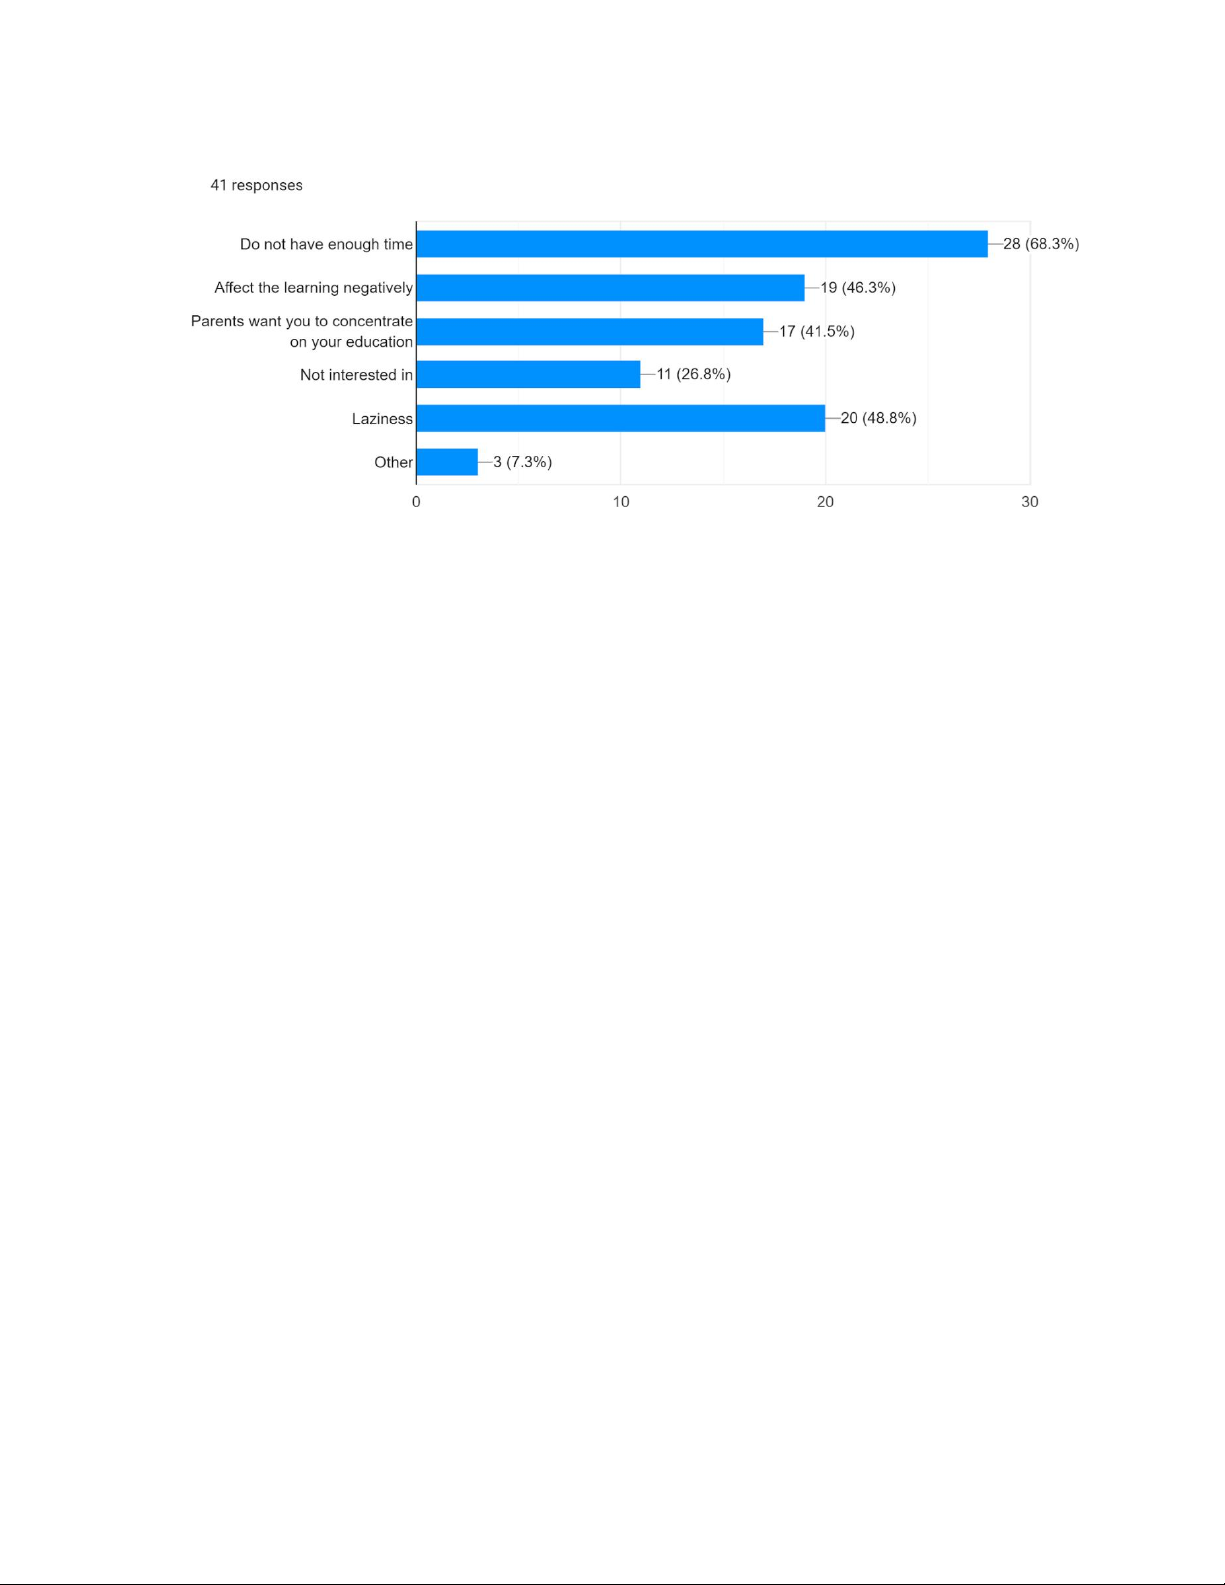
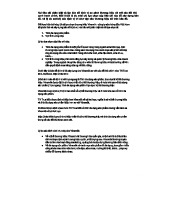
Figure 3. The reasons that FMT student not taking a job
As question 2, question 3 is only for students in the group of students who are not working to
find out the biggest reason why they are not working full-time or part-time. To answer this
question, students can choose from the many options we've prepared in Google Forms.
Results from 41 respondents show that the biggest reason is “Do not have enough time to
take a job?” with 28 out of 41 votes. Laziness and afraid of affect the learning negatively as
the second biggest reason with 20 and 19 votes, respectively. There were 17 votes for Parents
want you to concentrate on your education and 11 votes for Not interested in taking a job.
Three votes said that the reason they did not work came from other reasons. 10
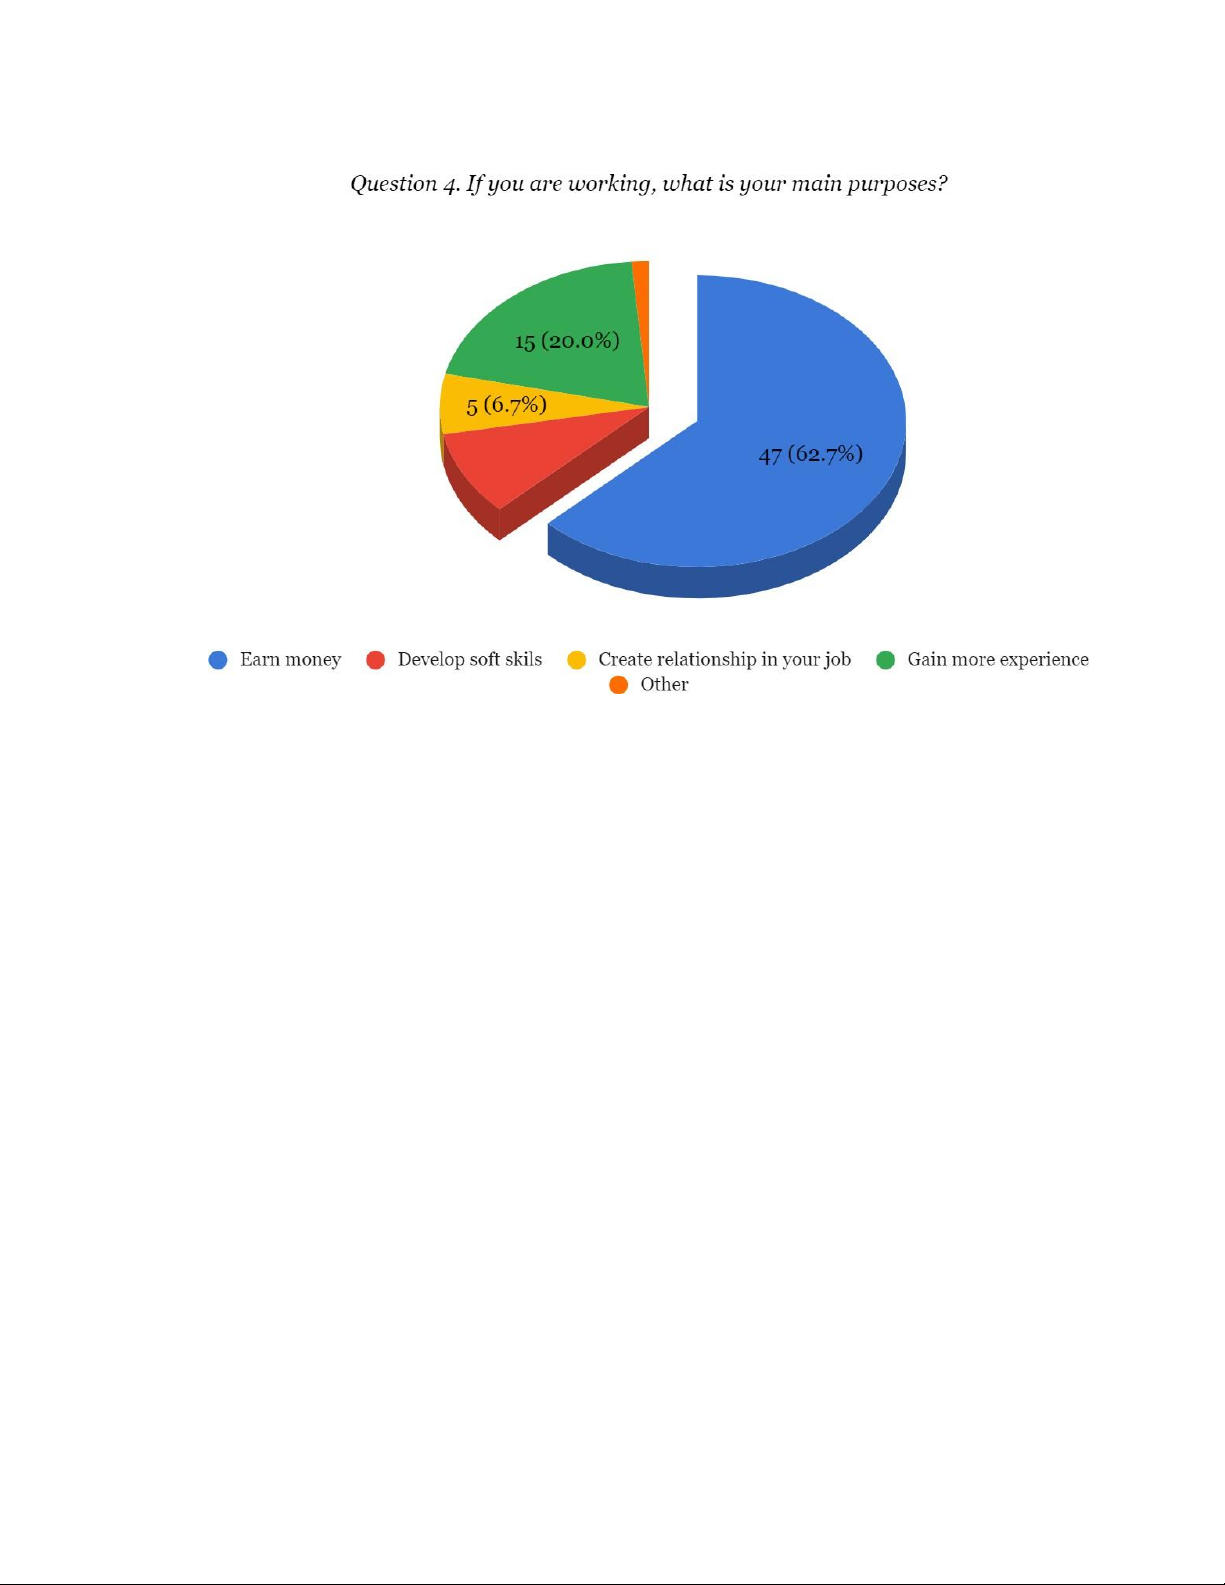
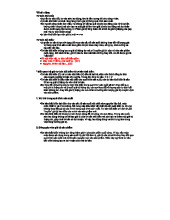
Figure 4. The main purpose of working full or part time of FMT students
In our form, questions 4 to question 10 are designed to ask students in the working students
group. First, question 4 was asked to find out what is the biggest purpose of FMT students in
the workplace. The results after submitting questions to 71 respondents show that the main
purpose of FMT students when going to work is to earn more personal income with the
majority of students answering (47 out of 71 respondents, accounting for 62.7% ). There
were 15 students participating in the survey who said their main purpose was to gain more
experience, 7 other students said their main purpose was to develop their soft-skill. Only a
few people said that their purpose was to create a relationship and only 1 person had a
different purpose when working. 11
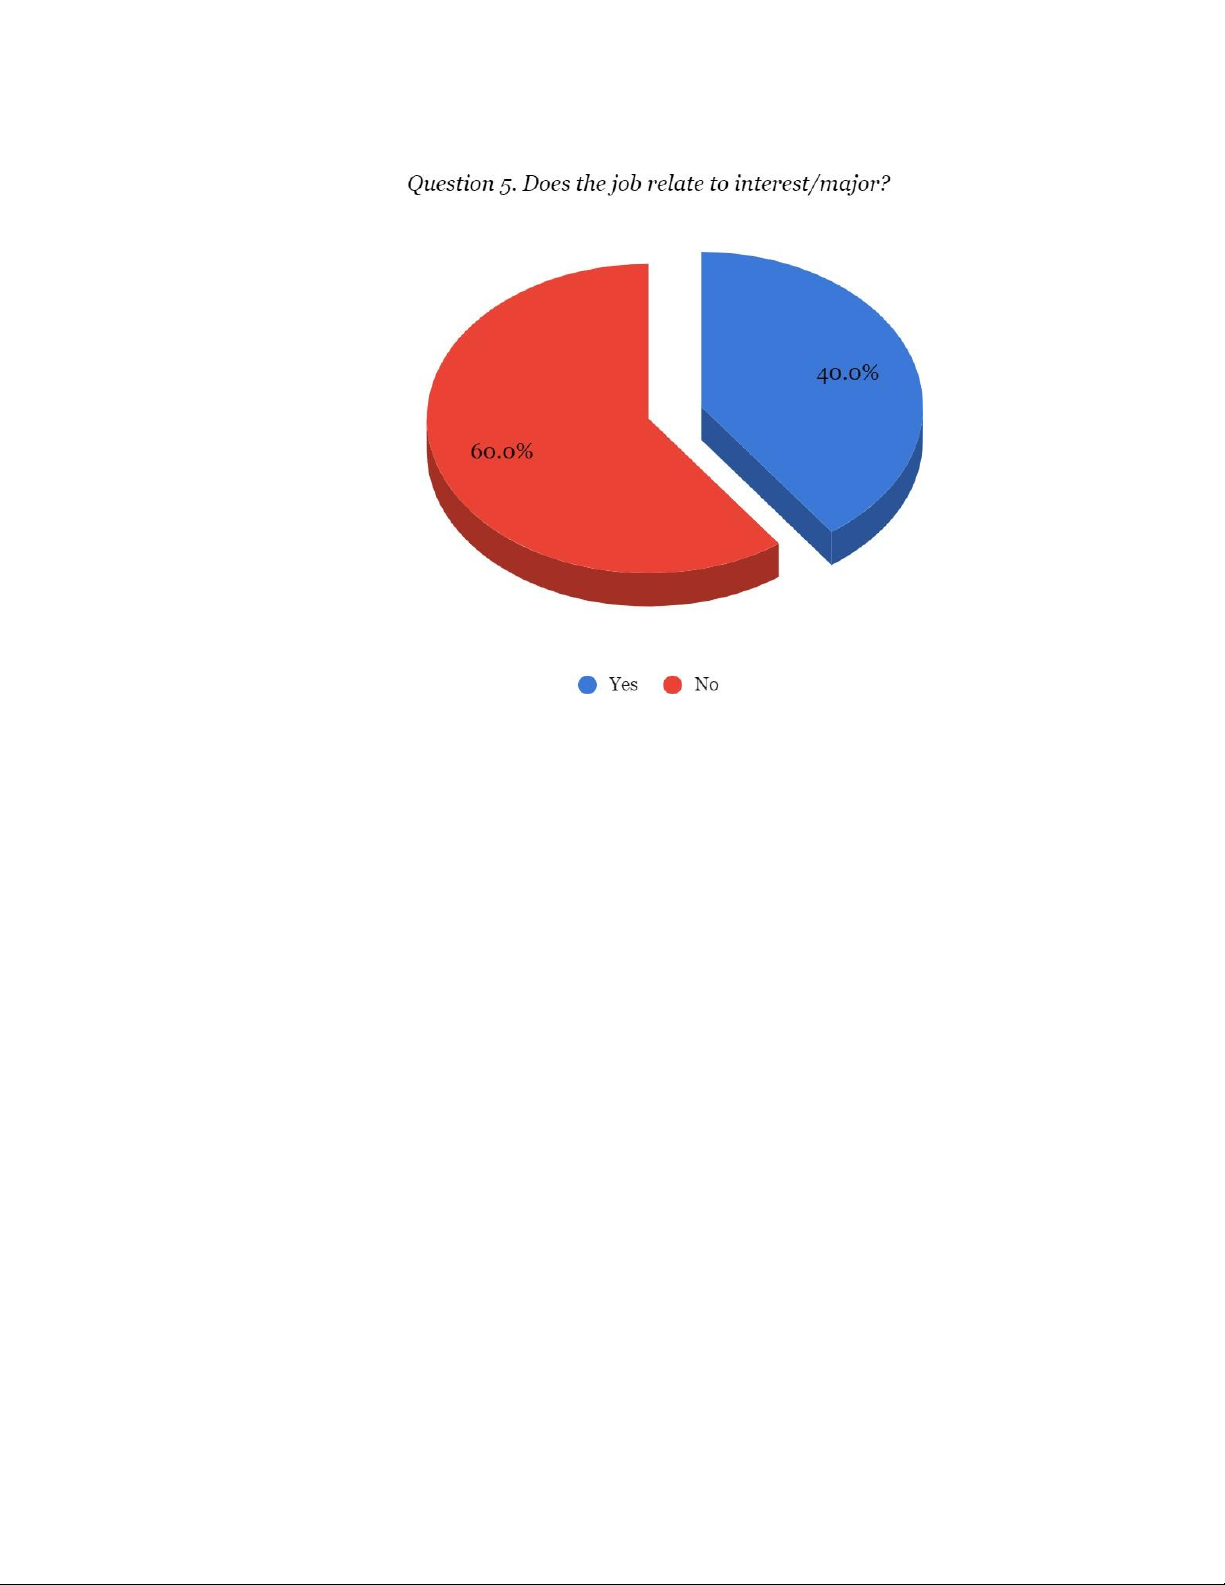
Figure 5. The proportion of students whose work is related to the major
In the next question, the type of club relating to their major or not has witnessed an
interesting scenario which is the number of students working on a job that not relating to
their major (60%) outweigh that relating (40%). This is understandable because almost all the
jobs that related to FMT students' major require experience; and most of the respondents
were just sophomores, so the experience was almost zero. 12
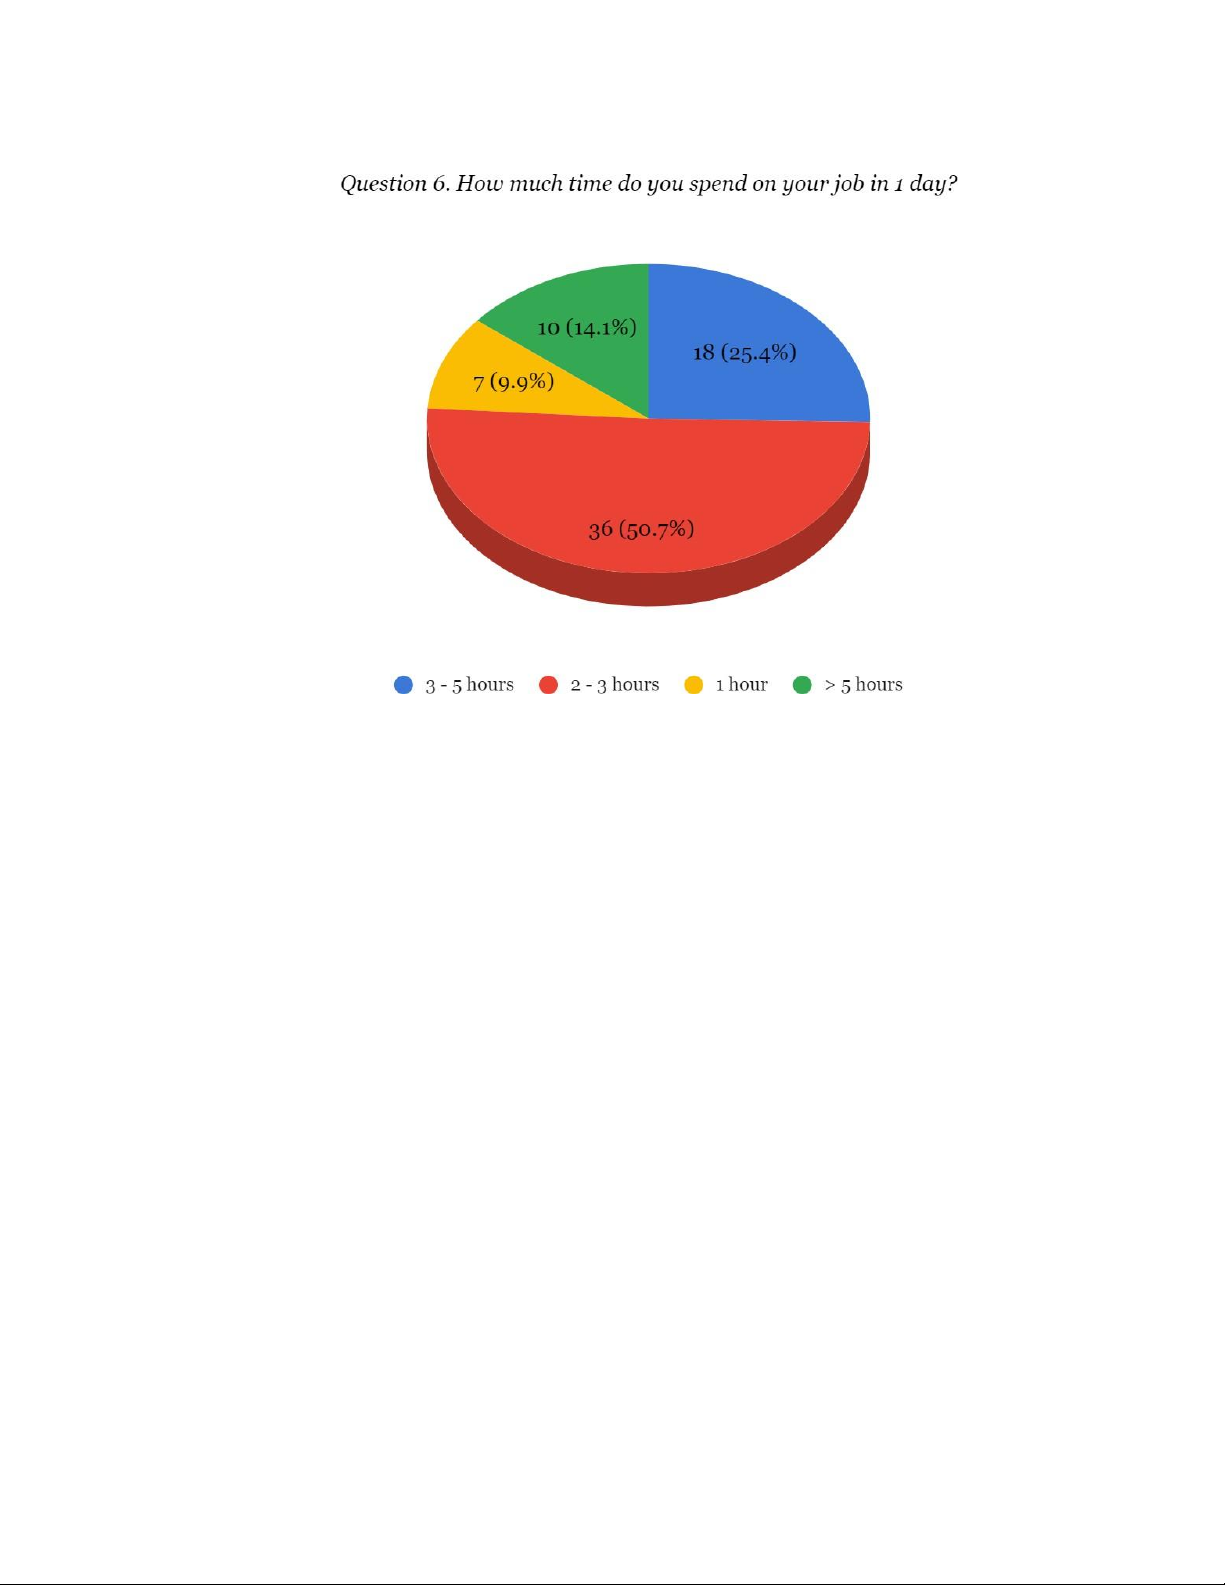
Figure 6. Number of working hours of FMT students in one day
Question 6 is asked to find out how many hours a day FMT students work. Half of the
respondents said they worked 2-3 hours a day (36 students), double the number of students
working 3-5 hours a day (18 students). Ten students reported working more than 5 hours a
day and 7 students working about 1 hour a day. This can be explained by the reason that part-
time jobs have very different working hours depending on the industry. It ranges from 1 to 5
hours per day or even more. And full-time work requires students to work 8 hours a day. 13
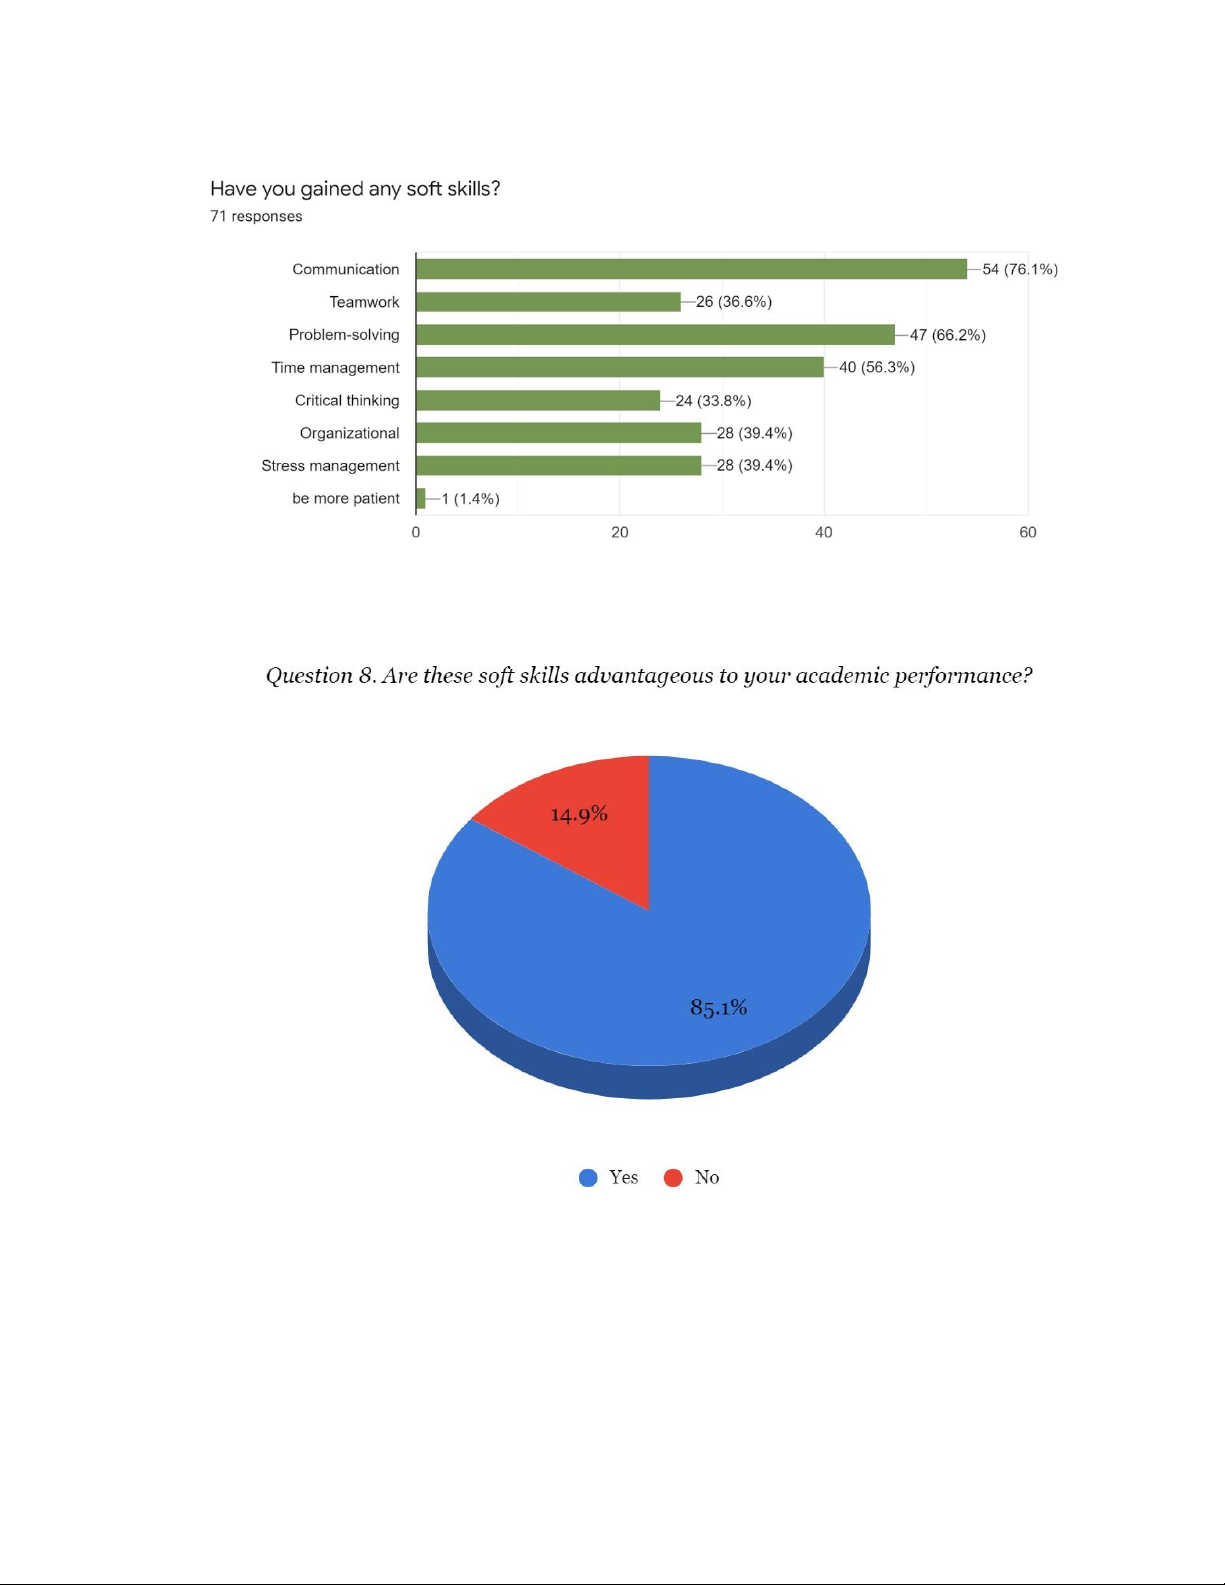
Figure 7. Soft skills gained when FMT students working
Figure 8. The percentage of students who find the above soft skills beneficial for learning
The purpose of question 7 and 8 is to find out if, in the course of working, students receive
any other value that is useful to themselves other than the main purpose outlined above. We
have decided that the most visible value is soft skills. To answer this question, the respondent 14
will select the items we have provided or can add to the Other. The results showed that in the
working process, the student gained many important soft skills. The three most important
skills chosen by the respondents are communication skills, problem-solving skills and time
management skills with more than 40%. Some other soft skills are also selected by about
20% - 30% of the respondents that are teamwork, critical thinking skill, organizational skill
and stress management skills. Moreover, one respondent said that when they go to work, they
can even learn how to be more patient. The above soft skills are believed to be effective for
learning by more than 85% of students. The rest said that these skills are not so effective for
learning. Maybe the remaining 15% are students having a job that is unrelated to their major.
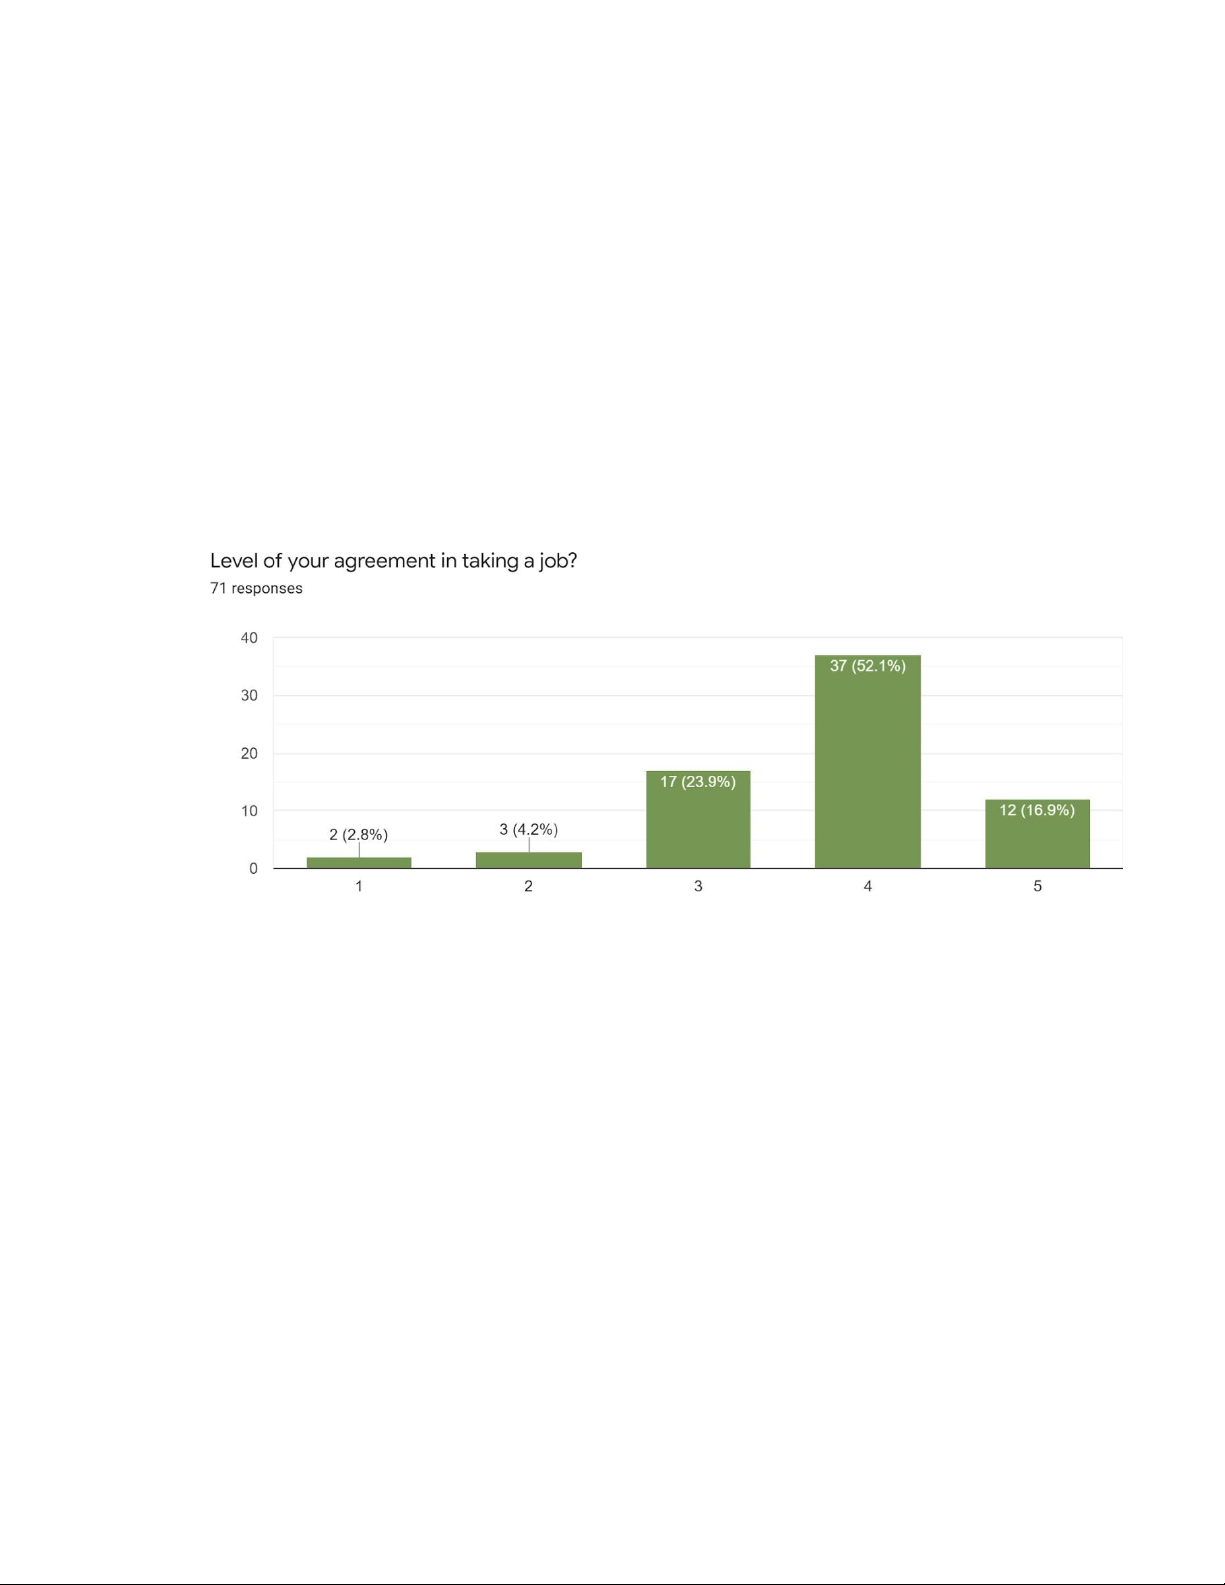
Figure 9. Level of FMT students’ agreement in taking a job
This question was given to FMT students in order to evaluate their agreement in taking a job
from 1 to 5 (Very poor to very good). More than a half of 71 students claim that their
agreement in taking a job is above the middle scale which is pretty positive. Indeed, If we
have an objective look about the benefits students receive when they go to work, not just
money or experience but also new relationships, new skills, . . and even more if a student has
a job related to his or her major. Furthermore, 12 out of 71 respondents (more than 16%)
choose the maximum agreement. Only a very small percentage of students do not agree with their job or working status. 15
Figure 10. The change in GPA when students having a job
Of the 71 respondents, more than two thirds (53 students) stated that their GPA did not
change or did not change significantly. Even up to 15 students (accounting for more than
20%) said their GPA increases when they have a job. Only a very small number of the
remaining students reported a decrease in their GPA. These statistics can absolutely prove
having a job has no effect on GPA, or it has only a very small impact that mainly comes from the students themselves.
4. Results and Findings of the Hypothesis Test:
One of the two most popular forms of statistical inference is the test of significance
(hypothesis testing). Its purpose is to evaluate the evidence presented by sample data in
support of an argument (hypothesis) about a population. The authors' main goal in this study
is to perform the hypothesis test that is described below. 4.1. Research question
As previously stated, a test of significance is a standard method for comparing observed
evidence with an argument whose validity is being evaluated. An argument is a declaration
about a metric, such as the population proportion p or the population mean μ. As this 16
research question is: “Is the proportion of FMT’s students taking a part-time job less than or
equal to 41 percent?”, the type of the test is obviously a right-tailed test for population
proportion. Normally, the data received from the survey is certainly quantitative data and the
proportion was estimated through a random sample of FMT’s students.
According to the data we gathered from the questionnaire of the qualitative and objective
category of the study, the population proportion method was chosen to examine the
percentage of students working part-time during their studies. Mainly, the parameter of
students taking a part-time job is p0, the estimated score of this parameter is p.
- Question: Is the proportion of FMT’s students taking a part-time job less than or equal to 41 percent ? - Data analysis: Right-tailed test Sample size: n = 112
Number of FMT students working part-time: x = 69
Sample rate: p̂ = x/n = 69/112 = 0.62
Significance level: α = 0.05 4.2. Checking assumption
The variables are qualitative with two categorical outcomes ( “YES” and “NO”).
Population follows a Binomial Distribution.
The sampling distribution of p̂ is nearly Normal
n�o = 112 * 0.41 = 45.92 > 5
n(1 –�o) = 112 * (1 – 0.41) = 66.08 > 5 17 4.3. Hypotheses formulation
From the research question: “Is the proportion of FMT’s students taking a part-time job less
than or equal to 41 percent?” , two hypotheses were determined.
Ho: The proportion of FMT students taking a part-time job is less than or equal to 41 percent
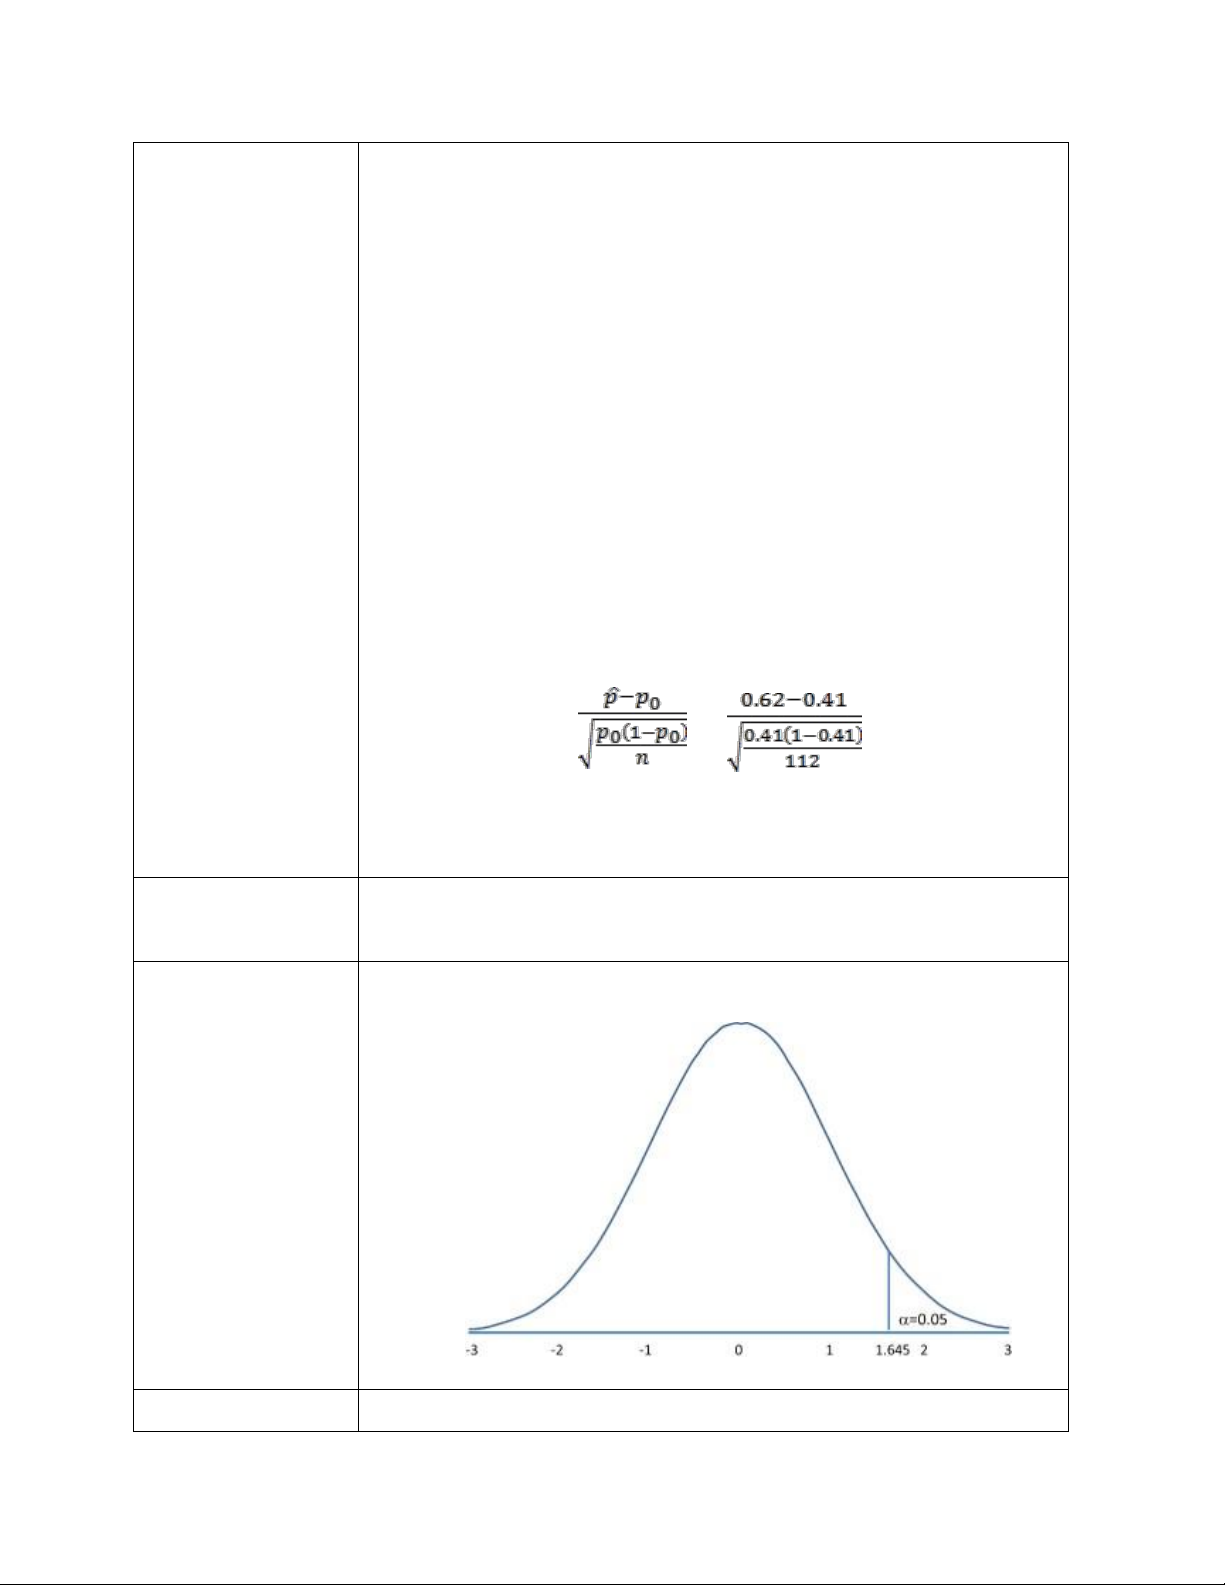
Ha: The proportion of FMT students taking a part-time job is more than 41 percent Ho : p ≤ 0.41 Ha : p > 0.41 (upper-tailed Test) 4.4. Rejection region Test statistics: Z* = = = 4.52 a. P-value
Since the value of Z in the test statistic is out of the bell-shape, the p-value is nearly equal
to zero. So, we use Rstudio to calculate the exact value of p.
From the above result, we found that the p-value is 0.000005 < α (0.05). The p-value is
very small, so we reject the null Hypothesis (Ho). b. Critical value:
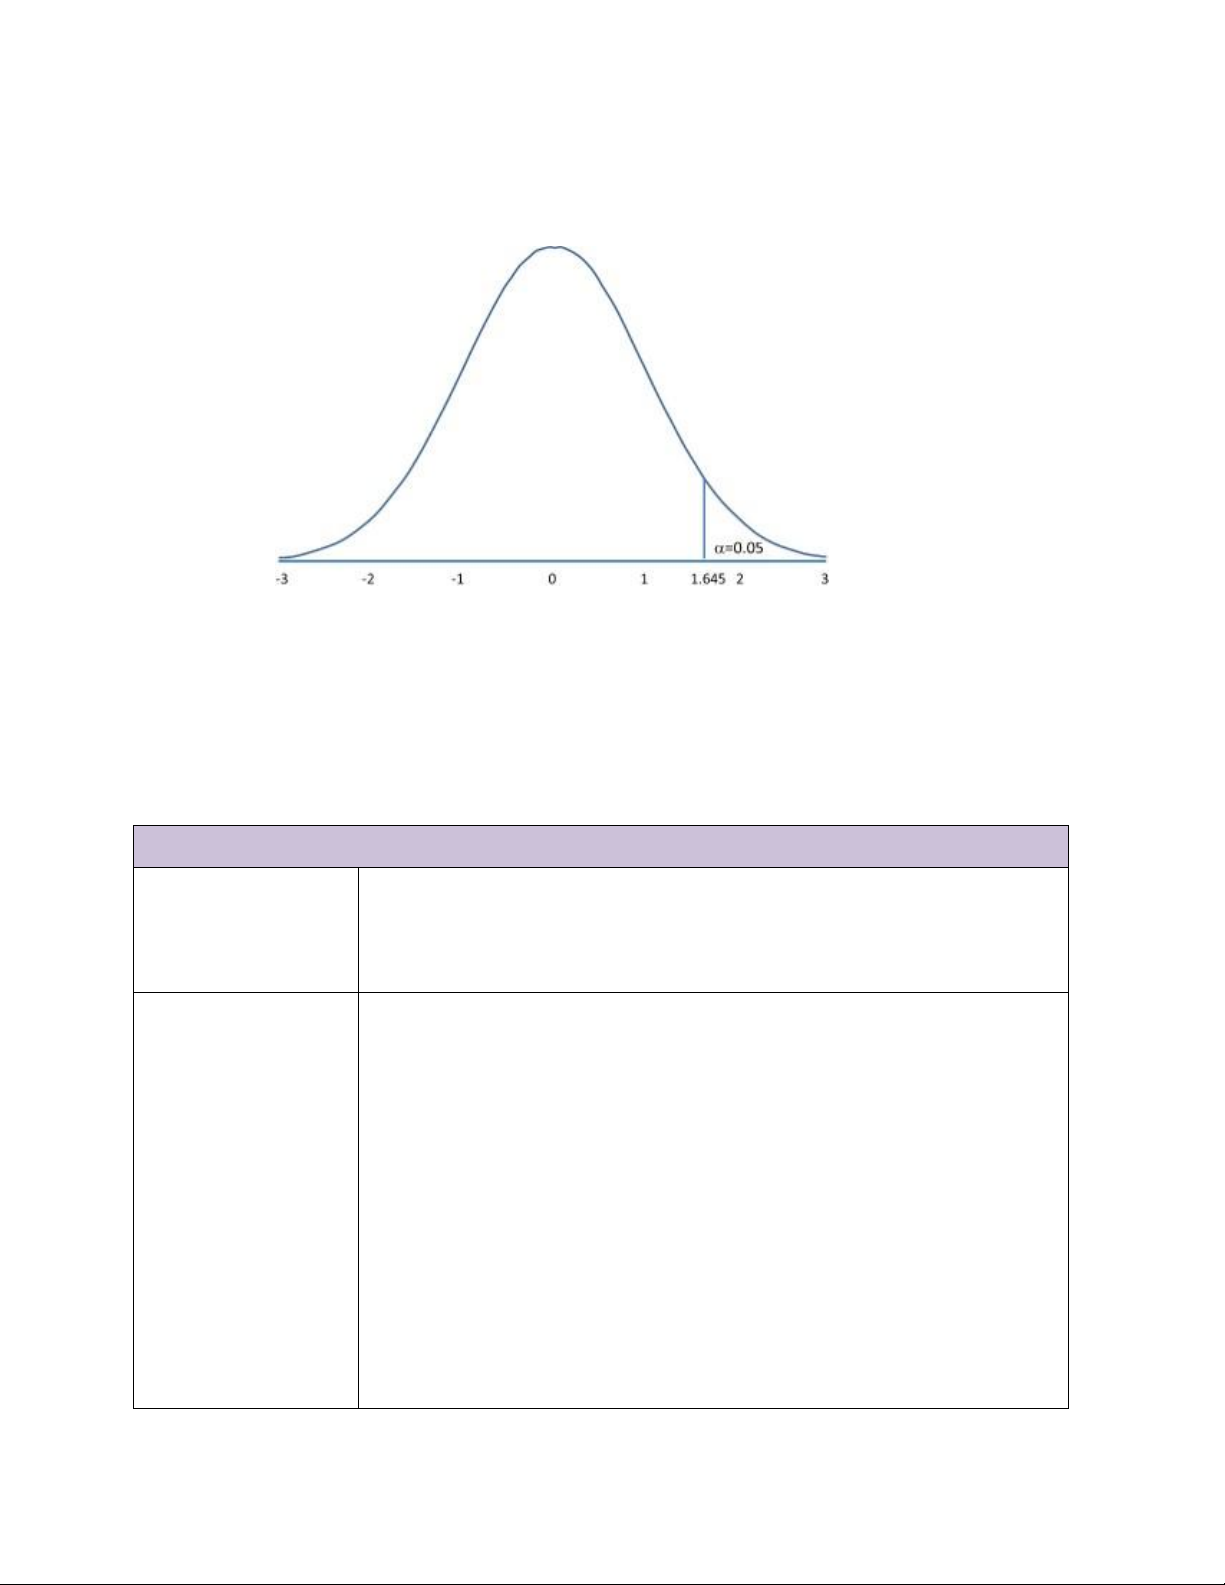
Level of significant: α = 0.05 => Zα=1.645 18 Explanation: Zα= 1.645
Z* > Zα (4.52 > 1.645) then reject the null Hypothesis (Ho) 4.5. Conclusion
There is enough evidence at the level of significance of 0.05 to conclude that the proportion
of FMT students taking a part-time job is more than 41 percent. SUMMARY OF HYPOTHESIS TEST
Hypothesis Tests – Population Proportion 1. Hypothesis H0 : p ≤ 0.41 Ha : p > 0.41 (Upper-tailed Test) 2. Test Assumption: Statistic
The variables are qualitative with two categorical outcomes ( “YES” and “NO”).
Population follows a Binomial Distribution.
The survey consists of a sequence of 112 identical trials –
FMT’s students, with each trial corresponding to a different student's answer.
Each trial has two possible outcomes: “YES” is a success and “NO” is a failure.
The probability of “YES” and the probability of “NO” do not 19
change from trial to trial, with p = 0.5 and 1 – p = 0.5.
The trials are independent as the choice of students does not affect others.
Normal Approximation to The Sampling Distribution Can Be Used by
The sample size is large enough: 112 > 30
Sample proportion for FMT’s students saying YES is: p̂ =69112 = 0.62
n 0 = 112 * 0.41 = 45.92 > 5
n (1 –�0) = 112 * (1 – 0.41) = 66.08 > 5
➔ The sampling distribution can be approximated by a normal
distribution. Therefore, all the assumptions are realized for doing the Z-test for proportions. We have: Z* = = = 4.52 3. Level of significance α = 0.05 => Zα = 1.645 4. Rejection
Reject the null Hypothesis (Ho) because Z* > Zα (4.52>1.645) Rule 5. Conclusion
There is enough evidence to conclude that there are more than 41% 20
Tài liệu liên quan:
-
Khảo sát các tiêu chí điều tra mô hình du lịch bền vững
14 7 -
Tổng hợp kiến thức về Nghệ thuật Lãnh đạo và Kỹ năng Thuyết phục
19 10 -
Sự Thay Thế Của Các Hình Thái Kinh Tế Xã Hội Qua Các Thời Đại
16 8 -
Phân Tích So Sánh Định Vị Thương Hiệu Theo Mô Hình CBBE (MKT001)
22 11 -
Khái Niệm Về Tư Bản Bất Biến và Khả Biến Trong Kinh Tế (CT101)
26 13