Probability and statistics môn Xác suất thống kê| Trường Đại học Ngoại Thương
Statistics provides principles and methodology for designing theprocess of: •Data Collection •Summarizing and Interpreting the data. Tài liệu giúp bạn tham khảo, ôn tập và đạt kết quả cao. Mời đọc đón xem!
Môn: Xác suất thống kê (FTU) 355 tài liệu
Trường: Trường Đại học Ngoại Thương 1.1 K tài liệu
Tác giả:


Preview text:
PROBABILITY AND STATISTICS
Lecture 1: Organization and description of data Lecturer: HồTœ Bảo
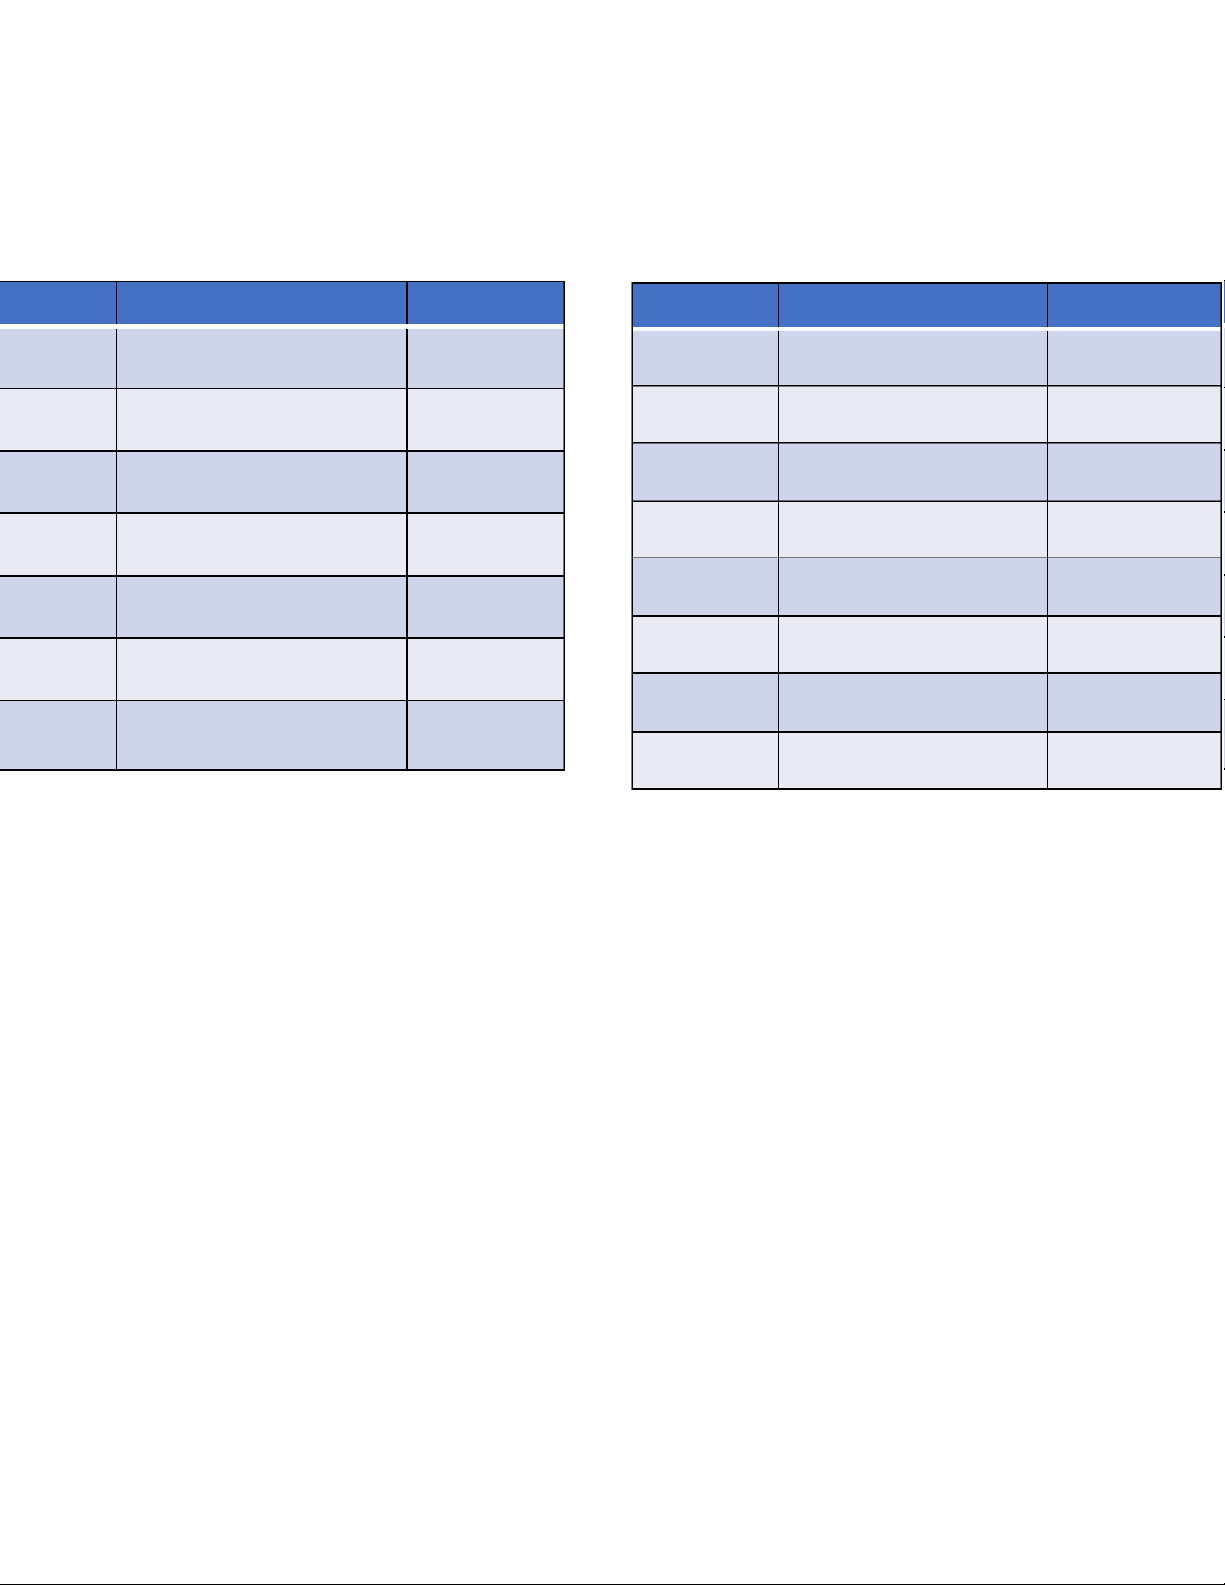
Teaching assistant: V› Thảo 1 What we are going to learn? Lectures Topics When Lectures Topics When Lecture 1 Digital transformation? May 9 Evaluation1 Lectures 2-7 June 1 Business Analytics? 9:20-11:45 14:50-17:10 Lecture 2 Organization and May 12 Lecture 8 Estimation June 6 Description of data 9:20-11:45 9:20-11:45 Lecture 9 Hypothesis testing June 8 Lecture 3 Bivariate relationship May 16 9:20-11:45 14:50-17:10 Lecture 10 Analysis of Categorical June 13 Lecture 4 Probability May 18 Data 9:20-11:45 14:50-17:10 Lecture 11 Comparing Two June 15 Lecture 5 Probability Distributions May 23 Treatments 14:50-17:10 9:20-11:45 Lecture 12 Analysis of Variance June 20 Lecture 6 The Normal Distribution May 25 (ANOVA) 9:20-11:45 14:50-17:10 Evaluation 2 Lectures 8-12 June 22 Lecture 7 Sampling Distribution May 30 14:50-17:10 9:20-11:45 Final June 27 examination 9:20-11:45 @Statistics, Lecture 1 2 Textbook Statistics: Principles and Methods Richard A. Johnson and Gouri K. Bhattachryya @Statistics, Lecture 1 3 Part 1. Introduction 1. What is statistics ? 2. Population and sample
3. Main objectives of statistics 4. Lecture Statisstics @Statistics, Lecture 1 4
Trend of the big three sports in the US Sport 1990 1981 1972 1960 1948 Football 35% 38% 36% 21% 17% Baseball 16% 16% 21% 34% 39% Baseketball 15% 9% 8% 9% 10% Others 33% 37% 35% 36% 34% (Gallup Opinion Index) @Statistics, Lecture 1 5
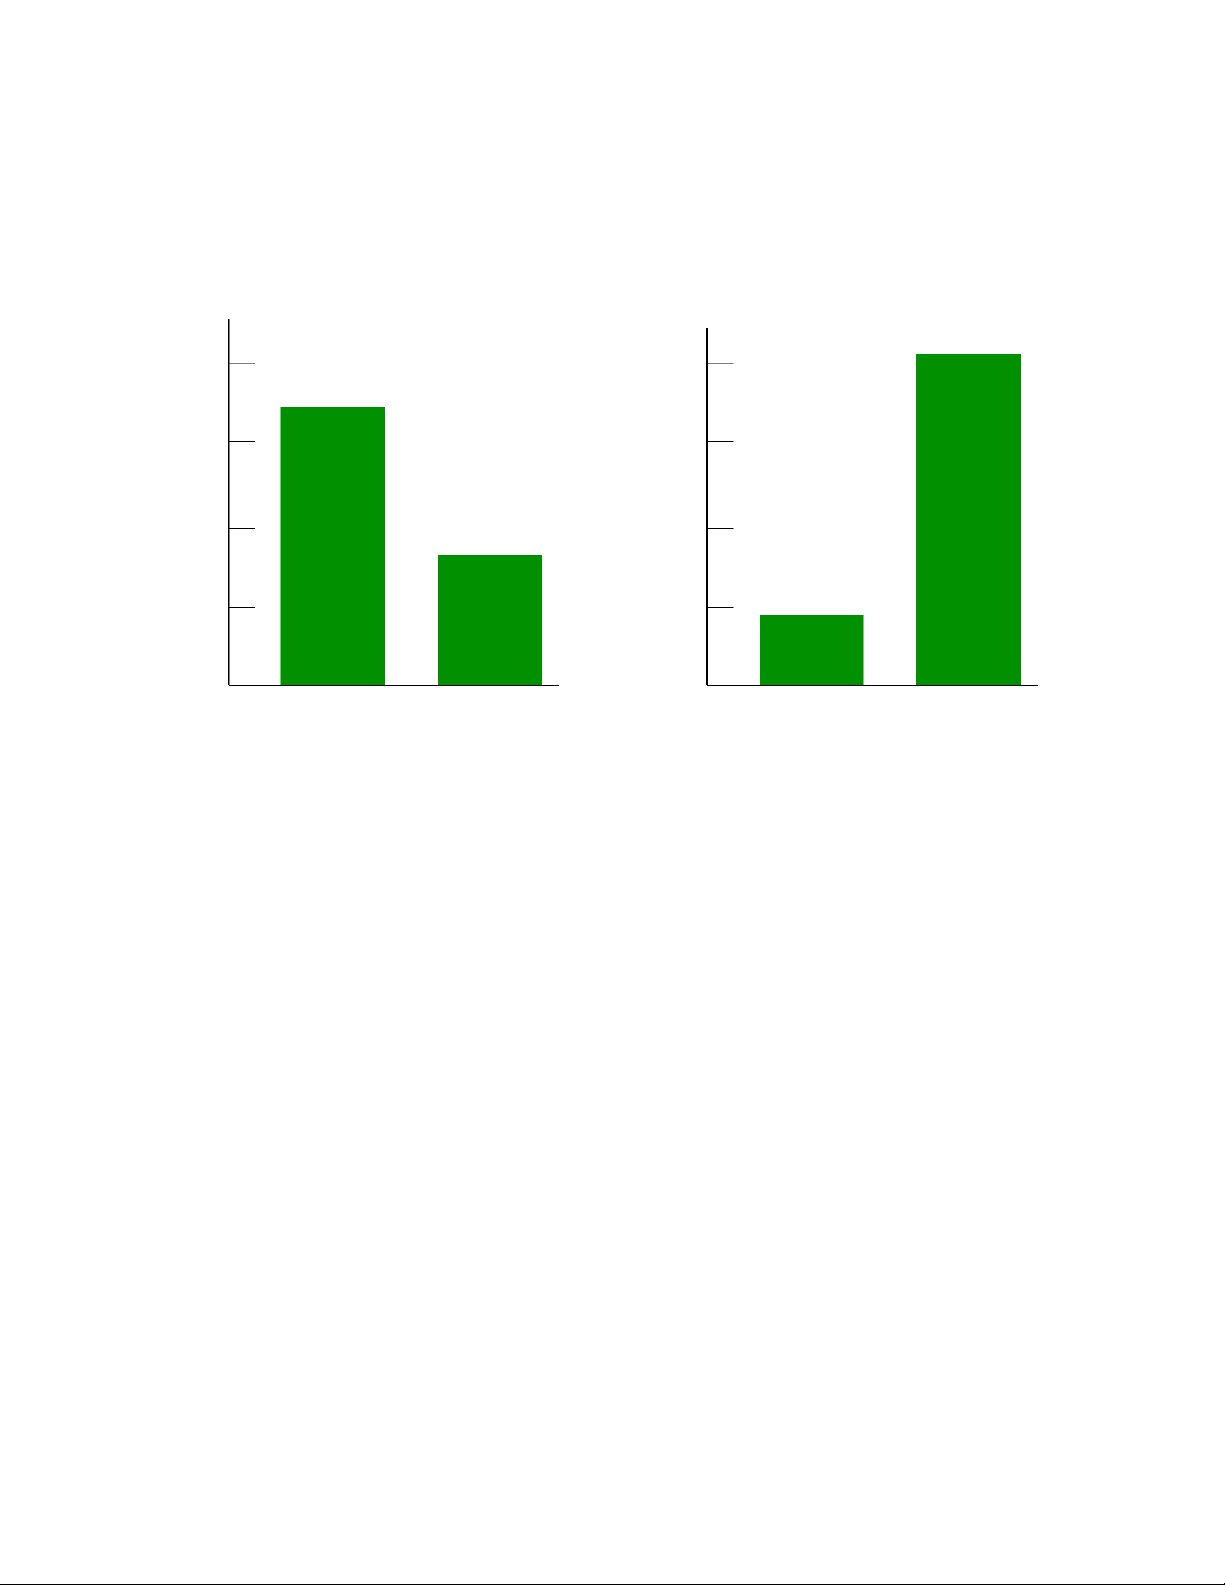
Is your best friend a man or a woman? 80 80 81% 60 60 69% 40 40 20 31% 20 19% A man A woman A man A woman Male response Female response @Statistics, Lecture 1 6 What is statistics?
Statistics provides principles and methodology for designing the process of: •Data Collection
•Summarizing and Interpreting the data
•Drawing Conclusions or Generalities @Statistics, Lecture 1 7 What is statistics? Interest in football in baseball in basketball (last decade) Draw Conclusions Sport 1990 1981 1972 1960 1948 Football 35% 38% 36% 21% 17% Baseball 16% 16% 21% 34% 39% Baseketball 15% 9% 8% 9% 10% Others 33% 37% 35% 36% 34% Data Collection
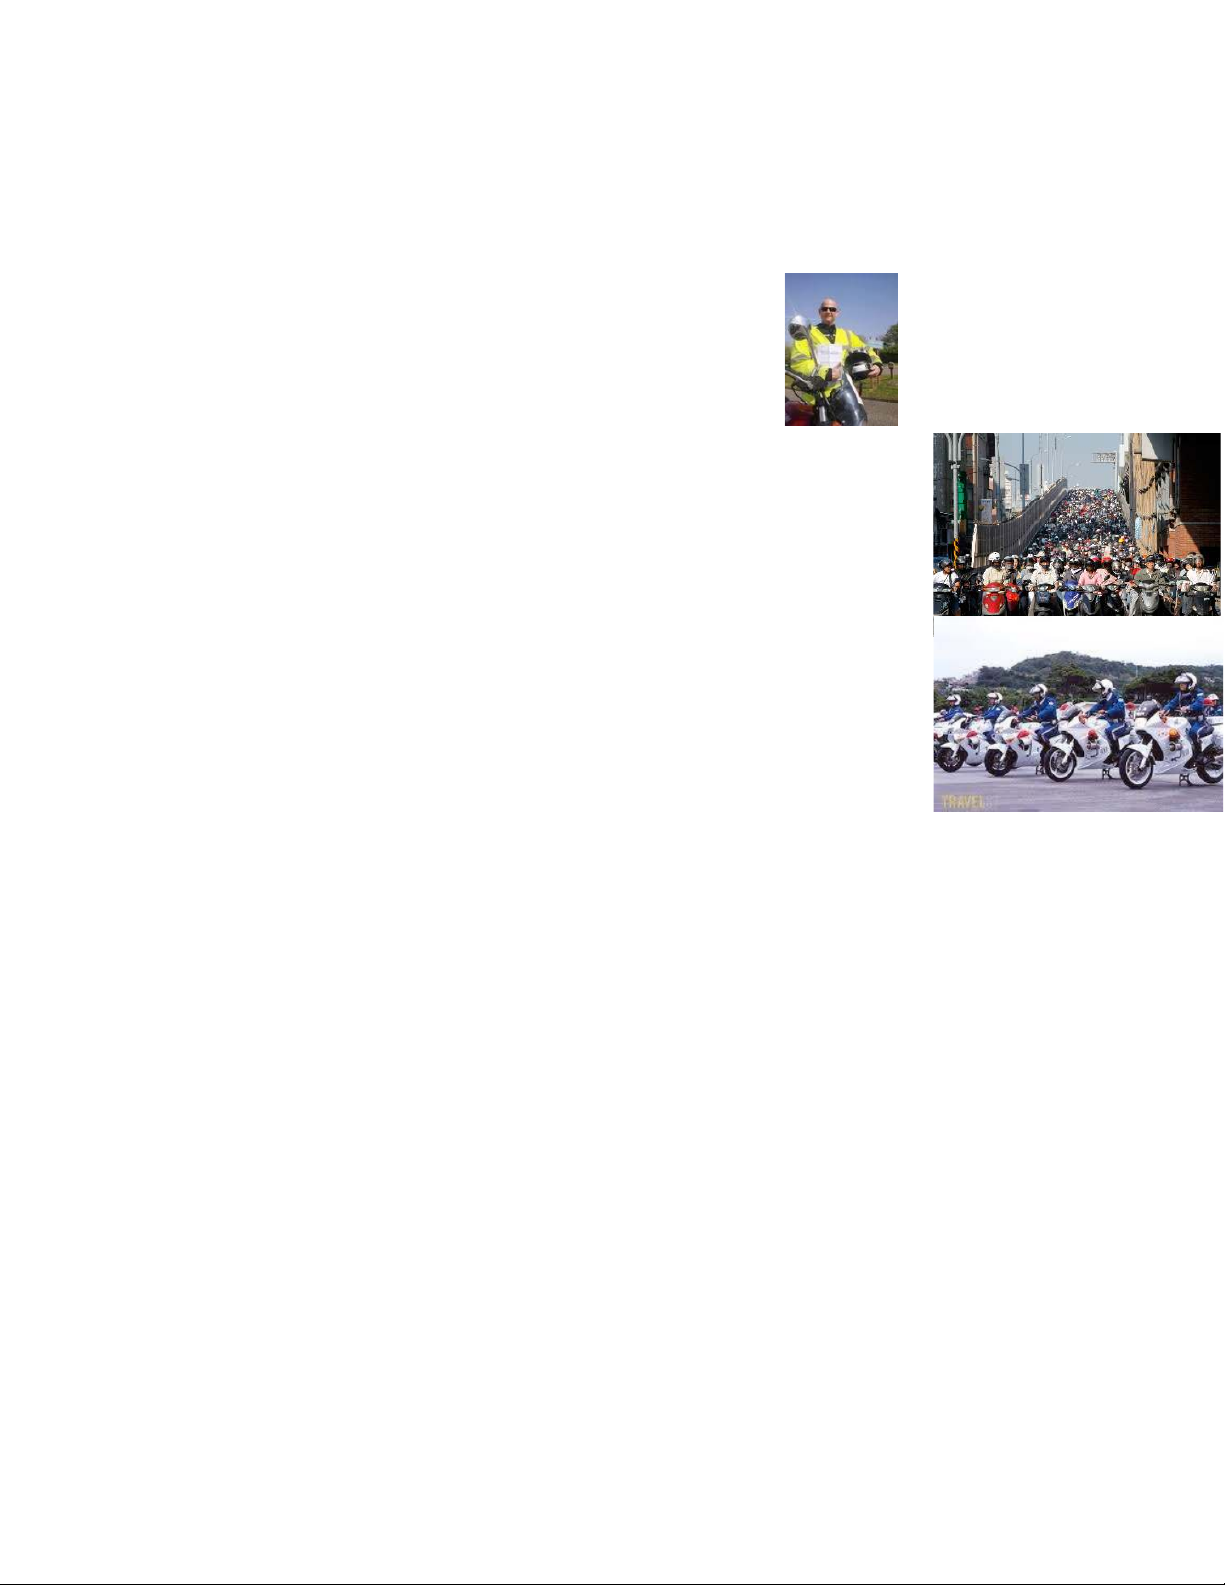
Summarization – Interpretation @Statistics, Lecture 1 8 Population and sample Topic: Which motorbikes are preferred by different
•A unit is a single entity, usually a person groups of people for daily
or an object, whose characteristics are of transportation? interest.
•The population is the complete
collection of units about which information is sought.
•A sample from a population is the set of
units whose data are actually collected in
the course of an investigation. Is this a good sample? @Statistics, Lecture 1 9 Example
VTV program for sport wants to know which Vietnamese football player is the favorite
among Hanoi residents. Listeners were then asked to call in and name their favorite soccer player.
§Identify the population and sample?
§How to get a sample that is more representative of the cityÕs population?
oresidents who go to Thong Nhat on Sunday Random
oresidents selected at random by phone sample @Statistics, Lecture 1 10
The purposeful collection of data
•Without a clearly specified purpose, or terms unambiguously defined, much effort
can be wasted in collecting data that will not answer the question of interest.
•A clearly specified statement of purpose will guide the choice of what data to
collect and help ensure that it will be relevant to the purpose. It is a key step in
designing the data collection process.
Need to have clear purpose, define types of data (e.g., types of
questionnaires to obtain the data), and methods to analyze the
collected data before collecting data. @Statistics, Lecture 1 11
Major objectives of statistics
•To make inferences about a population from an analysis of information
contained in sample data. This includes assessments of the extent of
uncertainty involved in these inferences
•To design the process and the extent of sampling so that the
observations form a basis for drawing valid inferences. @Statistics, Lecture 1 12 Where do we find statistics? Daily Life Science nNewspapers nMathematics nTelevision news nSociology nSports nBiology nPolitics nMedical nEconomy nBusiness admin netc. netc. @Statistics, Lecture 1 13 How do we work?
•Lectures (slides and the textbook)
•Exercises for each lecture (do exercises) àEvaluation by groups
•Practice with selected data via R programs •Office hours
•Presentation (2) + Final Test The Statistical Thinking
Statistics and Digital Business @Statistics, Lecture 1 14 Statistical thinking
Statistical thinking can be defined as thought processes that
focus on ways to understand, manage, and reduce variation. @Statistics, Lecture 1 15
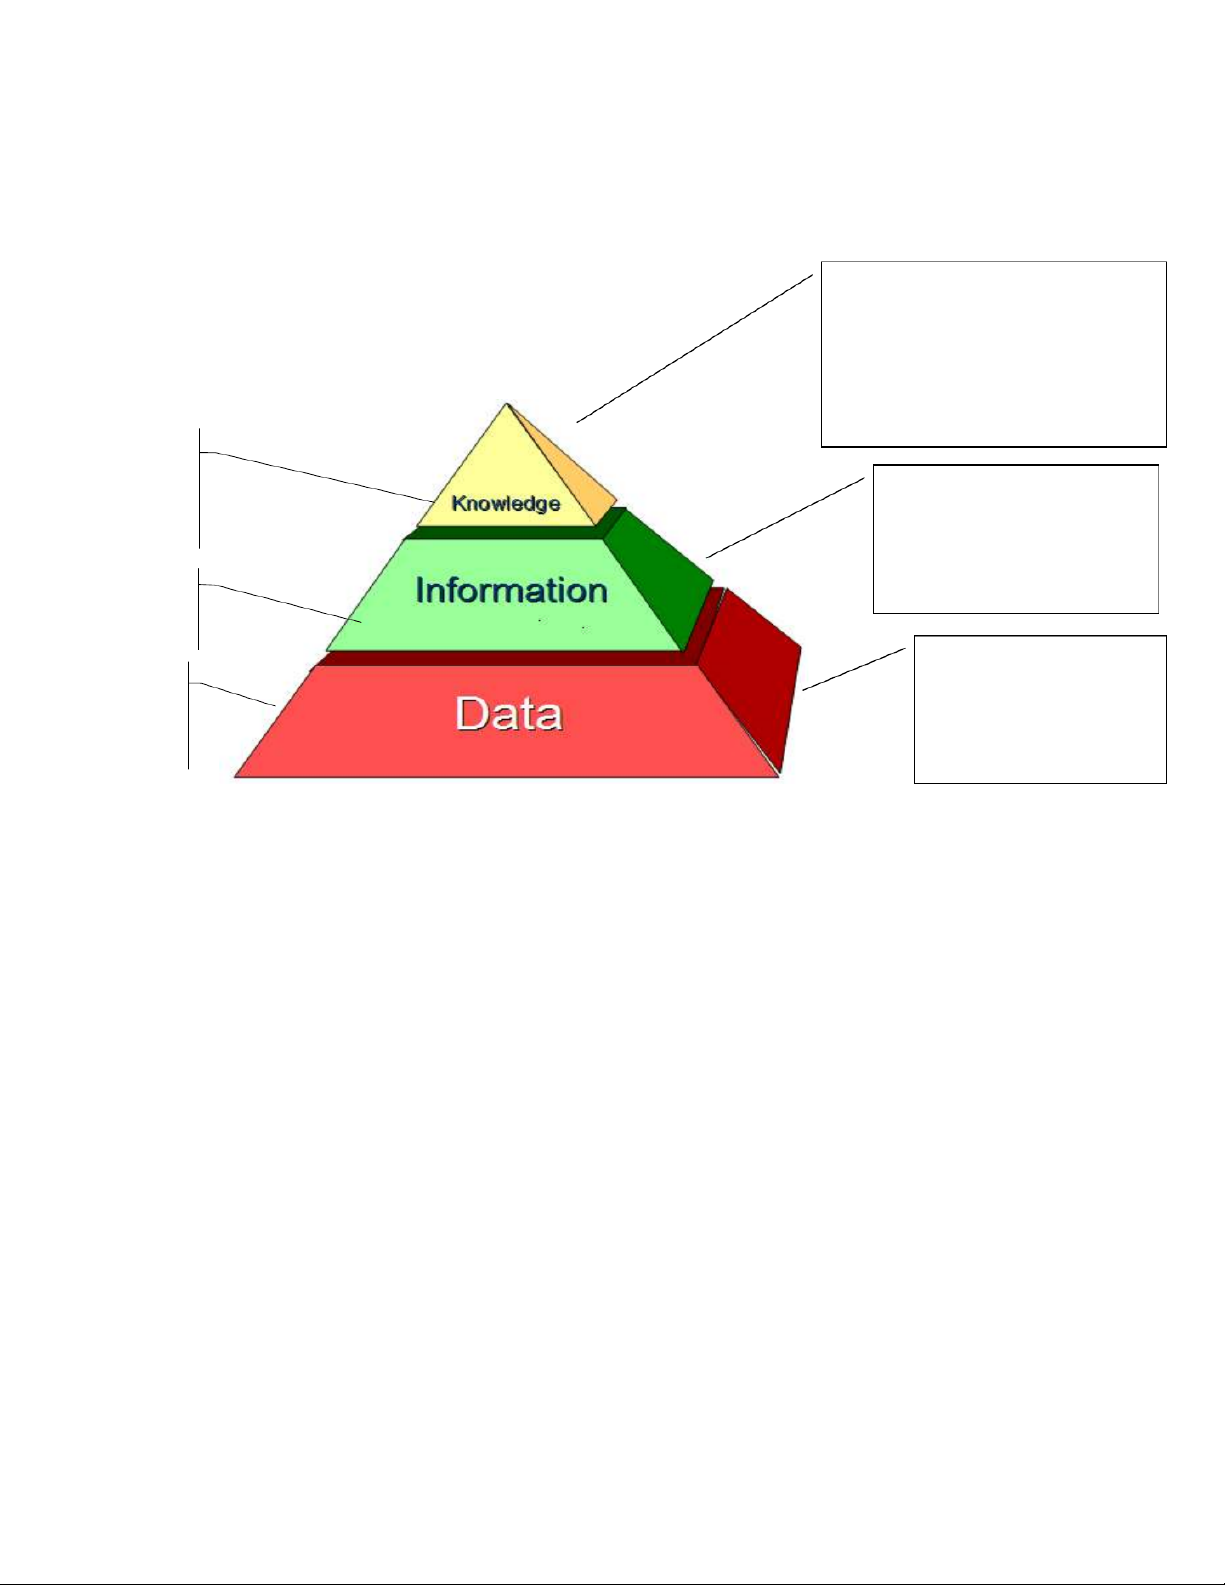
Data, information, and knowledge Tri thức (hiểu biết)
là cơ sở để hoạt động hợp lý và hiệu quả Dữ liệu Thông tin Tri thức Quan sát •Nhận thức Đo đạc •Xử lý •Học tập Thu thập •Tính toán •Khám phá c T h í ưn a h g iệ ả u i t n h g ô h ĩa Ý nghĩa của dữ liệu Thông tin tích hợp và quan hệ của chúng 16
Data, information, and knowledge integrated information, including facts and their
relations (“justified true belief)
Is this road appropriate for such amount of cars? Obtaining by -Perceiving data equipped with -Discovering meaning -Learning Average of number of cars each hour, each day, each Obtaining by week, each year on the road. -Processing Un-interpreted signal Obtaining by -Observing Number of cars counted on a road by hours, by - Measuring days of the week, by - Collecting months. @Statistics, Lecture 1 17
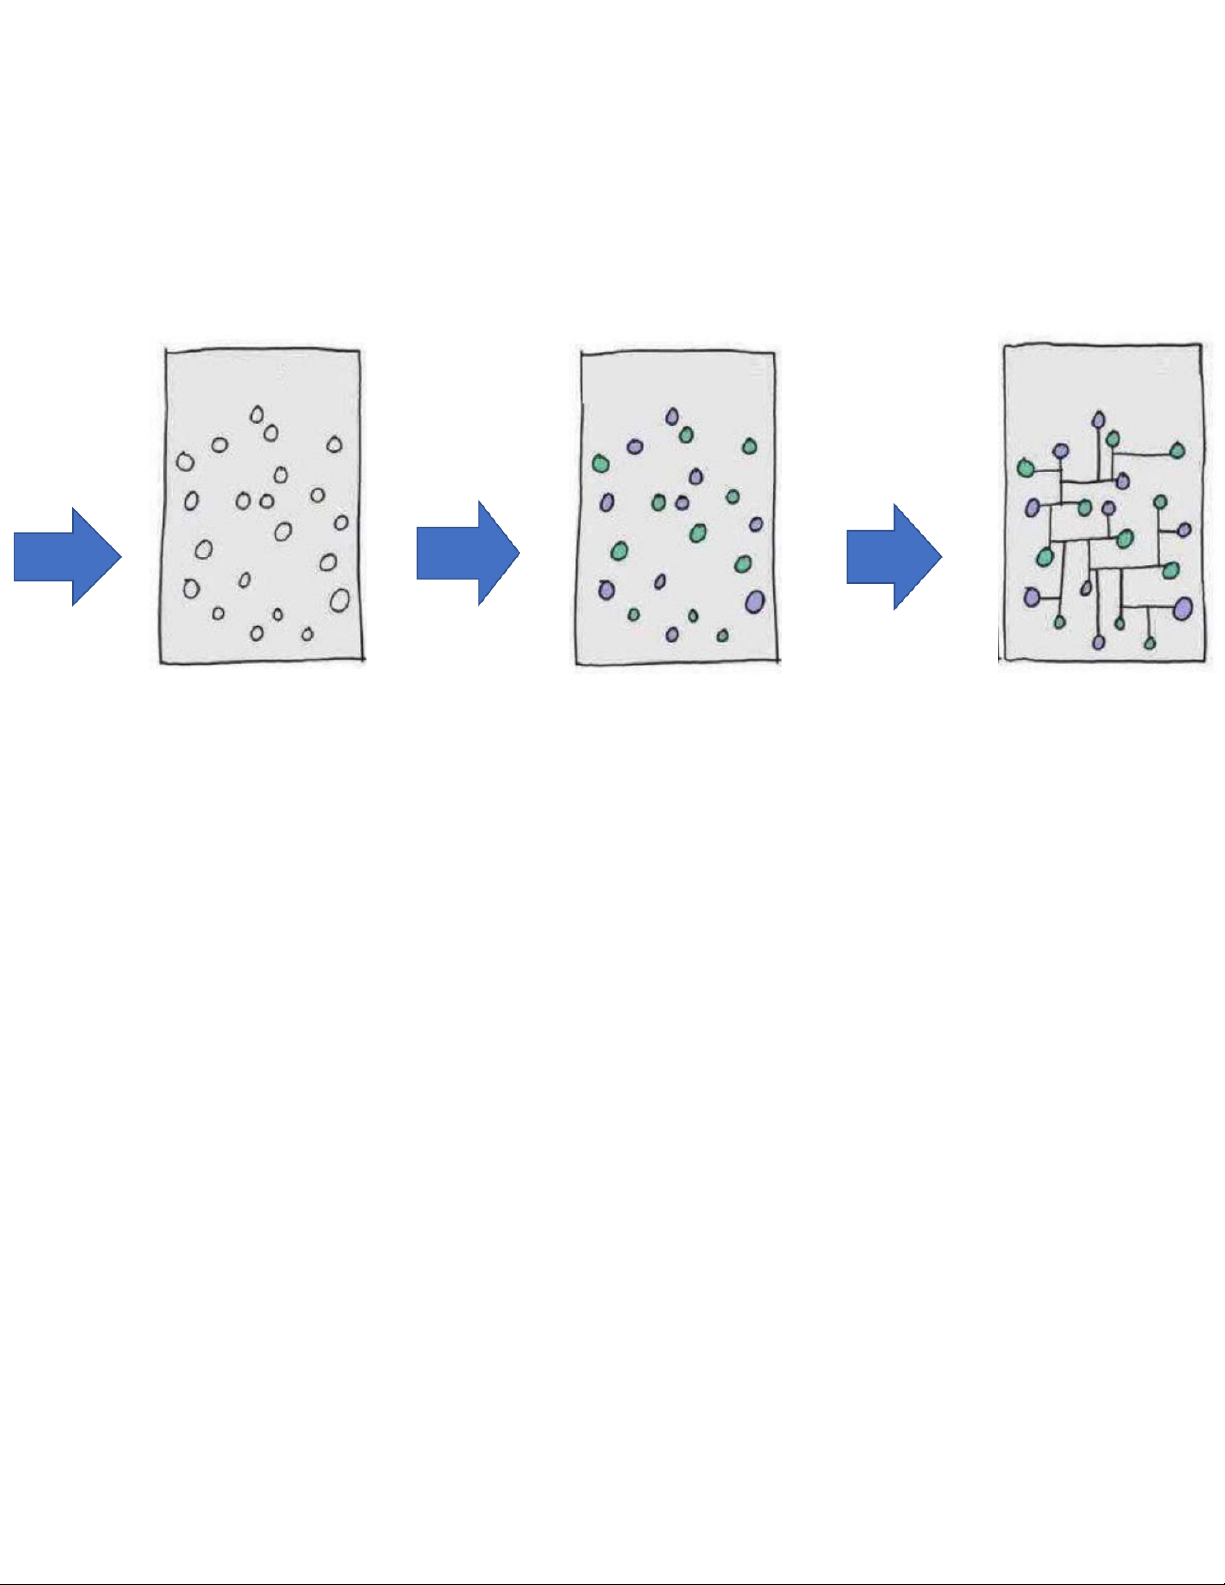
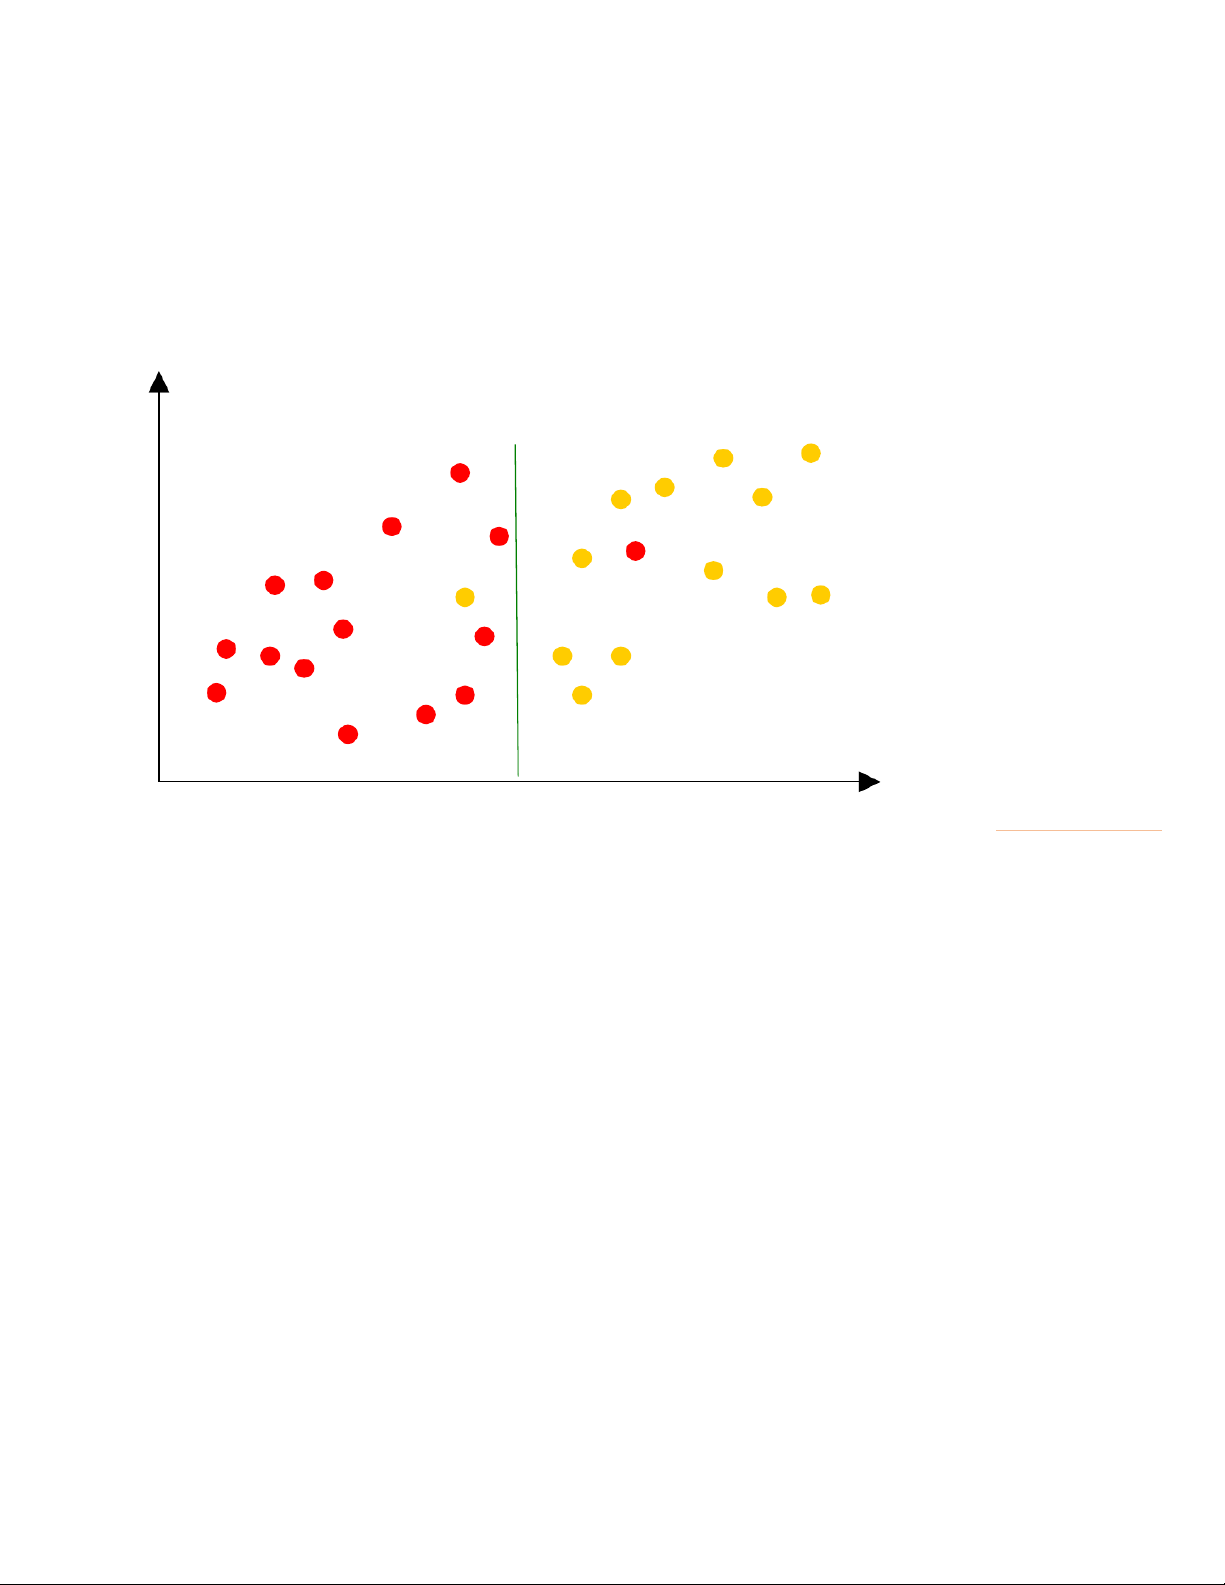
Data, information, and knowledge US$ K (income, debt) 1. ( 5.6, 8.5) 2. ( 6.0, 13.0) 3. (11.0, 12.0)
Mean of Debt = 18.4, Mean of Income = 34.5 4. (11.0, 19.0) 5. (13.5, 10.0) Debt 6. (16.5, 20.0) (information) 7. (17.5, 15.0) 8. (17.5, 5.0) 9. (22.5, 25.0) 10. (26.0, 7.5) Have defaulted 11. (30,0, 9.0) on the loan 12. (30.0, 18.0) 13. (30.0, 30.0) 14. (31.0, 14.0) 15. (32.5, 25.0) 16. (38.0, 12.0) 17. (41.0, 9.0) 18. (41.0, 22.0) Good status 19. (43.5, 12.5) 20. (44.0, 27.5) with the bank 21. (45.0, 22.5) 22. (48.0, 28.0) 23. (52.5, 21.0) 24. (53.5, 32.0) 25. (54.0, 27.5) Income 0 33 26. (57.5, 18.0) 27. (59.0, 18.0) 28. (62.5, 32.5) 29. (63.0, 18.0) (knowledge) @Statistics, Lecture 1 34.5, 18.4 18
Statistics and knowledge discovery Statistics Infer information from data
(deduction and induction, mainly
numeric data, hard to understand) KDD Databases Store, access, search, Machine Learning update data (deduction)
(mainly induction, symbolic data) @Statistics, Lecture 1 19
Part II. Organization and description of data 1. Main Type of Data
2. Description of Data by Tables and Graphs 3. Measures of Center 4. Measures of Variation 5. Visualization @Statistics, Lecture 1 20
Tài liệu liên quan:
-

Bảng giá trị phân phối thống kê poisson và student môn Xác suất thống kê| Trường Đại học Ngoại Thương
27 14 -

Bảng giá trị quyết định thống kê wilcoxon rank-sum test môn Xác suất thống kê| Trường Đại học Ngoại Thương
30 15 -

Bài 1 Định nghĩa cổ điển về xác suất môn Xác suất thống kê| Trường Đại học Ngoại Thương
26 13 -

Exercises for probability & statistics môn Xác suất thống kê| Trường Đại học Ngoại Thương
26 13 -

Đề thi cuối kỳ lý thuyết môn Xác suất thống kê| Trường Đại học Ngoại Thương
27 14