Project Proposal: COVID-19's Impact on Population Density | Môn Data Science and Visualization - Trường Đại học Quốc tế, Đại học Quốc gia Thành phố Hồ Chí Minh
In recent times, the global landscape has witnessed an unprecedented challenge that has not only posed a significant threat to public health but has also reshaped the way we perceive and interact with our world. Tài liệu được sưu tầm gồm 11 trang, giúp bạn ôn tập tốt hơn. Mời các bạn đón xem.
Môn: Data Science and Visualization 11 tài liệu
Trường: Trường Đại học Quốc tế, Đại học Quốc gia Thành phố Hồ Chí Minh 2 K tài liệu
Tác giả:


Preview text:
lOMoAR cPSD| 23136115
VIETNAM NATIONAL UNIVERSITY - HO CHI MINH CITY INTERNATIONAL UNIVERSITY DATA SCIENCE AND DATA VISUALIZATION PROJECT PROPOSAL
Topic: The impact of COVID-19 on world population density Team member
1.Đỗ Minh Quân ITITIU20282
2.Nguyễn Bá Phúc ITITIU20278
3.Trịnh Tiến Đạt ITDSIU20109
4.Phan Thế Thiện ITDSIU20084
5.Lê Minh Phượng ITITIU20281 lOMoAR cPSD| 23136115 TABLEOFCONTENT I. Introduction
II. Data pulling procedures A. About B. Data file C. Procedures D. Tool Used III. Project timeline
IV. Visualizing Prototype Sketch V. Preferences I. Introduction: 1.Summary:
- In recent times, the global landscape has witnessed an
unprecedented challenge that has not only posed a
significant threat to public health but has also reshaped
the way we perceive and interact with our world. The
COVID-19 pandemic, caused by the novel coronavirus, lOMoAR cPSD| 23136115
has had far-reaching implications, transcending borders,
societies, and economies. As we navigate through these
complex times, understanding the pandemic's impact on
various facets of our lives becomes imperative.
- In this project, we embark on a journey to explore one
such facet: the impact of COVID-19 on world population
density. Leveraging data from reputable sources and
other related data repositories, we aim to unveil the
profound changes that have occurred in population density patterns globally. 2.Purpose:
- The purpose of this project is to provide a
comprehensive analysis of how the COVID-19 pandemic
has influenced population density on a global scale.
Population density is a critical parameter that not only
reflects the distribution of people across regions but also
has far-reaching implications for public health, urban
planning, and resource allocation. lOMoAR cPSD| 23136115
- By delving into this aspect, we seek to uncover the
intricate relationships between the pandemic's
progression, containment measures, migration trends,
and shifts in population distribution. This analysis will
offer valuable insights into the adaptive responses of
societies, governments, and individuals to the pandemic's challenges. 3.Goal:
- Our primary goal is to produce a data-driven report that
elucidates the evolving dynamics of world population
density in the wake of the COVID-19 pandemic. We aim
to achieve the following specific objectives:
- Gather data from reliable sources and supplementary
data repositories, and conduct a thorough analysis of
population density trends pre- and post-pandemic.
- Explore how population density patterns have shifted at
regional, national, and global levels and identify regions
that have experienced the most significant changes. lOMoAR cPSD| 23136115
- Investigate the correlation between population density
changes and key COVID-19 parameters such as
infection rates, vaccination coverage, and public health policies.
- Provide actionable insights for policymakers, urban
planners, and public health officials based on our
findings to better prepare for future challenges and optimize resource allocation.
Through this project, we aim to contribute to the growing body of
knowledge surrounding the impact of the COVID-19 pandemic
and enable evidence-based decision-making in the domains of
public health and urban planning. Our commitment to rigorous
data analysis and visualization will serve as a valuable resource
for stakeholders and researchers grappling with the
consequences of this global crisis.
II. Data pulling procedures: ❖ About: lOMoAR cPSD| 23136115
➢ Based on data taken from the ourworldindata website and
other related data websites, we have extracted statistical
indicators to serve our statistical report. ❖ Data-file:
➢ We will use the XLSX (Excel) format file to create the statistical table.
➢ We will take actual data from 100 different countries during
the period from 2020 to 2023 (We will divide it into the period
before and after the vaccine was introduced worldwide) in our
research. And we have a total of 4 different data types including: ■ Country ■ Coronavirus Cases ■ Deaths ■ Recovered ❖ Procedures:
➢ We will get clean data and related data from websites,
besides, we also get data from surveys to start our research purposes.
➢ We will then bring the collected data into the system and
then concretize the data into different types of statistics on our lOMoAR cPSD| 23136115
research website by using HTML, CSS and D3.js to support statistical graphing.
➢ Finally, we will put it into a test run and ask volunteers to test
the features as well as provide feedback to update more
features as well as fix errors (if any) of the website. ❖ Tool used:
➢ Github/Github Gist for import and project control
➢ Visual Studio Code for HTML and CSS website building
➢ Figma for build website UI/UX prototype ➢ Vercel to deploy our web
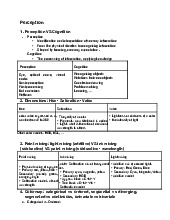
➢ RStudio for data processing III.Project Timeline
- We planned to divide the project into 6 stages,
each corresponding to a different week, activity, and project manager. Stage Activity Week The communication connection between members Planning 1 Building the planning Topic research lOMoAR cPSD| 23136115
Determine the goal and purpose of the research Building the proposal Data Collect the dataset 2 collecting Research for references and documentation Determine the proper analysis technique for the project Group discussion(1 hour) Data Remove some unnecessary 3 processing attributes
Calculate values that affected the accuracy and precision of the findings Fill in missing data Clean the data Group discussion(1 hour) Conceptual Design UI/UX Design Determine data requirements 5-8 Sketch the ER diagrams lOMoAR cPSD| 23136115 Sketch the activity diagrams Finalize the design Group discussion(1 hour each week)
Design Web Design the web layout Coding the web functions and charts Finalize the web coding Group discussion(1 hour each week) 8-13 Presentation Final report Presentation slides 14
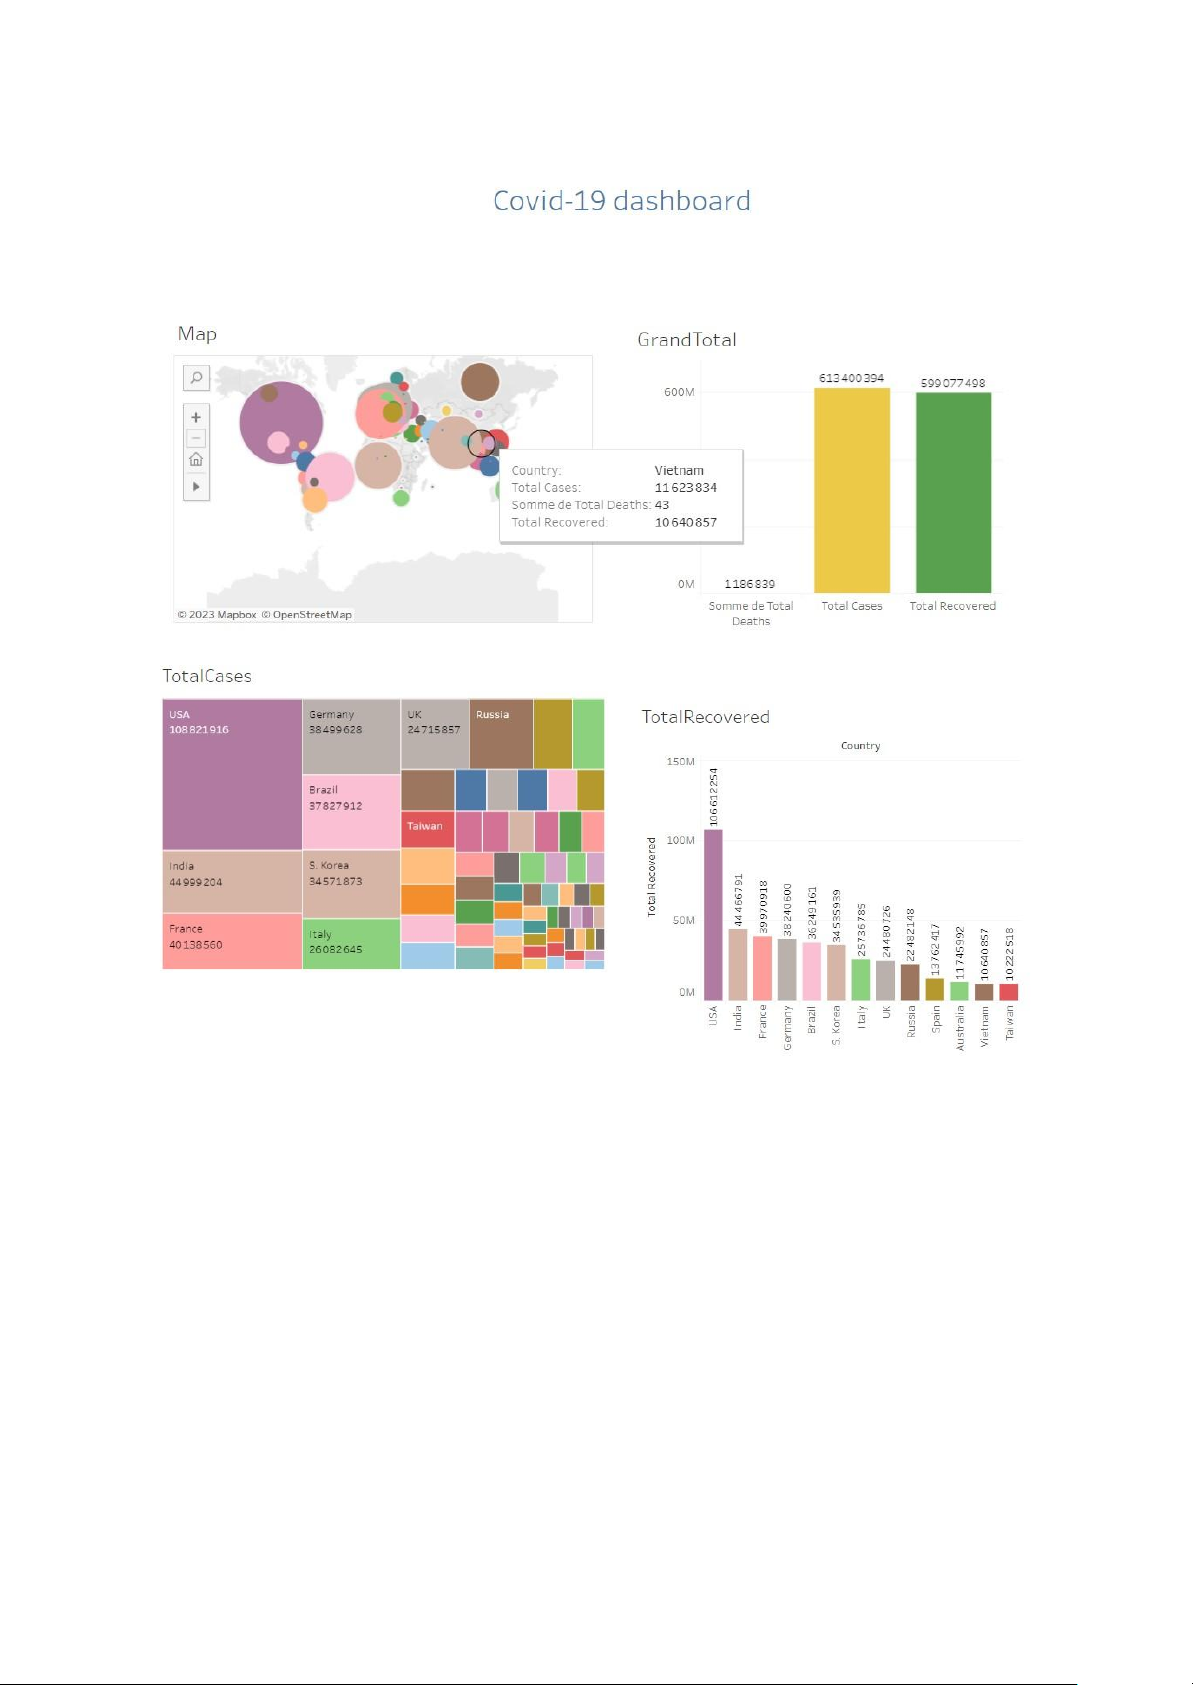
IV. Visualizing Prototype Sketch lOMoAR cPSD| 23136115 V. Preferences
[1] Data up to March 7, 2021 from lOMoAR cPSD| 23136115
https://covidtracking.com/data/download
[2] Data in VietNam Coronavirus cases from
https://www.worldometers.info/coronavirus/cou ntry/viet-nam/ [3] Data overview from https://covid19.who.int/data
[4] Coronavirus case for every countries from
https://ourworldindata.org/coronavirus
Tài liệu liên quan:
-
Giới thiệu các loại mật thư và kỹ thuật giải mật thư | Data Science | Trường Đại học Quốc tế, Đại học Quốc gia Thành phố Hồ Chí Minh
21 11 -
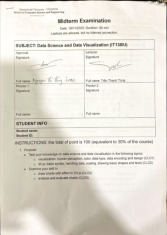
Midterm Exam Môn Data Science and Visualization | Trường Đại học Quốc tế, Đại học Quốc gia Thành phố Hồ Chí Minh
167 84 -
Final Exam Notes | Môn Data Science and Visualization - Trường Đại học Quốc tế, Đại học Quốc gia Thành phố Hồ Chí Minh
120 60 -
Final Review Môn Data Science and Visualization | Trường Đại học Quốc tế, Đại học Quốc gia Thành phố Hồ Chí Minh
105 53