Quiz 1: statistics concepts and questions for review môn Xác suất thống kê| Trường Đại học Ngoại Thương
Groupings of data, created to enhance an understanding of them,usually by making the groups collectively exhaustive and mutually exclusive are called classes or categories. Tài liệu giúp bạn tham khảo, ôn tập và đạt kết quả cao. Mời đọc đón xem!
Môn: Xác suất thống kê (FTU) 355 tài liệu
Trường: Trường Đại học Ngoại Thương 1.1 K tài liệu
Tác giả:


Preview text:
Quiz 1 True/False
Indicate whether the statement is true or false.
____ 1. A local cable system using a sample of 1000 subscribers estimates that fifty percent of its subscribers True
watch premium channel at least five times per week. This is an example of inferential statistics as
opposed to descriptive statistics.
____ 2. Groupings of data, created to enhance an understanding of them, usually by making the groups True
collectively exhaustive and mutually exclusive are called classes or categories.
____ 3. Time series data are often graphically depicted on a line chart, which is a plot of the variable of True interest over time.
____ 4. A skewed histogram is one with a long tail extending either to the right or left. True
____ 5. When constructing a relative frequency distribution, if the data are discrete, it will always be False
necessary to develop class boundaries. Multiple Choice
Identify the choice that best completes the statement or answers the question. ____
a 1. Descriptive statistics deals with methods of: a. organizing data b. summarizing data
c. presenting data in a convenient and informative way all of these
e. only organizing and summarizing data
____ 2. Which of the following is not the goal of descriptive statistics? a. summarizing data
b. displaying aspects of the collected data
c. reporting numerical findings e. none of these
____ 3. You asked ten of your classmates about their weight. On the basis of this information, you stated that
the average weight of all students in your university or college is 158 pounds. This is an example of: a. descriptive statistics c. sample d. population e. sample and population
____ 4. The best type of chart for comparing two sets of qualitative data is: a. a line chart b. a pie chart c. a histogram e . all of these
____ 5. The sum of the frequencies for all classes will always equal: a. the number of classes b. the class width d. one e. the average
____ 6. A politician who is running for the office of governor of a state with 7 million registered voters
commissions a survey. In the survey, 55% of the 10,000 registered voters interviewed say they plan
to vote for her. The population of interest is the:
b. 10,000 registered voters interviewed
c. 55 %, or 5,500 voters interviewed who plan to vote for her
d. 45%, or 4,500 voters interviewed who plan not to vote for her
e . 55% of the 7 million registered voters in the state
____ 7. The set of all possible observations about a specified characteristic of interest is: a. a frame b. a multinomial data set c. an observational study e . all of these
____ 8. Which of the following statements is false? a.
b. It is often a good idea to convert frequency distributions to relative frequency
distributions when you compare two distributions with different amount of data.
c. A pie is the familiar circular graph that shows how the measurements are
distributed among the categories of a qualitative variable. d. None of these. e . All of these.
____ 9. Which of the following statements is true?
a. In constructing a pie chart for a categorical variable, one sector of the pie is
assigned to each category of the variable.
b. A bar chart for a categorical variable shows the same distribution of measurements
in categories as the pie chart, but with the height of each bar measuring how often
a particular category was observed.
c. The categories for a qualitative variable should be chosen so that a measurement
will belong to one and only one category, and each measurement has a category to which it can be assigned.
d. In constructing a pie chart for a categorical variable, one sector of the pie is
assigned to each category of the variable and a bar chart for a categorical variable
shows the same distribution of measurements in categories as the pie chart, but
with the height of each bar measuring how often a particular category was observed. .
____ 10. Given 180 observations, a data class with an absolute class frequency of 36 must have a relative class frequency of: a. .10 c. .36 d. .18 e . none of these
____ 11. A common rule of thumb in constructing a relative frequency histogram is to use: a. less than 5 classes b. more than 10 classes d. any number of classes e. at least 10 classes
____ 12. Which of the following is not recommended when constructing a relative frequency histogram? a. equal width classes b. mutually exclusive classes d. none of these e. all of these
____ 13. A bar chart is used to display a: a. time series data b. continuous variable d. quantitative variable e. discrete variable
____ 14. Which of the following statements is false?
b. The bars on a bar chart have the same width.
c. The simplest graph for quantitative data is the dotplot.
d. There are gaps between the bars in a bar chart. e. All of these.
____ 15. The stem-and-leaf plot is used to display the distribution of: a. qualitative data
c. two quantitative variables on the same chart d. all of these Problem
1. A highway department would like to repair a certain highway during the slowest part of a day to help
minimize traffic congestion. Because it would be impossible to monitor the traffic flow on every
day, they monitor how many vehicles pass on this highway during one particular day. Based on these
results the department decides when to repair the highway. Describe the population and sample in this problem.
Population: ________________________________________________________
Sample: ________________________________________________________
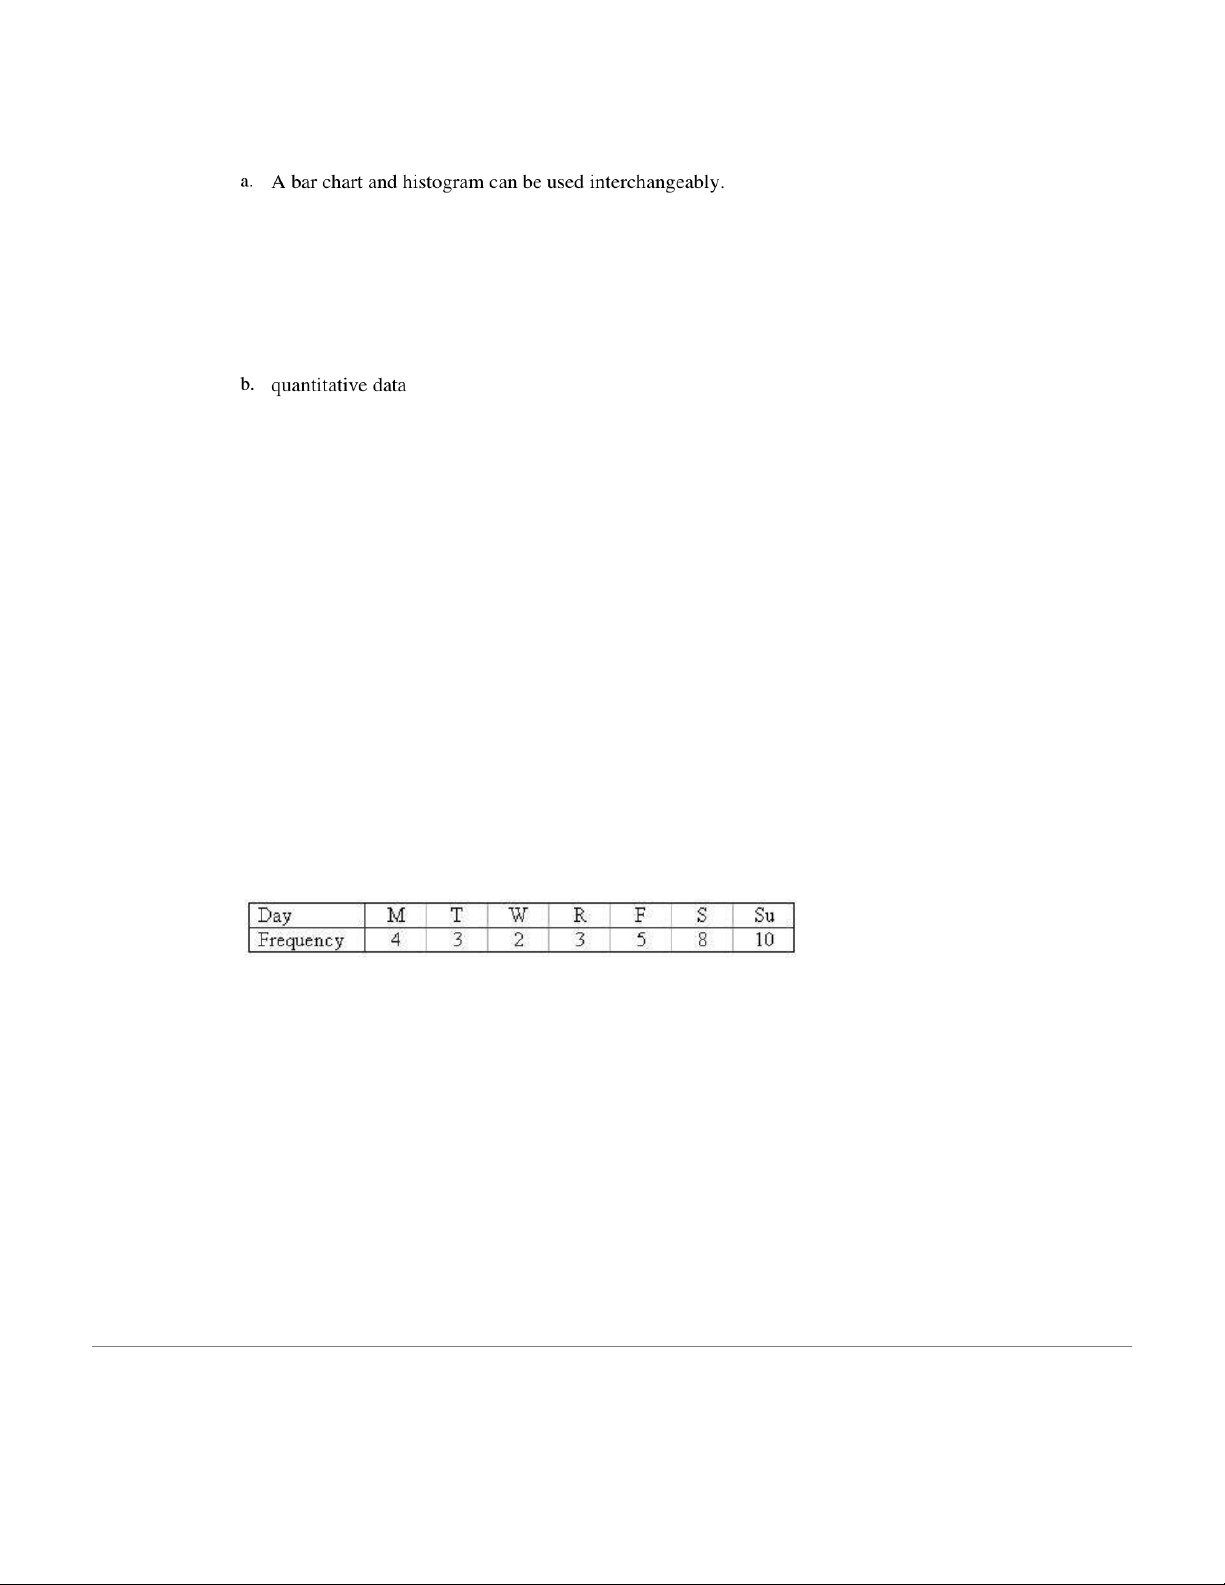
2. A neighborhood ice cream vendor would like to see if there is a relationship between day of the
week and the number of children buying ice cream from her. The following data represent the
number of children buying ice cream on each of the seven days of a particular week:
a. Construct a line chart to describe the data.
b. Is there any apparent trend in the data?
_______________________________________________________
Tài liệu liên quan:
-

Bảng giá trị phân phối thống kê poisson và student môn Xác suất thống kê| Trường Đại học Ngoại Thương
27 14 -

Bảng giá trị quyết định thống kê wilcoxon rank-sum test môn Xác suất thống kê| Trường Đại học Ngoại Thương
29 15 -

Bài 1 Định nghĩa cổ điển về xác suất môn Xác suất thống kê| Trường Đại học Ngoại Thương
26 13 -

Exercises for probability & statistics môn Xác suất thống kê| Trường Đại học Ngoại Thương
26 13 -

Đề thi cuối kỳ lý thuyết môn Xác suất thống kê| Trường Đại học Ngoại Thương
27 14