Reading 2 Organizing, Visualizing, and Describing Data - Business English | Trường Đại học Hùng Vương
Reading 2 Organizing, Visualizing, and Describing Data - Business English | Trường Đại học Hùng Vương được sưu tầm và soạn thảo dưới dạng file PDF để gửi tới các bạn sinh viên cùng tham khảo, ôn tập đầy đủ kiến thức, chuẩn bị cho các buổi học thật tốt. Mời bạn đọc đón xem!
Môn: Business English( TA1901) 89 tài liệu
Trường: Trường Đại học Hùng Vương 164 tài liệu
Tác giả:


Preview text:
Question #1 of 93 Question ID: 1376998
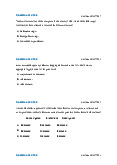
For the past three years, Acme Corp. has generated the following sample returns on equity
(ROE): 4%, 10%, and 1%. What is the sample variance of the ROE over the last three years? A) 21.0(%2). B) 4.6%. C) 21.0%. Question #2 of 93 Question ID: 1377008
An analyst gathers the following data about the mean monthly returns of three securities:
Security Mean Monthly Return Standard Deviation X 0.9 0.7 Y 1.2 4.7 Z 1.5 5.2
Which security has the highest level of relative risk as measured by the coefficient of variation? A) Z. B) Y. C) X. Question #3 of 93 Question ID: 1376956
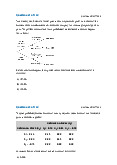
Use the results from the following survey of 500 firms to answer the question. Number of Employees Frequency 300 up to 400 40 400 up to 500 62 500 up to 600 78 600 up to 700 101 700 up to 800 131 800 up to 900 88
The cumulative relative frequency of the second interval (400 to 500) is: A) 10.2%. B) 12.4%. C) 20.4%. Question #4 of 93 Question ID: 1376962
In a frequency distribution histogram, the frequency of an interval is given by the:
A) height of the corresponding bar.
B) height multiplied by the width of the corresponding bar.
C) width of the corresponding bar. Question #5 of 93 Question ID: 1377002
If the historical mean return on an investment is 2.0%, the standard deviation is 8.8%, and
the risk free rate is 0.5%, what is the coefficient of variation (CV)? A) 4.40. B) 0.17. C) 0.23. Question #6 of 93 Question ID: 1376947
GDP growth rates experienced by the UK over each of the last 10 years are most appropriately organized in: A) a two-dimensional array.
B) both a one or two-dimensional array. C) a one-dimensional array. Question #7 of 93 Question ID: 1377020
Which of the following statements about kurtosis is least accurate? Kurtosis:
A) describes the degree to which a distribution is not symmetric about its mean.
B) is used to reect the probability of extreme outcomes for a return distribution.
measures the peakedness of a distribution reecting a greater or lesser
C) concentration of returns around the mean. Question #8 of 93 Question ID: 1377015
If an analyst concludes that the distribution of a large sample of returns is positively skewed,
which of the following relationships involving the mean, median, and mode is most likely? A) Mean > median < mode. B) Mean < median < mode. C) Mean > median > mode. Question #9 of 93 Question ID: 1376967
Which of the following tools best captures the distribution of returns for a particular stock? A) Scatter plot. B) Histogram. C) Heat map. Question #10 of 93 Question ID: 1376995
Find the respective mean and the mean absolute deviation (MAD) of a series of stock market returns. Year 1 14% Year 2 20% Year 3 24% Year 4 22% A) 22%; 3%. B) 20%; 12%. C) 20%; 3%. Question #11 of 93 Question ID: 1376975
What is the compound annual growth rate for stock A which has annual returns of 5.60%, 22.67%, and -5.23%? A) 8.72%. B) 7.08%. C) 6.00%. Question #12 of 93 Question ID: 1376986
An analyst observes the following four annual returns: R = +10%, R = –15%, R = 0%, and R 1 2 3 4
= +5%. The average compound annual rate over the four years is closest to: A) –0.5%. B) –5.0%. C) 0.0%. Question #13 of 93 Question ID: 1377010
In a positively skewed distribution, what is the order (from lowest value to highest) for the
distribution's mode, mean, and median values? A) Mean, median, mode. B) Mode, mean, median. C) Mode, median, mean. Question #14 of 93 Question ID: 1381145
An investment experienced the following returns over the last 10 years: YearYear ReturnReturn 11 2%2% 22 9%9% 33 8%8% 44 –5%–5% 55 6%6% 66 8%8% 77 9%9% 88 –3%–3% 99 10%10% 1010 3%3%
Using a target return of 4%, the target semideviation of returns over the period is closest to: A) 5.29%. B) 4.26%. C) 3.87%. Question #15 of 93 Question ID: 1376941
Panel data are most accurately described as: A) a type of time series data.
B) a type of cross-sectional data.
C) a combination of time series and cross-sectional data. Question #16 of 93 Question ID: 1376976
The respective arithmetic mean and geometric mean returns of the following series of stock market returns are: Year 1 14% Year 2 6% Year 3 −5% Year 4 20% A) 8.75%; 8.34%. B) 8.90%; 8.62%. C) 8.75%; 8.62%. Question #17 of 93 Question ID: 1376972
An investor has the following assets:
$5,000 in bonds with an expected return of 8%.
$10,000 in equities with an expected return of 12%.
$5,000 in real estate with an expected return of 10%.
What is the portfolio's expected return? A) 10.00%. B) 10.50%. C) 11.00%. Question #18 of 93 Question ID: 1381140
An analyst calculates a winsorized mean return of 3.2% for an investment fund. This measure most likely:
A) equally weights all returns.
B) replaces outliers with less extreme returns.
C) captures the compounded growth rate of the fund. Question #19 of 93 Question ID: 1381144
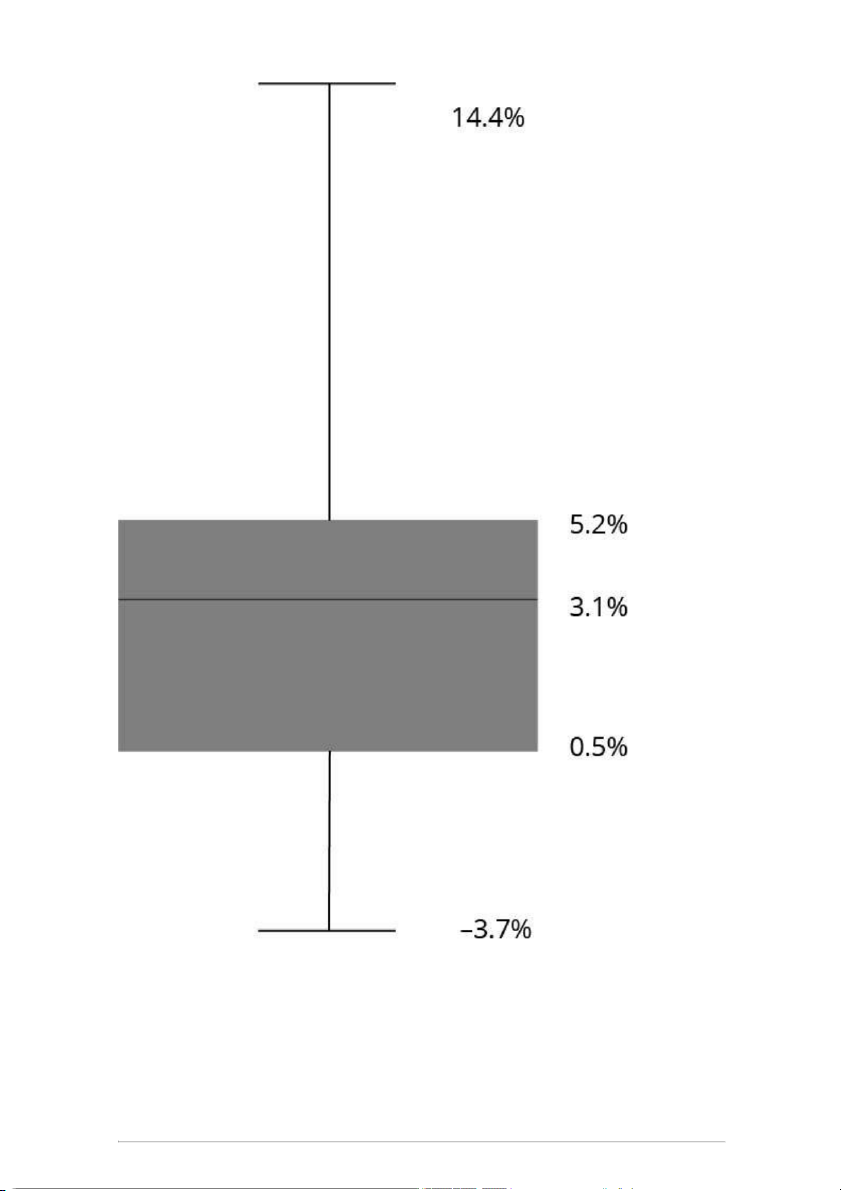
Given the following box-and-whisker plot: The interquartile range is: A) 0.5% to 5.2%. B) 3.1% to 5.2%. C) 0.5% to 3.1%. Question #20 of 93 Question ID: 1376955
Monthly returns for a set of small cap stocks are 1.3%, 0.8%, 0.5%, 3.4%, -3.5%, -1.2%, 1.8%,
2.1%, and 1.5%. An analyst constructs a frequency distribution and a frequency polygon
using the following intervals: -4.0% to -2.0%, -2.0% to 0.0%, 0.0% to 2.0%, and 2.0% to 4.0%.
Which of the following statements about these data presentations is least accurate?
The relative frequency of the interval -2.0% to 0.0% equals the relative frequency of A) the interval 2.0% to 4.0%.
A frequency polygon plots the midpoint of each interval on the horizontal axis and
B) the absolute frequency of that interval on the vertical axis.
C) The absolute frequency of the interval 0.0% to 2.0% is 5. Question #21 of 93 Question ID: 1376973
An investor has a portfolio with 10% cash, 30% bonds, and 60% stock. If last year's return on
cash was 2.0%, the return on bonds was 9.5%, and the return on stock was 25%, what was
the return on the investor's portfolio? A) 11.77%. B) 12.17%. C) 18.05%. Question #22 of 93 Question ID: 1376970
A linear or nonlinear relationship between two variables is best visualized using a:
A) cumulative distribution chart. B) bubble line chart. C) scatter plot. Question #23 of 93 Question ID: 1376945
A two-dimensional array is most appropriate for organizing data on annual earnings per share for:
A) 100 companies in the most recent period.
B) banking sector companies over the last three years.
C) ABC Ltd over the last ve years. Question #24 of 93 Question ID: 1377017
A distribution that is more peaked than a normal distribution is termed: A) platykurtic. B) skewed. C) leptokurtic. Question #25 of 93 Question ID: 1377001
An analyst takes a sample of yearly returns of aggressive growth funds resulting in the
following data set: 25, 15, 35, 45, and 55. The mean absolute deviation (MAD) of the data set is closest to: A) 20. B) 12. C) 16. Question #26 of 93 Question ID: 1376942
The dividend yield of the S&P 500 index is least likely an example of: A) numerical data. B) nominal data. C) continuous data. Question #27 of 93 Question ID: 1376950
Which of the following statements regarding frequency distributions is least accurate? Frequency distributions:
A) summarize data into a relatively small number of intervals.
B) organize data into overlapping groups.
C) work with all types of measurement scales. Question #28 of 93 Question ID: 1376965
A bubble line chart is best suited to summarizing data with: A) three dimensions. B) one dimension. C) two dimensions. Question #29 of 93 Question ID: 1376982
An investor has a $12,000 portfolio consisting of $7,000 in stock P with an expected return of
20% and $5,000 in stock Q with an expected return of 10%. What is the investor's expected return on the portfolio? A) 30.0%. B) 15.8%. C) 15.0%. Question #30 of 93 Question ID: 1377023
A portfolio's monthly returns follow a distribution with a kurtosis measure of 4.2. Relative to
a portfolio with normally distributed returns, this portfolio has a:
higher probability of extreme upside returns and lower chance of extreme A) downside returns.
higher probability of extreme upside returns and higher chance of extreme B) downside returns.
lower probability of extreme upside returns and higher chance of extreme C) downside returns. Question #31 of 93 Question ID: 1376997
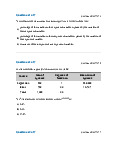
A sample of returns for four randomly selected assets in a portfolio is shown below: Asset Return (%) A 1.3 B 1.4 C 2.2 D 3.4
What is the sample standard deviation of asset returns? A) 0.88%. B) 0.97%. C) 1.13%. Question #32 of 93 Question ID: 1376958 Market Capitalization Style
Small-cap stocks Large-cap stocks Value stocks 5 20 Growth stocks 25 50
In the contingency table above, the values shown are: A) relative frequencies. B) joint frequencies. C) marginal frequencies. Question #33 of 93 Question ID: 1381142
The following annualized monthly return measures have been calculated for an investment
based on its performance over the last 72 months. Arithmetic meanArithmetic mean 6.8%6.8% Geometric meanGeometric mean 6.0%6.0%
90% Winsorized mean90% Winsorized mean 5.5%5.5%
If for one month in the period the return was extremely high, which measure best reflects
the central tendency of the investment's returns? A) Geometric mean. B) Winsorized mean. C) Arithmetic mean. Question #34 of 93 Question ID: 1376966
A scatter plot matrix is best suited to visualize:
A) the joint variability between two variables.
B) trends in more than one variable over time.
C) correlations among multiple variables. Question #35 of 93 Question ID: 1377004
What is the coefficient of variation for a distribution with a mean of 10 and a variance of 4? A) 20%. B) 25%. C) 40%. Question #36 of 93 Question ID: 1376946
Information on inflation rates experienced by South American countries over each of the last
five years is best organized in: A) a one-dimensional array. B) a two-dimensional array.
C) neither a one nor two-dimensional array. Question #37 of 93 Question ID: 1376938
An analyst is asked to calculate standard deviation using monthly returns over the last five
years. These data are best described as: A) cross-sectional data. B) unstructured data. C) time series data. Question #38 of 93 Question ID: 1381141
Over the last five years, an investment fund's monthly returns were relatively stable apart
from last year, where two extremely high returns were recorded. If the arithmetic mean for
the fund's monthly returns over the period is 6.7%, a trimmed or winsorized mean return is most likely to be:
A) higher than the arithmetic mean.
B) equal to the arithmetic mean.
C) lower than the arithmetic mean. Question #39 of 93 Question ID: 1377018
A distribution of returns that has a greater percentage of small deviations from the mean
and a greater percentage of large deviations from the mean compared to a normal distribution:
A) has positive excess kurtosis. B) is positively skewed.
C) has negative excess kurtosis. Question #40 of 93 Question ID: 1377005
If Stock X's expected return is 30% and its expected standard deviation is 5%, Stock X's
expected coefficient of variation is: A) 0.167. B) 1.20. C) 6.0. Question #41 of 93 Question ID: 1376952
Twenty students take an exam. The percentages of questions they answer correctly are
ranked from lowest to highest as follows: 32 49 57 58 61 62 64 66 67 67 68 69 71 72 72 74 76 80 82 83
In a frequency distribution from 30% to 90% that is divided into six equal-sized intervals, the
absolute frequency of the sixth interval is: A) 2 B) 3 C) 4 Question #42 of 93 Question ID: 1381139 A 5% trimmed mean ignores the:
A) highest and lowest 5% of observations.
B) highest and lowest 2.5% of observations. C) lowest 5% of observations. Question #43 of 93 Question ID: 1376999
Assume that the following returns are a sample of annual returns for firms in the clothing industry.
Firm 1 Firm 2 Firm 3 Firm 4 Firm 5 15% 2% 5% (7%) 0%
The sample standard deviation is closest to: A) 5.7. B) 8.0. C) 7.2. Question #44 of 93 Question ID: 1376949
Which of the following best describes a frequency distribution? A frequency distribution is a grouping of:
A) measures used to describe a population
B) data into non-overlapping intervals
C) data into groups, the numerical order of which does not matter Question #45 of 93 Question ID: 1376964
A frequency polygon is best suited to summarizing:
A) underlying trends over time. B) unstructured textual data.
C) a distribution of numerical data. Question #46 of 93 Question ID: 1376968
Which of the following tools is most appropriate for visualizing how frequently certain words
appear in a set of social media posts? A) Tree map. B) Word cloud. C) Histogram. Question #47 of 93 Question ID: 1376979
The owner of a company has recently decided to raise the salary of one employee, who was
already making the highest salary in the company, by 40%. Which of the following value(s) is
(are) expected to be affected by this raise? A) mean only. B) median only. C) mean and median only. Question #48 of 93 Question ID: 1376940
Categorical or qualitative data types include: A) ordinal data. B) discrete data. C) continuous data. Question #49 of 93 Question ID: 1376939
The sample of per square foot sales for 100 U.S. retailers in December 2004 is an example of: A) cross-sectional data. B) time-series data. C) panel data. Question #50 of 93 Question ID: 1377000
Annual Returns on ABC Mutual Fund Yr 1 Yr 2 Yr 3 Yr 4 Yr 5 Yr 6 Yr 7 Yr 8 Yr 9 Yr 10
11.0% 12.5% 8.0% 9.0% 13.0% 7.0% 15.0% 2.0% -16.5% 11.0%
Assuming a mean of 7.2%, what is the sample standard deviation of the returns for ABC
Mutual Fund for the period from Year 1 to Year 10? A) 9.8%. B) 9.1%. C) 7.8%. Question #51 of 93 Question ID: 1376978
Given the following annual returns, what are the geometric and arithmetic mean returns, respectively? 2002 2003 2004 2005 2006 15% 2% 5% -7% 0% A) 1.45%; 3.00%. B) 2.75%; 3.00%. C) 2.75%; 5.80%. Question #52 of 93 Question ID: 1376980
For the investments shown in the table below: Investment Return (%) A 12 B 14 C 9 D 13 E 7 F 8 G 12
Which of the following statements is most accurate?
A) The median is equal to the mode.
B) The mean is equal to the mode.
C) The mean is equal to the median. Question #53 of 93 Question ID: 1376977
For the last four years, the returns for XYZ Corporation's stock have been 10.4%, 8.1%, 3.2%,
and 15.0%. The equivalent compound annual rate is: A) 9.1%. B) 9.2%. C) 8.9%. Question #54 of 93 Question ID: 1377022
Which of the following statements concerning skewness is least accurate? A distribution with:
A) skew equal to 1 is not symmetrical.
B) negative skewness has a large number of outliers on its left side.
C) positive skewness has a long left tail. Question #55 of 93 Question ID: 1376992
What is the seventh decile of the following data points? 81 84 91 97 102 108 110 112 115 121
128 135 138 141 142 147 153 155 159 162 A) 141.7. B) 141.0. C) 142.0. Question #56 of 93 Question ID: 1376960
Which of the following statements about histograms and frequency polygons is least accurate?
A frequency polygon is constructed by plotting the midpoint of each interval on the A) horizontal axis.
A histogram and a frequency polygon both plot the absolute frequency on the B) vertical axis.
C) A histogram connects points with a straight line. Question #57 of 93 Question ID: 1376961
Which of the following indicates the frequency of an interval in a frequency distribution histogram?
A) Width of the corresponding bar.
B) Horizontal logarithmic scale.
C) Height of the corresponding bar. Question #58 of 93 Question ID: 1377016
A distribution that has positive excess kurtosis is:
A) more peaked than a normal distribution.
B) less peaked than a normal distribution.
C) more skewed than a normal distribution. Question #59 of 93 Question ID: 1376983
Trina Romel, mutual fund manager, is taking over a poor-performing fund from a colleague.
Romel wants to calculate the return on the portfolio. Over the last five years, the fund's
annual percentage returns were: 25, 15, 12, -8, and –14.
Determine if the geometric return of the fund will be less than or greater than the arithmetic
return and calculate the fund's geometric return: Geometric Geometric compared to Return Arithmetic A) 12.86% greater than B) 4.96% greater than C) 4.96% less than Question #60 of 93 Question ID: 1377021
Which of the following statements concerning kurtosis is most accurate?
A) A distribution with kurtosis of +2 has fatter tails than a normal distribution.
B) A leptokurtic distribution has excess kurtosis less than zero.
C) A leptokurtic distribution has fatter tails than a normal distribution. Question #61 of 93 Question ID: 1376990
Consider the following set of stock returns: 12%, 23%, 27%, 10%, 7%, 20%,15%. The third quartile is: A) 20.0%. B) 21.5%. C) 23%. Question #62 of 93 Question ID: 1377003
Returns for a portfolio over the last four years are shown below. Treating these returns as a
sample, what is their coefficient of variation (CV)? Year Return 1 17.0% 2 12.2% 3 3.9% 4 –8.4% A) 0.55. B) 1.80. C) 1.56. Question #63 of 93 Question ID: 1376969
Which of the following tools is best suited for visualizing the relative changes over time in
the daily closing prices for two stocks? A) Heat map. B) Bar chart. C) Line chart. Question #64 of 93 Question ID: 1376994
Given the following annual returns, what is the mean absolute deviation? 2000 2001 2002 2003 2004 15% 2% 5% -7% 0% A) 0.0%. B) 3.0%. C) 5.6%. Question #65 of 93 Question ID: 1376959
An analyst presents a confusion matrix for a model that predicts loan payment defaults by companies: Actual Default Predicted default Yes No Total Yes 175 25 200 No 50 30 80 Total 225 55 280
Based on the confusion matrix, how many companies did the model incorrectly predict
would not default on their loan payments? A) 80. B) 50. C) 30. Q ti #66 f 93 Question #66 of 93 Question ID: 1377007
The mean monthly return on a security is 0.42% with a standard deviation of 0.25%. What is the coefficient of variation? A) 168%. B) 60%. C) 84%. Question #67 of 93 Question ID: 1376963
A scatter plot is best interpreted as displaying the:
A) paired observations of two variables.
B) relationship of a dependent variable with an independent variable.
C) behavior of a variable over time. Question #68 of 93 Question ID: 1377006
The mean monthly return on a sample of small stocks is 4.56% with a standard deviation of
3.56%. If the risk-free rate is 1%, what is the coefficient of variation? A) 1.28. B) 1.00. C) 0.78. Question #69 of 93 Question ID: 1376991
What does it mean to say that an observation is at the sixty-fifth percentile?
A) The observation falls within the 65th of 100 intervals.
B) 65% of all the observations are below that observation.
C) 65% of all the observations are above that observation. Question #70 of 93 Question ID: 1376971
A portfolio is equally invested in Stock A, with an expected return of 6%, and Stock B, with an
expected return of 10%, and a risk-free asset with a return of 5%. The expected return on the portfolio is: A) 7.0%. B) 7.4%. C) 8.0%. Question #71 of 93 Question ID: 1376953
Given the following frequency distribution: Return Frequency -10% up to 0% 5 0% up to 10% 7 10% up to 20% 9 20% up to 30% 6 30% up to 40% 3
What is the cumulative relative frequency of the 20% up to 30% return interval? A) 90%. B) 10%. C) 70% Question #72 of 93 Question ID: 1376954
Given the following frequency distribution: Return Frequency -10% up to 0% 5 0% up to 10% 7 10% up to 20% 9 20% up to 30% 6 30% up to 40% 3
What is the relative frequency of the 0% to 10% interval? A) 7%. B) 23.3%. C) 12%. Question #73 of 93 Question ID: 1377011
For a positively skewed distribution, the median is greater than: A) both the mode and the mean.
B) the mode, but less than the mean.
C) the mean, but less than the mode. Question #74 of 93 Question ID: 1376943
The dividend yields for several stocks over each of the last five years are best characterized as: A) cross-sectional data. B) times series data. C) panel data. Question #75 of 93 Question ID: 1376951
Use the results from the following survey of 500 firms to answer the question. Number of Employees Frequency 300 up to 400 40 400 up to 500 62 500 up to 600 78 600 up to 700 101 700 up to 800 131 800 up to 900 88
The lower boundary of the fifth interval (class) is: A) 700 B) 701 C) 800 Question #76 of 93 Question ID: 1376948
Given the following frequency distribution: Interval Frequency 10 up to 30 5 30 up to 50 10 50 up to 70 15 70 up to 90 5
Which of the following statements is least accurate?
A) The relative frequency of the second interval is less than 15%.
B) The number of observations is greater than 30.
C) The absolute frequency of the third interval is 15. Question #77 of 93 Question ID: 1377013
Twenty Level I CFA candidates in a study group took a practice exam and want to determine
the distribution of their scores. When they grade their exams they discover that one of them
skipped an ethics question and subsequently filled in the rest of his answers in the wrong
places, leaving him with a much lower score than the rest of the group. If they include this
candidate's score, their distribution will most likely: A) be positively skewed.
B) have a mode that is less than its median.
C) have a mean that is less than its median. Question #78 of 93 Question ID: 1381143
An analyst compiles the returns on Fund Q over the last four years: YearYear ReturnReturn 11 4%4% 22 3%3% 33 2%2% 44 30%30%
Which of the following will result in the lowest measure of the mean return? A) The geometric mean. B) The arithmetic mean. C) The harmonic mean. Question #79 of 93 Question ID: 1376993
What are the median and the third quintile of the following data points, respectively?
9.2%, 10.1%, 11.5%, 11.9%, 12.2%, 12.8%, 13.1%, 13.6%, 13.9%, 14.2%, 14.8%, 14.9%, 15.4% A) 13.1%; 13.6%. B) 13.1%; 13.7%. C) 12.8%; 13.6%. Question #80 of 93 Question ID: 1377009
A distribution with a mode of 10 and a range of 2 to 25 would most likely be: A) negatively skewed. B) positively skewed. C) normally distributed. Question #81 of 93 Question ID: 1376985
David Martin, CFA, recently joined Arc Financial as a portfolio manager of an emerging
markets mutual fund. For the past three years, he managed an emerging markets mutual
fund for Landmark Investments. Upon Martin's arrival, Arc Financial announces to existing
and prospective clients, "While at Landmark Investments, Martin was the senior portfolio
manager of Alpha Emerging Markets Fund. In Martin's three years as manager, this fund
outperformed its benchmark each year, as documented in recent reports by Landmark."
Does this statement violate the CFA Institute Standard of Professional Conduct related to performance presentation? A) No.
B) Yes, because the Standards prohibit showing past performance at a prior rm.
C) Yes, because Arc must present at least ve years of Martin’s performance history. Question #82 of 93 Question ID: 1376944
Which of the following is most likely an example of structured data?
A) Management’s discussion and analysis of a company’s nancial condition. B) Social media posts.
C) Daily closing prices for a stock over the past month. Question #83 of 93 Question ID: 1376996
Cameron Ryan wants to make an offer on the condominium he is renting. He takes a sample
of prices of condominiums in his development that closed in the last five months. Sample
prices are as follows (amounts are in thousands of dollars): $125, $175, $150, $155 and
$135. The sample standard deviation is closest to: A) 370.00. B) 38.47. C) 19.24. Question #84 of 93 Question ID: 1376974
Given the following set of data: 17, 3, 13 , 3, 5, 9, 8
The value 8 is most accurately described as the: A) mean. B) median. C) mode. Question #85 of 93 Question ID: 1376989
The following data points are observed returns.
4.2%, 6.8%, 7.0%, 10.9%, 11.6%, 14.4%, 17.0%, 19.0%, 22.5%
What return lies at the 70th percentile (70% of returns lie below this return)? A) 17.0%. B) 19.0%. C) 14.4%. Question #86 of 93 Question ID: 1376981
Michael Philizaire decides to calculate the geometric average of the
appreciation/deprecation of his home over the last five years. Using comparable sales and
market data he obtains from a local real estate appraiser, Philizaire calculates the year-to-
year percentage change in the value of his home as follows: 20, 15, 0, –5, –5. The geometric return is closest to: A) 4.49%. B) 0.00%. C) 11.60%. Question #87 of 93 Question ID: 1377014
If a distribution is positively skewed, then generally: A) mean > median < mode. B) mean < median < mode. C) mean > median > mode. Question #88 of 93 Question ID: 1377019
Which of the following statements concerning a distribution with positive skewness and
positive excess kurtosis is least accurate?
A) It has fatter tails than a normal distribution.
It has a lower percentage of small deviations from the mean than a normal B) distribution.
C) The mean will be greater than the mode. Question #89 of 93 Question ID: 1376984
Consider the following statements about the geometric and arithmetic means as measures
of central tendency. Which statement is least accurate?
The geometric mean may be used to estimate the average return over a one-period
A) time horizon because it is the average of one-period returns.
The geometric mean calculates the rate of return that would have to be earned each
B) year to match the actual, cumulative investment performance.
The dierence between the geometric mean and the arithmetic mean increases
C) with an increase in variability between period-to-period observations. Question #90 of 93 Question ID: 1377012
In a negatively skewed distribution, what is the order (from lowest value to highest) for the
distribution's mode, mean, and median values? A) Mode, mean, median. B) Median, mode, mean. C) Mean, median, mode. Question #91 of 93 Question ID: 1376957
Which of the following statements about the frequency distribution shown below is least accurate? Return Interval Frequency 0% to 5% 10 > 5% to 10% 20 > 10% to 15% 30 > 15% to 20% 20
A) The return intervals are mutually exclusive.
B) The relative frequency of the second return interval is 25%.
C) The cumulative absolute frequency of the fourth interval is 20. Question #92 of 93 Question ID: 1376987
A company reports its past six years' earnings growth at 10%, 14%, 12%, 10%, –10%, and
12%. The company's average compound annual growth rate of earnings is closest to: A) 8.5%. B) 8.0%. C) 7.7%. Question #93 of 93 Question ID: 1376988
The annual returns on 5 portfolio investments for the last year are shown in the following
table. What is the return on the portfolio and the geometric mean of the returns on the portfolio investments?
Investment Invested Amount Return (%) A 10,000 12 B 10,000 14 C 10,000 9 D 10,000 13 E 10,000 7 A) 11.00; 10.78. B) 11.00; 10.97. C) 11.64; 10.97.
Tài liệu liên quan:
-
Reading 10 Aggregate Output, Prices - Business English | Trường Đại học Hùng Vương
295 148 -
Reading 9 The Firm and Market Structures - Business English | Trường Đại học Hùng Vương
266 133 -
Reading 8 Topics in Demand - Business English | Trường Đại học Hùng Vương
265 133 -
Reading 7 Introduction to Linear Regression - Business English | Trường Đại học Hùng Vương
272 136 -
Reading 3 Probability Concepts - Business English | Trường Đại học Hùng Vương
295 148