Reading 5 Sampling and Estimation - Business English | Trường Đại học Hùng Vương
Reading 5 Sampling and Estimation - Business English | Trường Đại học Hùng Vương được sưu tầm và soạn thảo dưới dạng file PDF để gửi tới các bạn sinh viên cùng tham khảo, ôn tập đầy đủ kiến thức, chuẩn bị cho các buổi học thật tốt. Mời bạn đọc đón xem!
Môn: Business English( TA1901) 89 tài liệu
Trường: Trường Đại học Hùng Vương 164 tài liệu
Tác giả:


Preview text:
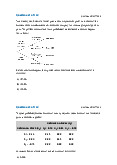
Question #1 of 75 Question ID: 1377253 Student's t-Distribution
Level of Significance for One-Tailed Test df
0.100 0.050 0.025 0.01 0.005 0.0005
Level of Significance for Two-Tailed Test df 0.20 0.10 0.05 0.02 0.01 0.001
40 1.303 1.684 2.021 2.423 2.704 3.551
60 1.296 1.671 2.000 2.390 2.660 3.460
120 1.289 1.658 1.980 2.358 2.617 3.373
The approximate 99% confidence interval for the population mean based on a sample of 60
returns with a mean of 7% and a sample standard deviation of 25% is closest to: A) 1.584% to 14.584%. B) 0.546% to 13.454%. C) -1.584% to 15.584%. Question #2 of 75 Question ID: 1377272 Student's t-Distribution
Level of Significance for One-Tailed Test df
0.100 0.050 0.025 0.01 0.005 0.0005
Level of Significance for Two-Tailed Test df 0.20 0.10 0.05 0.02 0.01 0.001
40 1.303 1.684 2.021 2.423 2.704 3.551
60 1.296 1.671 2.000 2.390 2.660 3.460
120 1.289 1.658 1.980 2.358 2.617 3.373
The average salary for a sample of 61 CFA charterholders with 10 years of experience is
$200,000, and the sample standard deviation is $80,000. Assume the population is normally
distributed. Which of the following is a 99% confidence interval for the population mean
salary of CFA charterholders with 10 years of experience? A) $160,000 to $240,000. B) $172,754 to $227,246. C) $172,514 to $227,486. Question #3 of 75 Question ID: 1377249
A range of estimated values within which the actual value of a population parameter will lie
with a given probability of 1 − α is a(n):
A) (1 − α) percent condence interval. B) α percent point estimate.
C) α percent condence interval. Question #4 of 75 Question ID: 1377261
The average U.S. dollar/Euro exchange rate from a sample of 36 monthly observations is
$1.00/Euro. The population variance is 0.49. What is the 95% confidence interval for the
mean U.S. dollar/Euro exchange rate? A) $0.5100 to $1.4900. B) $0.7713 to $1.2287. C) $0.8075 to $1.1925. Question #5 of 75 Question ID: 1377286
When sampling from a population, the most appropriate sample size:
minimizes the sampling error and the standard deviation of the sample statistic
A) around its population value. B) is at least 30.
involves a trade-o between the cost of increasing the sample size and the value of
C) increasing the precision of the estimates. Question #6 of 75 Question ID: 1377266
A sample of 100 individual investors has a mean portfolio value of $28,000 with a standard
deviation of $4,250. The 95% confidence interval for the population mean is closest to: A) $19,500 to $28,333. B) $27,575 to $28,425. C) $27,159 to $28,842. Question #7 of 75 Question ID: 1381151
An auditor who decides to handpick rather than randomly select transactions to examine for
instances of fraud is most likely using: A) cluster sampling. B) judgmental sampling. C) convenience sampling. Question #8 of 75 Question ID: 1377284
The practice of repeatedly using the same database to search for patterns until one is found is most likely to result in: A) look-ahead bias. B) data snooping bias. C) sample selection bias. Question #9 of 75 Question ID: 1377233
The sample mean return of Bartlett Co. is 3% and the standard deviation is 6% based on 30
monthly returns. What is the confidence interval of a two tailed z-test of the population
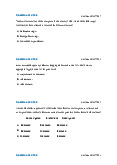
mean with a 5% level of significance? A) 0.85 to 5.15. B) 2.61 to 3.39. C) 1.90 to 4.10. Question #10 of 75 Question ID: 1377228
The central limit theorem states that, for any distribution, as n gets larger, the sampling distribution:
A) approaches a normal distribution. B) approaches the mean. C) becomes larger. Question #11 of 75 Question ID: 1377282
The average annual return over 20 years for a sector of mutual funds, calculated for the
population of funds in that sector that have 20 years of performance history, is most likely to:
A) overstate returns for the fund sector.
B) understate returns for the fund sector.
C) fairly state returns for the fund sector. Question #12 of 75 Question ID: 1377234
From a population with a standard deviation of 15, a sample of 25 observations is taken. The
standard error of the sample mean is: A) 1.67. B) 0.60. C) 3.00. Question #13 of 75 Question ID: 1377281
A study reports that from 2002 to 2004 the average return on growth stocks was twice as
large as that of value stocks. These results most likely reflect: A) time-period bias. B) survivorship bias. C) look-ahead bias. Question #14 of 75 Question ID: 1377250
Which of the following statements about sampling and estimation is most accurate?
The probability that a parameter lies within a range of estimated values is given by A) α.
The standard error of the sample means when the standard deviation of the
B) population is known equals σ / √n, where σ = sample standard deviation adjusted by n − 1.
The standard error of the sample means when the standard deviation of the
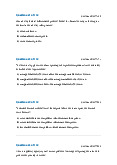
C) population is unknown equals s / √n, where s = sample standard deviation. Question #15 of 75 Question ID: 1377238
If the number of offspring for females of a certain mammalian species has a mean of 16.4
and a standard deviation of 3.2, what will be the standard error of the sample mean for a
survey of 25 females of the species? A) 0.07. B) 1.56. C) 0.64. Question #16 of 75 Question ID: 1377259
A nursery sells trees of different types and heights. Suppose that 75 trees chosen at random
are sold for planting at City Hall. These 75 trees average 60 inches in height with a standard deviation of 16 inches.
Using this information, construct a 95% confidence interval for the mean height of all trees in the nursery. A) 60 ± 1.96(1.85). B) 60 ± 1.96(16). C) 0.8 ± 1.96(16). Question #17 of 75 Question ID: 1377248
Which of the following characterizes the typical construction of a confidence interval most accurately?
A) Point estimate +/- (Reliability factor × Standard error).
B) Standard error +/- (Point estimate / Reliability factor).
C) Point estimate +/- (Standard error / Reliability factor). Question #18 of 75 Question ID: 1377222
Thomas Merton, a car industry analyst, wants to investigate a relationship between the
types of ads used in advertising campaigns and sales to customers in certain age groups. In
order to make sure he includes manufacturers of all sizes, Merton divides the industry into
four size groups and draws random samples from each group. What sampling method is Merton using?
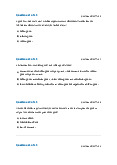
A) Stratied random sampling. B) Cross-sectional sampling. C) Simple random sampling. Question #19 of 75 Question ID: 1377255
A sample of 25 junior financial analysts gives a mean salary (in thousands) of 60. Assume the
population variance is known to be 100. A 90% confidence interval for the mean starting
salary of junior financial analysts is most accurately constructed as: A) 60 ± 1.645(10). B) 60 ± 1.645(4). C) 60 ± 1.645(2). Question #20 of 75 Question ID: 1377251
Which of the following statements about sampling and estimation is most accurate?
A) Time-series data are observations over individual units at a point in time.
A point estimate is a single estimate of an unknown population parameter
B) calculated as a sample mean.
A condence interval estimate consists of a range of values that bracket the
C) parameter with a specied level of probability, 1 − β. Question #21 of 75 Question ID: 1377243
The sample mean is a consistent estimator of the population mean because the:
sampling distribution of the sample mean has the smallest variance of any other
A) unbiased estimators of the population mean.
B) expected value of the sample mean is equal to the population mean.
sample mean provides a more accurate estimate of the population mean as the C) sample size increases. Question #22 of 75 Question ID: 1377239
A traffic engineer is trying to measure the effects of carpool-only lanes on the expressway.
Based on a sample of 100 cars at rush hour, he finds that the mean number of occupants
per car is 2.5, and the sample variance is 0.16. What is the standard error of the sample mean? A) 0.016. B) 5.68. C) 0.04. Question #23 of 75 Question ID: 1377246
Shawn Choate wants to choose a variable of study that has the most desirable statistical
properties. The statistic he is presently considering has the following characteristics:
The expected value of the sample mean is equal to the population mean.
The variance of the sampling distribution is smaller than that for other estimators of the parameter.
As the sample size increases, the standard error of the sample mean increases and
the sampling distribution is centered more closely on the mean. Choate's estimator is: A) unbiased and consistent. B) unbiased and ecient. C) ecient and consistent. Question #24 of 75 Question ID: 1377267 Student's t-Distribution
Level of Significance for One-Tailed Test
df 0.100 0.050 0.025 0.01 0.005 0.0005
Level of Significance for Two-Tailed Test df 0.20 0.10 0.05 0.02 0.01 0.001
18 1.330 1.734 2.101 2.552 2.878 3.922
19 1.328 1.729 2.093 2.539 2.861 3.883
20 1.325 1.725 2.086 2.528 2.845 3.850
A traffic engineer is trying to measure the effects of carpool-only lanes on the expressway.
Based on a sample of 20 cars at rush hour, he finds that the mean number of occupants per
car is 2.5, with a standard deviation of 0.4. If the population is normally distributed, a 95%
confidence interval for the number of occupants per car is: A) 2.313 to 2.687. B) 2.387 to 2.613. C) 2.410 to 2.589. Question #25 of 75 Question ID: 1377220
An equity analyst needs to select a representative sample of manufacturing stocks. Starting
with the population of all publicly traded manufacturing stocks, she classifies each stock into
one of the 20 industry groups that form the Index of Industrial Production for the
manufacturing industry. She then selects four stocks from each industry. The sampling
method the analyst is using is best characterized as:
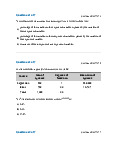
A) stratied random sampling. B) systematic sampling. C) random sampling. Question #26 of 75 Question ID: 1377270 Student's t-Distribution
Level of Significance for One-Tailed Test df
0.100 0.050 0.025 0.01 0.005 0.0005
Level of Significance for Two-Tailed Test df 0.20 0.10 0.05 0.02 0.01 0.001
40 1.303 1.684 2.021 2.423 2.704 3.551
60 1.296 1.671 2.000 2.390 2.660 3.460
120 1.289 1.658 1.980 2.358 2.617 3.373
From a sample of 41 monthly observations of the S&P Mid-Cap index, the mean monthly
return is 1% and the sample variance is 36. For which of the following intervals can one be
closest to 95% confident that the population mean is contained in that interval? A) 1.0% ± 1.6%. B) 1.0% ± 1.9%. C) 1.0% ± 6.0%. Question #27 of 75 Question ID: 1377275
Which of the following statements regarding confidence intervals is most accurate?
A) The higher the signicance level, the wider the condence interval.
B) The lower the degree of condence, the wider the condence interval.
C) The lower the signicance level, the wider the condence interval. Question #28 of 75 Question ID: 1377256 Cumulative Z-Table z 0.05 0.06 0.07 0.08 0.09 2.4 0.9929 0.9931 0.9932 0.9934 0.9936 2.5 0.9946 0.9948 0.9949 0.9951 0.9952 2.6 0.9960 0.9961 0.9962 0.9963 0.9964 2.7 0.9970 0.9971 0.9972 0.9973 0.9974
The average return on the Russell 2000 index for 121 monthly observations was 1.5%. The
population standard deviation is assumed to be 8.0%. What is a 99% confidence interval for
the mean monthly return on the Russell 2000 index? A) 0.1% to 2.9%. B) -0.4% to 3.4%. C) -6.5% to 9.5%. Question #29 of 75 Question ID: 1377273
In which one of the following cases is the t-statistic the appropriate one to use in the
construction of a confidence interval for the population mean?
The distribution is normal, the population variance is known, and the sample size is A) less than 30.
The distribution is nonnormal, the population variance is known, and the sample B) size is at least 30.
The distribution is nonnormal, the population variance is unknown, and the sample C) size is at least 30. Question #30 of 75 Question ID: 1377274
Which of the following would result in a wider confidence interval? A:
A) higher degree of condence. B) higher alpha level.
C) greater level of signicance. Question #31 of 75 Question ID: 1377244
The sample mean is an unbiased estimator of the population mean because the:
sample mean provides a more accurate estimate of the population mean as the A) sample size increases.
B) expected value of the sample mean is equal to the population mean.
sampling distribution of the sample mean has the smallest variance of any other
C) unbiased estimators of the population mean. Question #32 of 75 Question ID: 1377254 Student's t-Distribution
Level of Significance for One-Tailed Test df
0.100 0.050 0.025 0.01 0.005 0.0005
Level of Significance for Two-Tailed Test df 0.20 0.10 0.05 0.02 0.01 0.001
30 1.310 1.697 2.042 2.457 2.750 3.646
40 1.303 1.684 2.021 2.423 2.704 3.551
60 1.296 1.671 2.000 2.390 2.660 3.460
120 1.289 1.658 1.980 2.358 2.617 3.373
Based on Student's t-distribution, the 95% confidence interval for the population mean
based on a sample of 40 interest rates with a sample mean of 4% and a sample standard
deviation of 15% is closest to: A) -0.794% to 8.794%. B) -0.851% to 8.851%. C) 1.261% to 6.739%. Question #33 of 75 Question ID: 1377285
A scientist working for a pharmaceutical company tries many models using the same data
before reporting the one that shows that the given drug has no serious side effects.
Thescientist's results are most likely to exhibit: A) data snooping bias. B) look-ahead bias. C) sample selection bias. Question #34 of 75 Question ID: 1377231
If the true mean of a population is 16.62, according to the central limit theorem, the mean of
the distribution of sample means, for all possible sample sizes n will be: A) 16.62.
B) indeterminate for sample with n < 30. C) 16.62 / √n. Question #35 of 75 Question ID: 1377242
A statistical estimator is unbiased if:
A) the expected value of the estimator is equal to the population parameter.
B) an increase in sample size decreases the standard error.
C) the variance of its sampling distribution is smaller than that of all other estimators. Question #36 of 75 Question ID: 1377265
The average return on small stocks over the period 1926-1997 was 17.7%, and the standard
deviation of the sample was 33.9%. Assuming returns are normally distributed, the 95%
confidence interval for the return on small stocks next year is: A) 16.8% to 18.6%. B) –16.2% to 51.6%. C) –48.7% to 84.1%. Question #37 of 75 Question ID: 1377276
In a confidence interval for the mean of a normally distributed population with a sample size
of 25, it is least likely that:
A) no test statistic is available.
B) a t-distributed test statistic is appropriate if the population variance is unknown.
C) a z-distributed test statistic is appropriate if the population variance is known. Question #38 of 75 Question ID: 1377227
According to the Central Limit Theorem, the distribution of the sample means is approximately normal if: A) the sample size n > 30.
B) the standard deviation of the population is known.
C) the underlying population is normal. Question #39 of 75 Question ID: 1377236
A sample of size n = 25 is selected from a normal population. This sample has a mean of 15
and a sample variance of 4. What is the standard error of the sample mean? A) 0.4. B) 0.8. C) 2.0. Question #40 of 75 Question ID: 1377224
Stratified random sampling is most often used to preserve the distribution of risk factors
when creating a portfolio to track an index of: A) stocks. B) corporate bonds. C) alternative investments. Question #41 of 75 Question ID: 1377262
Which of the following statements about a confidence interval for a population mean is most accurate?
For a sample size of 30, using a t-statistic will result in a wider condence interval for
A) a population mean than using a z-statistic.
If the population variance is unknown, a large sample size is required in order to
B) estimate a condence interval for the population mean.
When a z-statistic is acceptable, a 95% condence interval for a population mean is
C) the sample mean plus-or-minus 1.96 times the sample standard deviation. Question #42 of 75 Question ID: 1377237
The following data are available on a sample of advertising budgets of 81 U.S. manufacturing
companies: The mean budget is $10 million. The sample variance is 36 million. The standard error of the sample mean is: A) $400. B) $1,111. C) $667. Question #43 of 75 Question ID: 1377279
An article in a trade journal suggests that a strategy of buying the seven stocks in the S&P
500 with the highest earnings-to-price ratio at the end of the calendar year and holding
them until March 20 of the following year produces significant trading profits. Upon reading
further, you discover that the study is based on data from 1993 to 1997, and the earnings-to-
price ratio is calculated using the stock price on December 31 of each year and the annual
reported earnings per share for that year. Which of the following biases is least likely to
influence the reported results? A) Look-ahead bias. B) Survivorship bias. C) Time-period bias. Question #44 of 75 Question ID: 1377263
A traffic engineer is trying to measure the effects of carpool-only lanes on the expressway.
Based on a sample of 1,000 cars at rush hour, he finds that the mean number of occupants
per car is 2.5, with a standard deviation of 0.4. Assuming that the population is normally
distributed, what is the confidence interval at the 5% significance level for the number of occupants per car? A) 2.288 to 2.712. B) 2.475 to 2.525. C) 2.455 to 2.555. Question #45 of 75 Question ID: 1377271 Student's t-Distribution
Level of Significance for One-Tailed Test df
0.100 0.050 0.025 0.01 0.005 0.0005
Level of Significance for Two-Tailed Test df 0.20 0.10 0.05 0.02 0.01 0.001
30 1.310 1.697 2.042 2.457 2.750 3.646
40 1.303 1.684 2.021 2.423 2.704 3.551
60 1.296 1.671 2.000 2.390 2.660 3.460
120 1.289 1.658 1.980 2.358 2.617 3.373
From a sample of 41 orders for an on-line bookseller, the average order size is $75, and the
sample standard deviation is $18. Assume the distribution of orders is normal. For which
interval can one be exactly 90% confident that the population mean is contained in that interval? A) $71.29 to 78.71. B) $74.24 to $75.76. C) $70.27 to $79.73. Question #46 of 75 Question ID: 1377225
Which of the following statements regarding the central limit theorem (CLT) is least accurate? The CLT:
A) holds for any population distribution, assuming a large sample size.
states that for a population with mean µ and variance σ2, the sampling distribution
B) of the sample means for any sample of size n will be approximately normally distributed.
gives the variance of the distribution of sample means as σ2 / n, where σ2 is the
C) population variance and n is the sample size. Question #47 of 75 Question ID: 1377287
To test the hypothesis that actively managed international equities mutual funds
outperformed an appropriate benchmark index, an analyst selects all of the current
international equities funds that have been in existence for at least 10 years. His test results
will most likely be subject to: A) survivorship bias. B) look-ahead bias. C) time period bias. Question #48 of 75 Question ID: 1377247
The range of possible values in which an actual population parameter may be observed at a
given level of probability is known as a: A) degree of condence. B) signicance level. C) condence interval. Question #49 of 75 Question ID: 1377226
The central limit theorem concerns the sampling distribution of the: A) population mean. B) sample standard deviation. C) sample mean. Question #50 of 75 Question ID: 1377218
Sampling error can be defined as:
A) rejecting the null hypothesis when it is true.
the dierence between a sample statistic and its corresponding population B) parameter.
C) the standard deviation of a sampling distribution of the sample means. Question #51 of 75 Question ID: 1377258
What is the 95% confidence interval for a population mean with a known population
variance of 9, based on a sample of 400 observations with mean of 96? A) 95.706 to 96.294. B) 95.613 to 96.387. C) 95.118 to 96.882. Question #52 of 75 Question ID: 1377257
Fred's Correspondence College wants to construct a 90% confidence interval for the mean
starting salaries of its graduates. A sample of 100 recent graduates has a mean of $50,000
and a standard deviation of $30,000. Assuming the population of graduates' starting salaries
is normally distributed, the College's confidence interval is closest to: A) $0 to $100,000. B) $45,000 to $55,000. C) $44,000 to $56,000. Question #53 of 75 Question ID: 1377232
Joseph Lu calculated the average return on equity at 14% for a sample of 64 companies. The
sample standard deviation is 16%. The standard error of the mean is closest to: A) 0.0025. B) 0.0175. C) 0.0200. Question #54 of 75 Question ID: 1377277
Which of the following is the best method to avoid data snooping bias when testing a profitable trading strategy?
A) Use a sample free of survivorship bias.
B) Test the strategy on a dierent data set than the one used to develop the rules.
C) Increase the sample size to at least 30 observations per year. Question #55 of 75 Question ID: 1377245
An efficient estimator is most accurately described as one that:
A) becomes more accurate as the sample size increases.
B) has an expected value equal to the parameter it is estimating.
has a sampling distribution with a smaller variance than that of all other unbiased
C) estimators of the parameter. Question #56 of 75 Question ID: 1377278
An analyst has reviewed market data for returns from 1980–1990 extensively, searching for
patterns in the returns. She has found that when the end of the month falls on a Saturday,
there are usually positive returns on the following Thursday. She has engaged in: A) time period bias. B) biased selection. C) data snooping. Question #57 of 75 Question ID: 1377280
An analyst has compiled stock returns for the first 10 days of the year for a sample of firms
and estimated the correlation between these returns and changes in book value for these
firms over the just ended year. What objection could be raised to such a correlation being used as a trading strategy?
A) Use of year-end values causes time-period bias.
B) The study suers from look-ahead bias.
C) Use of year-end values causes sample selection bias. Question #58 of 75 Question ID: 1377283
A research paper that reports finding a profitable trading strategy without providing any
discussion of an economic theory that makes predictions consistent with the empirical
results is most likely evidence of: A) data snooping.
B) a non-normal population distribution.
C) a sample that is not large enough. Question #59 of 75 Question ID: 1377264 Student's t-Distribution
Level of Significance for One-Tailed Test
df 0.100 0.050 0.025 0.01 0.005 0.0005
Level of Significance for Two-Tailed Test df 0.20 0.10 0.05 0.02 0.01 0.001
24 1.318 1.711 2.064 2.492 2.797 3.745
25 1.316 1.708 2.060 2.485 2.787 3.725
26 1.315 1.706 2.056 2.479 2.779 3.707
27 1.314 1.703 2.052 2.473 2.771 3.690
Books Fast, Inc., prides itself on shipping customer orders quickly. Books Fast sampled 27 of
its customers within a 200-mile radius and found a mean delivery time of 76 hours, with a
sample standard deviation of 6 hours. Based on this sample and assuming a normal
distribution of delivery times, what is the confidence interval for the mean delivery time at 5% significance? A) 65.75 to 86.25 hours. B) 68.50 to 83.50 hours. C) 73.63 to 78.37 hours. Question #60 of 75 Question ID: 1377235
Melissa Cyprus, CFA, is conducting an analysis of inventory management practices in the
retail industry. She assumes the population cross-sectional standard deviation of inventory
turnover ratios is 20. How large a random sample should she gather in order to ensure a
standard error of the sample mean of 4? A) 20. B) 25. C) 80. Question #61 of 75 Question ID: 1377219
Which of the following is least likely a step in stratified random sampling?
A) The population is divided into strata based on some classication scheme.
B) The size of each sub-sample is selected to be the same across strata.
C) The sub-samples are pooled to create the complete sample. Question #62 of 75 Question ID: 1377288
A study finds that stocks with low price-to-book-value ratios, using end-of-year stock prices
and book values per share, have positive abnormal returns in January on average. This study most likely suffers from: A) sample selection bias. B) look-ahead bias. C) time-period bias. Question #63 of 75 Question ID: 1377229
Which of the following is least likely a prediction of the central limit theorem?
The mean of the sampling distribution of the sample means will be equal to the A) population mean.
The variance of the sampling distribution of sample means will approach the
B) population variance divided by the sample size.
C) The standard error of the sample mean will increase as the sample size increases. Question #64 of 75 Question ID: 1377269 Student's t-Distribution
Level of Significance for One-Tailed Test
df 0.100 0.050 0.025 0.01 0.005 0.0005
Level of Significance for Two-Tailed Test df 0.20 0.10 0.05 0.02 0.01 0.001
24 1.318 1.711 2.064 2.492 2.797 3.745
25 1.316 1.708 2.060 2.485 2.787 3.725
26 1.315 1.706 2.056 2.479 2.779 3.707
27 1.314 1.703 2.052 2.473 2.771 3.690
A random sample of 25 Indiana farms had a mean number of cattle per farm of 27 with a
sample standard deviation of five. Assuming the population is normally distributed, what
would be the 95% confidence interval for the number of cattle per farm? A) 23 to 31. B) 25 to 29. C) 22 to 32. Question #65 of 75 Question ID: 1377217
Which of the following statements about sampling errors is least accurate?
Sampling error is the dierence between a sample statistic and its corresponding A) population parameter.
Sampling error is the error made in estimating the population mean based on a B) sample mean.
Sampling errors are errors due to the wrong sample being selected from the C) population. Question #66 of 75 Question ID: 1377223
An analyst is asked to select a sample of securities from those included in a broad-based
index that can be expected to have the same return as the index while preserving the key
risk exposures of the index. The analyst should most appropriately use:
A) constrained random sampling. B) simple random sampling.
C) stratied random sampling. Question #67 of 75 Question ID: 1377221
An analyst divides the population of U.S. stocks into 10 equally sized sub-samples based on
market value of equity. Then he takes a random sample of 50 from each of the 10 sub-
samples and pools the data to create a sample of 500. This is an example of: A) simple random sampling.
B) stratied random sampling.
C) systematic cross-sectional sampling. Question #68 of 75 Question ID: 1377241
As a sample size is increased, which of the following statements best describes the change in
the standard error of the sample mean and the size of the confidence interval for the true mean?
A) The standard error decreases and the condence interval narrows.
B) The condence interval widens while the standard error decreases.
C) The standard error increases while the condence interval narrows. Question #69 of 75 Question ID: 1381150
To estimate the average time Level I CFA candidates spend preparing for theexam, an
employee of ABC Investments decides to randomly survey candidates who work at ABC's
offices, although he is unsure how well they represent the candidate population. This is most likely an example of: A) judgmental sampling. B) convenience sampling. C) stratied sampling. Question #70 of 75 Question ID: 1377240
From a population of 5,000 observations, a sample of n = 100 is selected. Calculate the
standard error of the sample mean if the population variance is 2500. A) 0.2. B) 250. C) 5.00. Question #71 of 75 Question ID: 1377230
Suppose the mean debt/equity ratio of the population of all banks in the United States is 20
and the population variance is 25. A banking industry analyst uses a computer program to
select a random sample of 50 banks from this population and compute the sample mean.
The program repeats this exercise 1000 times and computes the sample mean each time.
According to the central limit theorem, the sampling distribution of the 1000 sample means
will be approximately normal if the population of bank debt/equity ratios has:
A) any probability distribution.
B) a normal distribution, because the sample is random.
C) a Student's t-distribution, because the sample size is greater than 30. Question #72 of 75 Question ID: 1377216 Sampling error is the:
dierence between the point estimate of the mean and the mean of the sampling A) distribution.
B) estimation error created by using a non-random sample.
C) dierence between a sample statistic and its corresponding population parameter. Question #73 of 75 Question ID: 1377268
A local high school basketball team had 18 home games this season and averaged 58 points
per game. If we assume that the number of points made in home games is normally
distributed, which of the following is most likely the range of points for a confidence interval of 90%? A) 26 to 80. B) 24 to 78. C) 34 to 82. Question #74 of 75 Question ID: 1377252
Which of the following statements about confidence intervals is least accurate? A confidence interval:
A) expands as the probability that a point estimate falls within the interval decreases.
B) has a signicance level that is equal to one minus the degree of condence.
C) is constructed by adding and subtracting a given amount from a point estimate. Question #75 of 75 Question ID: 1377260
A sample size of 25 is selected from a normal population. This sample has a mean of 15 and the population variance is 4.
Using this information, construct a 95% confidence interval for the population mean, m. A) 15 ± 1.96(0.4). B) 15 ± 1.96(0.8). C) 15 ± 1.96(2).
Tài liệu liên quan:
-
Reading 10 Aggregate Output, Prices - Business English | Trường Đại học Hùng Vương
295 148 -
Reading 9 The Firm and Market Structures - Business English | Trường Đại học Hùng Vương
266 133 -
Reading 8 Topics in Demand - Business English | Trường Đại học Hùng Vương
265 133 -
Reading 7 Introduction to Linear Regression - Business English | Trường Đại học Hùng Vương
272 136 -
Reading 3 Probability Concepts - Business English | Trường Đại học Hùng Vương
295 148