Reading 6 Hypothesis Testing - Business English | Trường Đại học Hùng Vương
Reading 6 Hypothesis Testing - Business English | Trường Đại học Hùng Vương được sưu tầm và soạn thảo dưới dạng file PDF để gửi tới các bạn sinh viên cùng tham khảo, ôn tập đầy đủ kiến thức, chuẩn bị cho các buổi học thật tốt. Mời bạn đọc đón xem!
Môn: Business English( TA1901) 89 tài liệu
Trường: Trường Đại học Hùng Vương 164 tài liệu
Tác giả:


Preview text:
Question #1 of 83 Question ID: 1377370
Which of the following statements about parametric and nonparametric tests is least accurate?
The test of the mean of the dierences is used when performing a paired A) comparison.
The test of the dierence in means is used when you are comparing means from B) two independent samples.
C) Nonparametric tests rely on population parameters. Question #2 of 83 Question ID: 1377329
Which of the following statements about hypothesis testing is most accurate?
If you can disprove the null hypothesis, then you have proven the alternative A) hypothesis.
B) The power of a test is one minus the probability of a Type I error.
C) The probability of a Type I error is equal to the signicance level of the test. Question #3 of 83 Question ID: 1377360
The test of the equality of the variances of two normally distributed populations requires the
use of a test statistic that is: A) z-distributed. B) Chi-squared distributed. C) F-distributed. Question #4 of 83 Question ID: 1377350
An analyst plans to use the following test statistic:
This test statistic is appropriate for a hypothesis about:
the equality of two population means of two normally distributed populations
A) based on independent samples.
B) the population mean of a normal distribution with unknown variance.
C) the mean dierence of two normal populations. Question #5 of 83 Question ID: 1377355
An analyst wants to determine whether the mean returns on two stocks over the last year
were the same or not. What test should she use, assuming returns are normally distributed? A) Chi-square test. B) Dierence in means test. C) Paired comparisons test. Question #6 of 83 Question ID: 1377363
The use of the F-distributed test statistic, F = s 2 / s 2, to compare the variances of two 1 2
populations least likely requires which of the following?
A) populations are normally distributed.
B) two samples are of the same size.
C) samples are independent of one another. Question #7 of 83 Question ID: 1377348
In order to test if the mean IQ of employees in an organization is greater than 100, a sample
of 30 employees is taken. The sample value of the computed z-statistic = 3.4. The
appropriate decision at a 5% significance level is to:
reject the null hypotheses and conclude that the population mean is greater than A) 100.
B) reject the null hypothesis and conclude that the population mean is equal to 100.
reject the null hypothesis and conclude that the population mean is not equal to C) 100. Question #8 of 83 Question ID: 1377289
Which one of the following best characterizes the alternative hypothesis? The alternative hypothesis is usually the:
A) hypothesis to be proved through statistical testing. B) hoped-for outcome.
C) hypothesis that is accepted after a statistical test is conducted. Question #9 of 83 Question ID: 1377291
Which of the following statements least accurately describes the procedure for testing a hypothesis?
A) Select the level of signicance, formulate the decision rule, and make a decision.
B) Develop a hypothesis, compute the test statistic, and make a decision.
Compute the sample value of the test statistic, set up a rejection (critical) region, and C) make a decision. Question #10 of 83 Question ID: 1377318
Which of the following statements about hypothesis testing is least accurate?
A) A Type II error is the probability of failing to reject a null hypothesis that is not true.
A Type I error is the probability of rejecting the null hypothesis when the null B) hypothesis is false.
C) The signicance level is the probability of making a Type I error. Question #11 of 83 Question ID: 1377327
If the null hypothesis is innocence, then the statement "It is better that the guilty go free,
than the innocent are punished" is an example of preferring a:
A) greater percentage of signicance.
B) Type I error over a Type II error.
C) Type II error over a Type I error. Question #12 of 83 Question ID: 1377299
Brian Ci believes that the average return on equity in the airline industry, µ, is less than 5%.
What are the appropriate null (H ) and alternative (H ) hypotheses to test this belief? 0 a
A) H0: µ < 0.05 versus H : µ > 0.05. a
B) H0: µ < 0.05 versus H : µ 0.05. a ≥
C) H0: µ ≥ 0.05 versus H : µ < 0.05. a Question #13 of 83 Question ID: 1377341
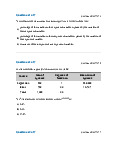
Segment of the table of critical values for Student's t-distribution:
Level of Significance for a One-Tailed Test df 0.050 0.025
Level of Significance for a Two-Tailed Test df 0.10 0.05 18 1.734 2.101 19 1.729 2.093
Simone Mak is a television network advertising executive. One of her responsibilities is
selling commercial spots for a successful weekly sitcom. If the average share of viewers for
this season exceeds 8.5%, she can raise the advertising rates by 50% for the next season.
The population of viewer shares is normally distributed. A sample of the past 19 episodes
results in a mean share of 9.6% with a standard deviation of 10.0%. If Mak is willing to make
a Type 1 error with a 5% probability, which of the following statements is most accurate?
Mak cannot charge a higher rate next season for advertising spots based on this A) sample.
The null hypothesis Mak needs to test is that the mean share of viewers is greater B) than 8.5%.
With an unknown population variance and a small sample size, Mak cannot test a
C) hypothesis based on her sample data. Question #14 of 83 Question ID: 1377340
Which of the following statements about testing a hypothesis using a Z-test is least accurate?
If the calculated Z-statistic lies outside the critical Z-statistic range, the null A) hypothesis can be rejected.
B) The calculated Z-statistic determines the appropriate signicance level to use.
The condence interval for a two-tailed test of a population mean at the 5% level of
C) signicance is that the sample mean falls between ±1.96 σ/√n of the null hypothesis value. Question #15 of 83 Q ti ID 1377328 Question #15 of 83 Question ID: 1377328
An analyst calculates that the mean of a sample of 200 observations is 5. The analyst wants
to determine whether the calculated mean, which has a standard error of the sample
statistic of 1, is significantly different from 7 at the 5% level of significance. Which of the
following statements is least accurate?:
The mean observation is signicantly dierent from 7, because the calculated Z-
A) statistic is less than the critical Z-statistic.
B) The null hypothesis would be: H : mean = 7. 0
C) The alternative hypothesis would be H : mean > 7. a Question #16 of 83 Question ID: 1377366
Critical values from Student's t-distribution for a two-tailed test at a 5% significance level: df 28 2.048 29 2.045 30 2.042
A researcher wants to test a hypothesis that two variables have a population correlation
coefficient equal to zero. For a sample size of 30, the appropriate critical value for this test is plus-or-minus: A) 2.045 B) 2.048 C) 2.042 Question #17 of 83 Question ID: 1377335
An analyst is testing the hypothesis that the mean excess return from a trading strategy is
less than or equal to zero. The analyst reports that this hypothesis test produces a p-value of
0.034. This result most likely suggests that the:
A) best estimate of the mean excess return produced by the strategy is 3.4%.
B) null hypothesis can be rejected at the 5% signicance level.
C) smallest signicance level at which the null hypothesis can be rejected is 6.8%. Question #18 of 83 Question ID: 1377297
Which one of the following is the most appropriate set of hypotheses to use when a
researcher is trying to demonstrate that a return is greater than the risk-free rate? The null hypothesis is framed as a:
less than statement and the alternative hypothesis is framed as a greater than or A) equal to statement.
greater than statement and the alternative hypothesis is framed as a less than or B) equal to statement.
less than or equal to statement and the alternative hypothesis is framed as a C) greater than statement. Question #19 of 83 Question ID: 1377315
Which of the following statements regarding hypothesis testing is least accurate?
A) The signicance level is the risk of making a type I error.
B) A type II error is the acceptance of a hypothesis that is actually false.
C) A type I error is acceptance of a hypothesis that is actually false. Question #20 of 83 Question ID: 1377296
Jill Woodall believes that the average return on equity in the retail industry, µ, is less than
15%. If Woodall wants to examine the data statistically, what are the appropriate null (H ) 0
and alternative (H ) hypotheses for her study? a
A) H0: µ < 0.15 versus H : µ 0.15. a ≥
B) H0: µ < 0.15 versus H : µ > 0.15. a
C) H0: µ ≥ 0.15 versus H : µ < 0.15. a Question #21 of 83 Question ID: 1377317
John Jenkins, CFA, is performing a study on the behavior of the mean P/E ratio for a sample
of small-cap companies. Which of the following statements is most accurate?
A Type I error represents the failure to reject the null hypothesis when it is, in fact, A) false.
One minus the condence level of the test represents the probability of making a B) Type II error.
C) The signicance level of the test represents the probability of making a Type I error. Question #22 of 83 Question ID: 1377290
Which of the following is the correct sequence of events for testing a hypothesis?
State the hypothesis, formulate the decision rule, select the level of signicance,
A) compute the test statistic, and make a decision.
State the hypothesis, select the level of signicance, formulate the decision rule,
B) compute the test statistic, and make a decision.
State the hypothesis, select the level of signicance, compute the test statistic,
C) formulate the decision rule, and make a decision. Question #23 of 83 Question ID: 1377310
A survey is taken to determine whether the average starting salaries of CFA charterholders is
equal to or greater than $54,000 per year. Assuming a normal distribution, what is the test
statistic given a sample of 75 newly acquired CFA charterholders with a mean starting salary
of $57,000 and a standard deviation of $1,300? A) 2.31. B) -19.99. C) 19.99. Question #24 of 83 Question ID: 1377362
The variance of 100 daily stock returns for Stock A is 0.0078. The variance of 90 daily stock
returns for Stock B is 0.0083. Using a 5% level of significance, the critical value for this test is
1.61. The most appropriate conclusion regarding whether the variance of Stock A is different
from the variance of Stock B is that the:
A) variance of Stock B is signicantly greater than the variance of Stock A. B) variances are equal. C) variances are not equal. Question #25 of 83 Question ID: 1377322
For a two-tailed test of hypothesis involving a z-distributed test statistic and a 5% level of
significance, a calculated z-statistic of 1.5 indicates that:
A) the null hypothesis is rejected.
B) the null hypothesis cannot be rejected. C) the test is inconclusive. Question #26 of 83 Question ID: 1377323
If a one-tailed z-test uses a 5% significance level, the test will reject a:
A) true null hypothesis 95% of the time.
B) false null hypothesis 95% of the time.
C) true null hypothesis 5% of the time. Question #27 of 83 Q i ID 1377334 Question #27 of 83 Question ID: 1377334
A hypothesis test has a p-value of 1.96%. An analyst should reject the null hypothesis at a significance level of:
A) 6%, but not at a signicance level of 4%.
B) 3%, but not at a signicance level of 1%.
C) 4%, but not at a signicance level of 2%. Question #28 of 83 Question ID: 1377298
George Appleton believes that the average return on equity in the amusement industry, µ, is
greater than 10%. What is the null (H ) and alternative (H ) hypothesis for his study? 0 a
A) H0: > 0.10 versus H : < 0.10. a
B) H0: ≤ 0.10 versus H : > 0.10. a
C) H0: > 0.10 versus H : 0.10. a ≤ Question #29 of 83 Question ID: 1377325
An analyst decides to select 10 stocks for her portfolio by placing the ticker symbols for all
the stocks traded on the New York Stock Exchange in a large bowl. She randomly selects 20
stocks and will put every other one chosen into her 10-stock portfolio. The analyst used: A) dual random sampling. B) simple random sampling.
C) stratied random sampling. Question #30 of 83 Question ID: 1377313
A Type I error is made when the researcher:
A) fails to reject the null hypothesis when it is actually false.
B) rejects the null hypothesis when it is actually true.
C) rejects the alternative hypothesis when it is actually true. Question #31 of 83 Question ID: 1377301
Jo Su believes that there should be a negative relation between returns and systematic risk.
She intends to collect data on returns and systematic risk to test this theory. What is the
appropriate alternative hypothesis? A) Ha: ρ < 0. B) Ha: ρ > 0. C) Ha: ρ ≠ 0. Question #32 of 83 Question ID: 1377295
James Ambercrombie believes that the average return on equity in the utility industry, µ, is
greater than 10%. What is null (H ) and alternative (H ) hypothesis for his study? 0 a
A) H0: µ ≥ 0.10 versus H : µ < 0.10. a
B) H0: µ ≤ 0.10 versus H : µ > 0.10. a
C) H0: µ = 0.10 versus H : µ 0.10. a ≠ Question #33 of 83 Question ID: 1377351 Student's t-Distribution
Level of Significance for One-Tailed Test
df 0.100 0.050 0.025 0.01 0.005 0.0005
Level of Significance for Two-Tailed Test df 0.20 0.10 0.05 0.02 0.01 0.001
10 1.372 1.812 2.228 2.764 3.169 4.587
11 1.363 1.796 2.201 2.718 3.106 4.437
12 1.356 1.782 2.179 2.681 3.055 4.318
22 1.321 1.717 2.074 2.508 2.819 3.792
23 1.319 1.714 2.069 2.500 2.807 3.768
24 1.318 1.711 2.064 2.492 2.797 3.745
Roy Fisher, CFA, wants to determine whether there is a significant difference, at the 5%
significance level, between the mean monthly return on Stock GHI and the mean monthly
return on Stock JKL. Fisher assumes the variances of the two stocks' returns are equal. Using
the last 12 months of returns on each stock, Fisher calculates a t-statistic of 2.0 for a test of
equality of means. Based on this result, Fisher's test:
A) fails to reject the null hypothesis.
B) rejects the null hypothesis, and Fisher can conclude that the means are equal.
C) rejects the null hypothesis, and Fisher can conclude that the means are not equal. Question #34 of 83 Question ID: 1377320
Which of the following statements about hypothesis testing is least accurate?
A) The null hypothesis is a statement about the value of a population parameter.
B) If the alternative hypothesis is H : µ > µ , a two-tailed test is appropriate. a 0
C) A Type II error is failing to reject a false null hypothesis. Question #35 of 83 Question ID: 1377312
A survey is taken to determine whether the average starting salaries of CFA charterholders is
equal to or greater than $59,000 per year. What is the test statistic given a sample of 135
newly acquired CFA charterholders with a mean starting salary of $64,000 and a standard deviation of $5,500? A) 0.91. B) -10.56. C) 10.56. Question #36 of 83 Question ID: 1377309
A survey is taken to determine whether the average starting salaries of CFA charterholders is
equal to or greater than $57,000 per year. Assuming a normal distribution, what is the test
statistic given a sample of 115 newly acquired CFA charterholders with a mean starting
salary of $65,000 and a standard deviation of $4,500? A) -19.06. B) 1.78. C) 19.06. Question #37 of 83 Question ID: 1377319
Which of the following statements about hypothesis testing is most accurate? A Type I error is the probability of:
A) failing to reject a false hypothesis.
B) rejecting a true alternative hypothesis.
C) rejecting a true null hypothesis. Question #38 of 83 Question ID: 1377352
For a test of the equality of the means of two normally distributed independent populations,
the appropriate test statistic follows a: A) chi-square distribution. B) F-distribution. C) t-distribution. Question #39 of 83 Question ID: 1377367
To test a hypothesis that the population correlation coefficient of two variables is equal to
zero, an analyst collects a sample of 24 observations and calculates a sample correlation
coefficient of 0.37. Can the analyst test this hypothesis using only these two inputs? A) Yes.
B) No, because the sample standard deviations of the two variables are also required.
C) No, because the sample means of the two variables are also required. Question #40 of 83 Question ID: 1377332
A researcher determines that the mean annual return over the last 10 years for an
investment strategy was greater than that of an index portfolio of equal risk with a statistical
significance level of 1%. To determine whether the abnormal portfolio returns to the
strategy are economically meaningful, it would be most appropriate to additionally account for:
A) the transaction costs, tax eects, and risk of the strategy.
B) only the transaction costs and tax eects of the strategy.
C) only the transaction costs of the strategy. Question #41 of 83 Question ID: 1377342 Student's t-Distribution
Level of Significance for One-Tailed Test
df 0.100 0.050 0.025 0.01 0.005 0.0005
Level of Significance for Two-Tailed Test df 0.20 0.10 0.05 0.02 0.01 0.001
40 1.303 1.684 2.021 2.423 2.704 3.551
Ken Wallace is interested in testing whether the average price to earnings (P/E) of firms in
the retail industry is 25. Using a t-distributed test statistic and a 5% level of significance, the
critical values for a sample of 41 firms is (are): A) -1.685 and 1.685. B) -1.96 and 1.96. C) -2.021 and 2.021. Question #42 of 83 Question ID: 1377336
Given the following hypothesis:
The null hypothesis is H : µ = 5 0 The alternative is H : µ 5 1 ≠
The mean of a sample of 17 is 7
The population standard deviation is 2.0
What is the calculated z-statistic? A) 8.00. B) 4.12. C) 4.00. Question #43 of 83 Question ID: 1377353
Brandon Ratliff is investigating whether the mean of abnormal returns earned by portfolio
managers with an MBA degree significantly differs from mean abnormal returns earned by
managers without an MBA. Ratliff's null hypothesis is that the means are equal. If Ratliff's
critical t-value is 1.98 and his computed t-statistic is 2.05, he should:
A) fail to reject the null hypothesis and conclude that the population means are equal.
B) reject the null hypothesis and conclude that the population means are not equal.
C) reject the null hypothesis and conclude that the population means are equal. Question #44 of 83 Question ID: 1377330 The power of the test is:
A) the probability of rejecting a false null hypothesis.
B) equal to the level of condence.
C) the probability of rejecting a true null hypothesis. Question #45 of 83 Question ID: 1377344 Student's t-Distribution
Level of Significance for One-Tailed Test
df 0.100 0.050 0.025 0.01 0.005 0.0005
Level of Significance for Two-Tailed Test df 0.20 0.10 0.05 0.02 0.01 0.001
18 1.330 1.734 2.101 2.552 2.878 3.922
19 1.328 1.729 2.093 2.539 2.861 3.883
20 1.325 1.725 2.086 2.528 2.845 3.850
21 1.323 1.721 2.080 2.518 2.831 3.819
In atest of whether a population mean is equal to zero, a researcher calculates a t-statistic
of –2.090 based on a sample of 20 observations. If you choose a 5% significance level, you should:
A) fail to reject the null hypothesis that the population mean is equal to zero.
reject the null hypothesis and conclude that the population mean is not signicantly B) dierent from zero.
reject the null hypothesis and conclude that the population mean is signicantly C) dierent from zero. Question #46 of 83 Question ID: 1377361
A test of whether the population variance is equal to a hypothesized value requires the use of a test statistic that is: A) t-distributed. B) chi-squared distributed. C) F-distributed. Question #47 of 83 Question ID: 1377345 Student's t-Distribution
Level of Significance for One-Tailed Test
df 0.100 0.050 0.025 0.01 0.005 0.0005
Level of Significance for Two-Tailed Test df 0.20 0.10 0.05 0.02 0.01 0.001
28 1.313 1.701 2.048 2.467 2.763 3.674
29 1.311 1.699 2.045 2.462 2.756 3.659
30 1.310 1.697 2.042 2.457 2.750 3.646
In order to test whether the mean IQ of employees in an organization is greater than 100, a
sample of 30 employees is taken and the sample value of the computed test statistic, t = n-1
3.4. If you choose a 5% significance level you should:
fail to reject the null hypothesis and conclude that the population mean is less than A) or equal to 100.
reject the null hypothesis and conclude that the population mean is greater than B) 100.
fail to reject the null hypothesis and conclude that the population mean is greater C) than 100. Question #48 of 83 Question ID: 1377356
Joe Sutton is evaluating the effects of the 1987 market decline on the volume of trading.
Specifically, he wants to test whether the decline affected trading volume. He selected a
sample of 500 companies and collected data on the total annual volume for one year prior
to the decline and for one year following the decline. What is the set of hypotheses that Sutton is testing?
A) H0: µ = µ versus H : µ > µ . d d0 a d d0
B) H0: µ = µ versus H : µ µ . d d0 a d ≠ d0
C) H0: µ µ versus H : µ = µ . d ≠ d0 a d d0 Question #49 of 83 Question ID: 1377346
Which of the following statements about test statistics is least accurate?
In a test of the population mean, if the population variance is unknown, we should
A) use a t-distributed test statistic.
In the case of a test of the dierence in means of two independent samples, we use
B) a t-distributed test statistic.
In a test of the population mean, if the population variance is unknown and the
C) sample is small, we should use a z-distributed test statistic. Question #50 of 83 Question ID: 1377349
Brandee Shoffield is the public relations manager for Night Train Express, a local sports
team. Shoffield is trying to sell advertising spots and wants to know if she can say with 90%
confidence that average home game attendance is greater than 3,000. Attendance is
approximately normally distributed. A sample of the attendance at 15 home games results
in a mean of 3,150 and a standard deviation of 450. Which of the following statements is most accurate?
A) Shoeld should use a two-tailed Z-test.
B) The calculated test statistic is 1.291.
With an unknown population variance and a small sample size, no statistic is
C) available to test Shoeld's hypothesis. Question #51 of 83 Question ID: 1377300
Jill Woodall believes that the average return on equity in the retail industry, µ, is less than
15%. What are the null (H ) and alternative (H ) hypotheses for her study? 0 a
A) H0: µ < 0.15 versus H : µ 0.15. a ≥
B) H0: µ ≤ 0.15 versus H : µ > 0.15. a
C) H0: µ ≥ 0.15 versus H : µ < 0.15. a Question #52 of 83 Question ID: 1377293
Robert Patterson, an options trader, believes that the return on options trading is higher on
Mondays than on other days. In order to test his theory, he formulates a null hypothesis.
Which of the following would be an appropriate null hypothesis? Returns on Mondays are:
A) less than returns on other days.
B) greater than returns on other days.
C) not greater than returns on other days. Question #53 of 83 Question ID: 1377358
In order to test if Stock A is more volatile than Stock B, prices of both stocks are observed to
construct the sample variance of the two stocks. The appropriate test statistics to carry out the test is the: A) F test. B) t test. C) Chi-square test. Question #54 of 83 Question ID: 1377368
Student's t-distribution, level of significance for a two-tailed test: df 0.20 0.10 0.05 0.02 0.01 0.001
16 1.337 1.746 2.120 2.583 2.921 4.015
17 1.333 1.740 2.110 2.567 2.898 3.965
18 1.330 1.734 2.101 2.552 2.878 3.922
19 1.328 1.729 2.093 2.539 2.861 3.883
20 1.325 1.725 2.086 2.528 2.845 3.850
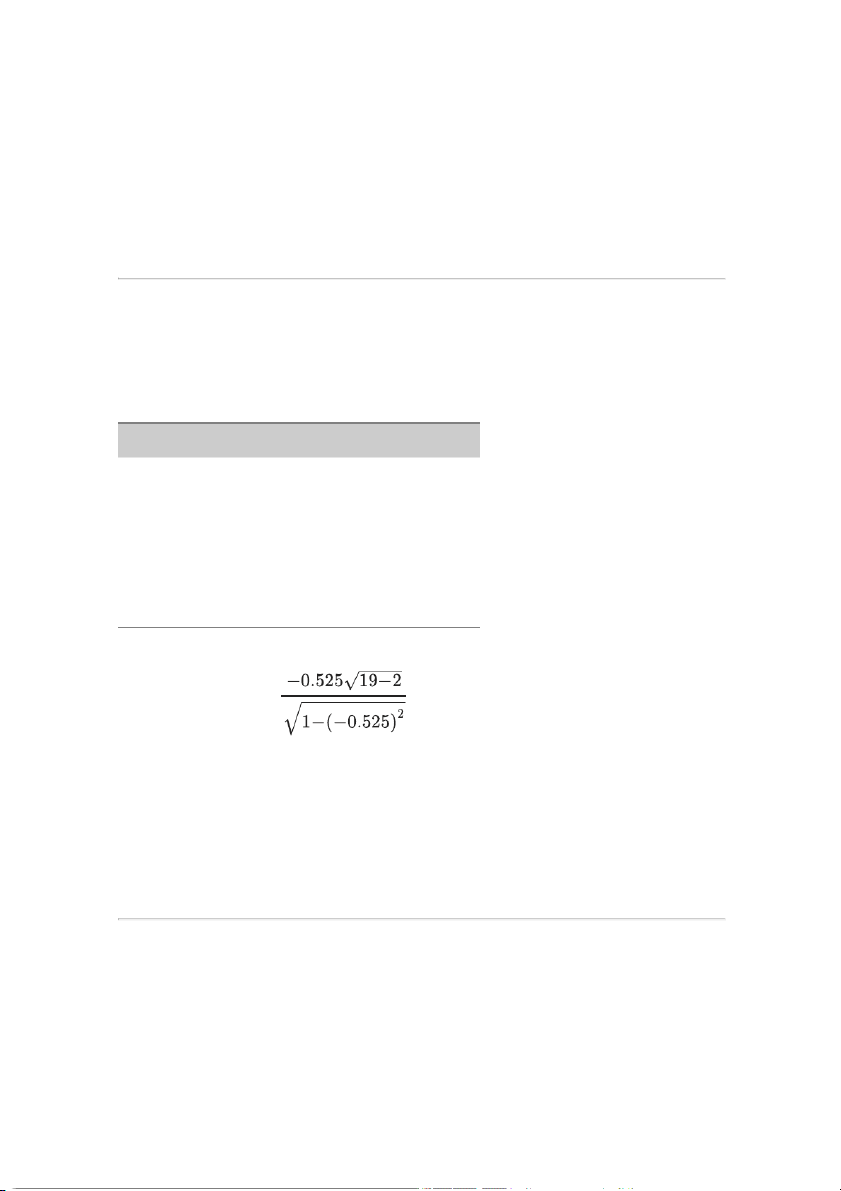
Based on a sample correlation coefficient of −0.525 from a sample size of 19, an analyst calculates a t-statistic of
= −2.5433. The analyst can reject the
hypothesis that the population correlation coefficient equals zero:
A) at a 1% signicance level.
B) at a 5% signicance level, but not at a 2% signicance level.
C) at a 2% signicance level, but not at a 1% signicance level. Question #55 of 83 Question ID: 1377294
Which of the following is an accurate formulation of null and alternative hypotheses?
A) Less than for the null and greater than for the alternative.
B) Greater than for the null and less than or equal to for the alternative.
C) Equal to for the null and not equal to for the alternative. Question #56 of 83 Question ID: 1377338 Student's t-Distribution
Level of Significance for One-Tailed Test
df 0.100 0.050 0.025 0.01 0.005 0.0005
Level of Significance for Two-Tailed Test df 0.20 0.10 0.05 0.02 0.01 0.001
28 1.313 1.701 2.048 2.467 2.763 3.674
29 1.311 1.699 2.045 2.462 2.756 3.659
30 1.310 1.697 2.042 2.457 2.750 3.646
In order to test if the mean IQ of employees in an organization is greater than 100, a sample
of 30 employees is taken and the sample value of the computed test statistic, t = 1.2. If n-1
you choose a 5% significance level you should:
reject the null hypothesis and conclude that the population mean is greater than A) 100.
fail to reject the null hypothesis and conclude that the population mean is greater B) than 100.
fail to reject the null hypothesis and conclude that the population mean is not C) greater than 100. Question #57 of 83 Question ID: 1377337
An analyst conducts a two-tailed test to determine if mean earnings estimates are
significantly different from reported earnings. The sample size is greater than 25 and the
computed test statistic is 1.25. Using a 5% significance level, which of the following statements is most accurate?
To test the null hypothesis, the analyst must determine the exact sample size and
A) calculate the degrees of freedom for the test.
The analyst should fail to reject the null hypothesis and conclude that the earnings
B) estimates are not signicantly dierent from reported earnings.
The analyst should reject the null hypothesis and conclude that the earnings
C) estimates are signicantly dierent from reported earnings. Question #58 of 83 Question ID: 1377306
If the probability of a Type I error decreases, then the probability of:
A) incorrectly rejecting the null increases. B) a Type II error increases.
C) incorrectly accepting the null decreases. Question #59 of 83 Question ID: 1377365
Joe Bay, CFA, wants to test the hypothesis that the variance of returns on energy stocks is
equal to the variance of returns on transportation stocks. Bay assumes the samples are
independent and the returns are normally distributed. The appropriate test statistic for this hypothesis is: A) a t-statistic. B) a Chi-square statistic. C) an F-statistic. Question #60 of 83 Question ID: 1377324
If a two-tailed hypothesis test has a 5% probability of rejecting the null hypothesis when the
null is true, it is most likely that:
A) the power of the test is 95%.
B) the condence level of the test is 95%.
C) the probability of a Type I error is 2.5%. Question #61 of 83 Question ID: 1377347 Cumulative Z-Table z 0.04 0.05 0.06 0.07 0.08 0.09
1.2 0.8925 0.8944 0.8962 0.8980 0.8997 0.9015
1.3 0.9099 0.9115 0.9131 0.9147 0.9162 0.9177
1.4 0.9251 0.9265 0.9279 0.9292 0.9306 0.9319
1.5 0.9382 0.9394 0.9406 0.9418 0.9429 0.9441
1.6 0.9495 0.9505 0.9515 0.9525 0.9535 0.9545
Maria Huffman is the Vice President of Human Resources for a large regional car rental
company. Last year, she hired Graham Brickley as Manager of Employee Retention. Part of
the compensation package was the chance to earn one of the following two bonuses: if
Brickley can reduce turnover to less than 30%, he will receive a 25% bonus. If he can reduce
turnover to less than 25%, he will receive a 50% bonus (using a significance level of 10%).
The population of turnover rates is normally distributed. The population standard deviation
of turnover rates is 1.5%. A recent sample of 100 branch offices resulted in an average
turnover rate of 24.2%. Which of the following statements is most accurate?
For the 50% bonus level, the test statistic is -5.33 and Human should give Brickley a A) 50% bonus.
B) Brickley should not receive either bonus.
For the 50% bonus level, the critical value is -1.65 and Human should give Brickley C) a 50% bonus. Question #62 of 83 Question ID: 1377369
A researcher wants to test whether the weekly returns on two stocks are correlated. The test
statistic for the appropriate test follows a: A) chi-square distribution.
B) t-distribution with n − 1 degrees of freedom.
C) t-distribution with n − 2 degrees of freedom. Question #63 of 83 Question ID: 1377302
In order to test whether the mean IQ of employees in an organization is greater than 100, a
sample of 30 employees is taken and the sample value of the computed test statistic, t = n-1
3.4. The null and alternative hypotheses are: A) H0: µ = 100; H : µ 100. a ≠
B) H0: µ ≤ 100; H : µ > 100. a
C) H0: X ≤ 100; H : X > 100. a Question #64 of 83 Question ID: 1377303
Susan Bellows is comparing the return on equity for two industries. She is convinced that
the return on equity for the discount retail industry (DR) is greater than that of the luxury
retail (LR) industry. What are the hypotheses for a test of her comparison of return on equity? A) H0: µ µ versus H : µ > µ . DR ≤ LR a DR LR B) H0: µ < µ versus H : µ µ . DR LR a DR ≥ LR C) H0: µ > µ versus H : µ µ . DR LR a DR ≤ LR Question #65 of 83 Question ID: 1377314 A Type I error:
A) rejects a false null hypothesis.
B) fails to reject a false null hypothesis.
C) rejects a true null hypothesis. Question #66 of 83 Question ID: 1377364
A manager wants to test whether two normally distributed and independent populations
have equal variances. The appropriate test statistic for this test is a: A) F-statistic. B) chi-square statistic. C) t-statistic. Question #67 of 83 Question ID: 1377316 A Type II error:
A) fails to reject a false null hypothesis.
B) fails to reject a true null hypothesis.
C) rejects a true null hypothesis. Question #68 of 83 Question ID: 1377371
A test of whether a mutual fund's performance rank in one period provides information
about the fund's performance rank in a subsequent period is best described as a: A) mean-rank test. B) nonparametric test. C) parametric test. Question #69 of 83 Question ID: 1377357
An analyst has calculated the sample variances for two random samples from independent
normally distributed populations. The test statistic for the hypothesis that the true
population variances are equal is a(n): A) F-statistic. B) chi-square statistic. C) t-statistic. Question #70 of 83 Question ID: 1377343
A survey is taken to determine whether the average starting salaries of CFA charterholders is
equal to or greater than $62,500 per year. What is the test statistic given a sample of 125
newly acquired CFA charterholders with a mean starting salary of $65,000 and a standard deviation of $2,600? A) -10.75. B) 0.96. C) 10.75. Question #71 of 83 Question ID: 1377354
For a test of the equality of the mean returns of two non-independent populations based on
a sample, the numerator of the appropriate test statistic is the:
A) average dierence between pairs of returns.
B) dierence between the sample means for each population.
C) larger of the two sample means. Question #72 of 83 Question ID: 1377311
A survey is taken to determine whether the average starting salaries of CFA charterholders is
equal to or greater than $58,500 per year. What is the test statistic given a sample of 175
CFA charterholders with a mean starting salary of $67,000 and a standard deviation of $5,200? A) 1.63. B) –1.63. C) 21.62. Question #73 of 83 Question ID: 1377359
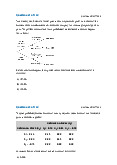
F-Table, Critical Values, 5 Percent in Upper Tail
Degrees of freedom for the numerator along top row
Degrees of freedom for the denominator along side row 10 12 15 20 24 30
25 2.24 2.16 2.09 2.01 1.96 1.92
30 2.16 2.09 2.01 1.93 1.89 1.84
40 2.08 2.00 1.92 1.84 1.79 1.74
Abby Ness is an analyst for a firm that specializes in evaluating firms involved in mineral
extraction. Ness believes that the earnings of copper extracting firms are more volatile than
those of bauxite extraction firms. In order to test this, Ness examines the volatility of returns
for 31 copper firms and 25 bauxite firms. The standard deviation of earnings for copper
firms was $2.69, while the standard deviation of earnings for bauxite firms was $2.92. Ness's
Null Hypothesis is σ 2 = σ 2. Based on the samples, can we reject the null hypothesis at a 1 2
90% confidence level using an F-statistic? Null is:
A) rejected. The F-value exceeds the critical value by 0.71.
B) rejected. The F-value exceeds the critical value by 0.849. C) not rejected. Question #74 of 83 Question ID: 1377304
A researcher is testing whether the average age of employees in a large firm is statistically
different from 35 years (either above or below). A sample is drawn of 250 employees and
the researcher determines that the appropriate critical value for the test statistic is 1.96. The
value of the computed test statistic is 4.35. Given this information, which of the following
statements is least accurate? The test:
indicates that the researcher is 95% condent that the average employee age is A) dierent than 35 years.
B) indicates that the researcher will reject the null hypothesis.
C) has a signicance level of 95%. Question #75 of 83 Question ID: 1377326
Kyra Mosby, M.D., has a patient who is complaining of severe abdominal pain. Based on an
examination and the results from laboratory tests, Mosby states the following diagnosis
hypothesis: H : Appendicitis, H : Not Appendicitis. Dr. Mosby removes the patient's o A
appendix and the patient still complains of pain. Subsequent tests show that the gall bladder
was causing the problem. By taking out the patient's appendix, Dr. Mosby: A) is correct. B) made a Type I error. C) made a Type II error. Question #76 of 83 Question ID: 1377292
In the process of hypothesis testing, what is the proper order for these steps?
Collect the sample and calculate the sample statistics. State the hypotheses. Specify
A) the level of signicance. Make a decision.
Specify the level of signicance. State the hypotheses. Make a decision. Collect the
B) sample and calculate the sample statistics.
State the hypotheses. Specify the level of signicance. Collect the sample and
C) calculate the test statistics. Make a decision. Question #77 of 83 Question ID: 1377331
Of the following explanations, which is least likely to be a valid explanation for divergence
between statistical significance and economic significance? A) Adjustment for risk. B) Data errors. C) Transactions costs. Question #78 of 83 Question ID: 1377333
A p-value of 0.02% means that a researcher:
A) can reject the null hypothesis at both the 5% and 1% signicance levels.
can reject the null hypothesis at the 5% signicance level but cannot reject at the 1% B) signicance level.
C) cannot reject the null hypothesis at either the 5% or 1% signicance levels. Question #79 of 83 Question ID: 1377308
If a two-tailed hypothesis test has a 5% probability of rejecting the null hypothesis when the
null is true, it is most likely that the: A) power of the test is 95%.
B) signicance level of the test is 5%.
C) probability of a Type I error is 2.5%. Question #80 of 83 Question ID: 1377307
Which of the following statements about hypothesis testing is most accurate? A Type II error is the probability of:
A) failing to reject a false null hypothesis.
B) rejecting a true alternative hypothesis.
C) rejecting a true null hypothesis. Question #81 of 83 Question ID: 1377321
Ron Jacobi, manager with the Toulee Department of Natural Resources, is responsible for
setting catch-and-release limits for Lake Norby, a large and popular fishing lake. He takes a
sample to determine whether the mean length of Northern Pike in the lake exceeds 18
inches. If the sample t-statistic indicates that the mean length of the fish is significantly
greater than 18 inches, when the population mean is actually 17.8 inches, the t-test resulted in: A) a Type I error only.
B) both a Type I and a Type II error. C) a Type II error only. Question #82 of 83 Question ID: 1377339 Student's t-Distribution
Level of Significance for One-Tailed Test
df 0.100 0.050 0.025 0.01 0.005 0.0005
Level of Significance for Two-Tailed Test df 0.20 0.10 0.05 0.02 0.01 0.001
18 1.330 1.734 2.101 2.552 2.878 3.922
19 1.328 1.729 2.093 2.539 2.861 3.883
20 1.325 1.725 2.086 2.528 2.845 3.850
21 1.323 1.721 2.080 2.518 2.831 3.819
In a two-tailed test of a hypothesis concerning whether a population mean is zero, Jack
Olson computes a t-statistic of 2.7 based on a sample of 20 observations where the
distribution is normal. If a 5% significance level is chosen, Olson should:
reject the null hypothesis and conclude that the population mean is not signicantly A) dierent from zero.
reject the null hypothesis and conclude that the population mean is signicantly B) dierent from zero.
fail to reject the null hypothesis that the population mean is not signicantly C) dierent from zero. Question #83 of 83 Question ID: 1377305
Which of the following statements about hypothesis testing is most accurate?
A Type I error is rejecting the null hypothesis when it is true, and a Type II error is
A) rejecting the alternative hypothesis when it is true.
A hypothesis that the population mean is less than or equal to 5 should be rejected
B) when the critical Z-statistic is greater than the sample Z-statistic.
A hypothesized mean of 3, a sample mean of 6, and a standard error of the
C) sampling means of 2 give a sample Z-statistic of 1.5.
Tài liệu liên quan:
-
Reading 10 Aggregate Output, Prices - Business English | Trường Đại học Hùng Vương
295 148 -
Reading 9 The Firm and Market Structures - Business English | Trường Đại học Hùng Vương
266 133 -
Reading 8 Topics in Demand - Business English | Trường Đại học Hùng Vương
265 133 -
Reading 7 Introduction to Linear Regression - Business English | Trường Đại học Hùng Vương
273 137 -
Reading 3 Probability Concepts - Business English | Trường Đại học Hùng Vương
295 148