Radiomics Feature Extraction from Ultrasound B-Mode Images and Radio-Frequency Signals of the Carotid Arterial Wall: A Feasibility Study | Tài liệu Tiếng Anh
Radiomics Feature Extraction from Ultrasound B-Mode Images and Radio-Frequency Signals of the Carotid Arterial Wall: A Feasibility Study | Tài liệu Tiếng Anh. Tài liệu giúp bạn tham khảo, ôn tập và đạt kết quả cao. Mời đọc đón xem!
Môn: Tiếng Anh chuyên ngành 332 tài liệu
Trường: Tài liệu Tiếng Anh chuyên ngành, Tiếng Anh cho người đi làm 432 tài liệu
Tác giả:


Preview text:
Jadoon et al. Artery Research (2025) 31:6
https://doi.org/10.1007/s44200-025-00076-w Artery Research RESEARCH ARTICLE Open Access Radiomics Feature Extraction from Ultrasound B-Mode Images
and Radio-Frequency Signals of the Carotid
Arterial Wall: A Feasibility Study
Maryam Jadoon1*, Federica Poli1, Pierre Boutouyrie1,2, Hakim Khettab2, Elisabetta Bianchini3, Francesco Faita3,
Xavier Jouven1, Jean Philippe Empana1† and Rosa Maria Bruno1,2† Abstract
Background Carotid ultrasound is largely used to assess arterial aging. Radiomics (quantitative imaging feature
analysis) applied on ultrasound may allow characterizing wall ultrastructure and arterial ageing. However, to date
its application to the intima–media (IM) complex is unexplored. The aim of this study is to investigate the feasibility
of radiomics-based B-mode and RF feature extraction and selection process.
Methods Radio-frequency signals from 200 individuals (age 50–75y, 40% hypertensives, 20% diabetic) were used
to extract RF and B-mode features. Feature stability across three frames from the same clip and five ROI sizes for each
frame were evaluated by intraclass correlation analysis (threshold > 0.50). Lasso L1 regression for chronological age
prediction on ICC > 0.50 features were used to analyze reproducibility and variation across frames and ROI sizes; 80/20
train-test split was used, with performance evaluated by MSE and R2.
Results Radiomic feature extraction was feasible in 190 among 200 individuals. 48 features showed an ICC > 0.50.
Feature selection for chronological age prediction showed consistent R2 (0.09–0.14 train, 0.05–0.13 test) and MSE
(32.3–34.3 train, 30.7–42.3 test) across frames. Fixed ROI sizes of 1.0mm and 1.2mm had comparable performance
to an ROI size manually tailored to wall thickness: R2 (0.07–0.15 train, 0.07–0.17 test) and MSE (33.15–36.22 train,
33.07–34.83 test), consistently selecting substantially similar three to six features.
Conclusion While feature extraction and selection process are largely reproducible across frames, ROI size proved
critical and thus must be carefully chosen. Further studies are required to demonstrate the validity of this approach
for carotid wall characterization.
Keywords Vascular aging, Carotid radiomics, Arterial stiffness, Radio-frequency ultrasound, Machine learning
†Jean Philippe Empana and Rosa Maria Bruno have contributed equally to this paper. *Correspondence: Maryam Jadoon Maryam13khan@gmail.com
Full list of author information is available at the end of the article
© The Author(s) 2025. Open Access This article is licensed under a Creative Commons Attribution 4.0 International License, which
permits use, sharing, adaptation, distribution and reproduction in any medium or format, as long as you give appropriate credit to the
original author(s) and the source, provide a link to the Creative Commons licence, and indicate if changes were made. The images or
other third party material in this article are included in the article’s Creative Commons licence, unless indicated otherwise in a credit line
to the material. If material is not included in the article’s Creative Commons licence and your intended use is not permitted by statutory
regulation or exceeds the permitted use, you will need to obtain permission directly from the copyright holder. To view a copy of this
licence, visit http:// creat iveco mmons. org/ licen ses/ by/4. 0/.
Jadoon et al. Artery Research (2025) 31:6 Page 2 of 12 1 Introduction
power of radiomic features (quantitative information
Vascular ageing is marked by progressive structural and mostly from CT or MRI images) and correlating these
functional deterioration of blood vessels that occurs with clinical outcomes [16]. Especially, radiomics has
with ageing. These changes over time increase the risk of proven impactful in oncology, in survival prediction for
developing cardiovascular disease [1, 2]. Vascular ageing oesophageal cancer patients [18], in predicting breast
is an inevitable physiological process; however, the rate cancer heterogenicity [19] and in assessing both tumour
and extent of this vascular deterioration can vary consid-
recurrence [20] and disease-free survival in advanced
erably among certain individuals. Early vascular ageing rectal cancer [21]. Cardiovascular applications of radi-
(EVA) exhibits structural and functional arterial changes omics have also shown promise, mostly applied on cor-
typically associated with older age, despite being chrono-
onary CT scans [22, 23], but also on carotid plaque US
logically younger [3, 4]. Conversely, in supernormal vas-
[24]. For example, Huang et al. explored the relationship
cular ageing (SUPERNOVA), individuals demonstrate between radiomic plaque features and clinical symptoms
remarkable preservation of vascular health and function, [25], while Le et al. assessed CT angiography radiomics
with their arteries appearing physiologically younger for stroke prediction [26]. Liu et al. developed a radiom-
than their chronological age. In recent years, there has ics nomogram for stroke risk in diabetes [27], and Van
been an increased evidence on the role of vascular ageing Engelen et al. demonstrated that plaque texture radiom-
biomarkers in predicting cardiovascular events [5, 6].
ics could predict vascular events [28]. To date, the carotid
The current assessment of vascular ageing may involve IM complex has never been investigated by radiomics,
utilizing biomarkers for atherosclerosis, such as the cal-
because of small tissue region size, rendering difficult
cium score (CAC) or plaque analysis, as well as biomark-
feature extraction from standard B-mode images [29].
ers for arteriosclerosis, including pulse wave velocity However, a more comprehensive analysis of IMT ultra-
(PWV) and carotid distensibility [7]. These image-based structure may provide additional information on ath-
assessments are typically performed using various imag-
erosclerosis development at an earlier stage of disease,
ing techniques, including magnetic resonance imag-
before plaque development. Indeed, lower ultrasound
ing (MRI), computed tomography (CT), and ultrasound resolution makes it difficult to capture histological details
(US). Thorough evaluations of both structural and func-
such as cells [30, 31]. However, the integration of B-mode
tional vascular alterations are essential for assessing the imaging with radio-frequency phase-derived informa-
cardiovascular risk associated with vascular ageing [8]. tion, alongside advanced texture analysis techniques (on
Advanced imaging modalities such as MRI and CT, while both RF-B-mode), offers a promising solution to extract
effective, are expensive, complex and have low availabil-
and quantify information about structural disarray as
ity, thus not perfectly suitable for routine preventive risk a consequence of cell and extracellular matrix changes
assessments. In contrast, carotid US assessment is rela-
[32]. We hypothesized that combining B-mode with
tively low cost, safe, widely available and able to capture radio-frequency (RF) signal radiomic analysis would
both atherosclerotic and arteriosclerotic biomarkers. provide complementary information for comprehensive
This makes it an optimal choice for routine preventive characterization of the intima–media complex. B-mode
risk assessment. Among carotid ultrasound biomark-
imaging offers greyscale representation of tissue acous-
ers, carotid plaque [9, 10] and carotid stiffness [11] dem-
tic properties, morphological information and interface
onstrated predictive value for cardiovascular events, detection, while RF signals provide raw acoustic data
mostly stroke, on top of cardiovascular risk factors [12]. with preserved phase information, higher axial sensitivity
Conversely Intima–media thickness (IMT) additive pre-
and greater spatial resolution [33]. In this study, we aimed
dictive value is debated: while IMT is associated with to evaluate the feasibility of radiomics-based B-mode and
cardiovascular risk factors and is useful for understand-
RF feature extraction from the IM complex. A key focus
ing response to treatment [13], its ability to enhance was to assess the impact of the selected region-of-interest
risk prediction beyond existing methods is limited [14]. (ROI) size and the frame used on the extracted radiomic
For this reason, there is a need for continuous improve- features.
ment of methods and techniques aimed at developing
new descriptors, to better capture the subtle structural 2 Materials and Methods
variations in the carotid arteries [8, 15]. It is now well 2.1 Study Population
documented that radiomics, which involves extracting A feasibility study on a subset of 200 individuals selected
numerical data from images, can provide more detailed from the Paris Prospective Study III (PPS3) cohort was
information than simple images and in some settings can conducted. A targeted sampling approach was imple-
be comparable to diagnostic assessment by radiologists mented, oversampling individuals with type 2 diabetes
[16, 17]. Multiple studies have validated the predictive (T2D) by up to 20% to capture more extreme phenotypes Jadoon
et al. Artery Research (2025) 31:6 Page 3 of 12
associated with the condition. Additionally, the presence features computed individually for each RF time series
of carotid plaques in approximately 20% of the sample within the region of interest (ROI), with the mean value
was enforced, ensuring representation of vascular com-
computed on 30 frames to derive the time domain char-
plications relevant to T2D. To ensure a comprehen-
acteristics [44]; (2) frequency domain features involving
sive range of blood pressure values, the population was Fourier transform to acquire the frequency spectrum, fol-
divided into thirds: one-third within the 25th–75th per-
lowed by straight-line fitting on the normalized spectrum
centile range (120–141 mmHg), one-third below the 25th [45, 46]; furthermore, (3) the M parameter extracted
percentile (< 120 mmHg), and one-third above the 75th from the Nakagami distribution mean diagram (NDM)
percentile (≥ 141 mmHg). Furthermore, individuals aged parametric map [45, 47] utilizing Nakagami distribu-
between 50 and 75 years were uniformly included, ensur-
tion; (4) spectral features [46]; (5) the calculated feature
ing a consistent distribution across the age range.
maps such as direct energy attenuation diagram (DEA)
PPS3 is an ongoing community-based prospective and RF signal skewness intensity diagram (RF-I), and the
observational study conducted in Paris, France [34]. The first-order statistics and higher-order textural features
study protocol was approved by the Ethics Committee of extracted from each map by applying the texture analysis
Cochin Hospital (Paris, France) and was registered on the [45, 48] (Table 1).
World Health Organization International Clinical Tri-
als Registry platform (NCT00741728) on 08/25/2008. A 2.5 Data Extraction Settings
total of 10,157 men and women aged 50–75 years were 180 B-mode images (frames) were obtained from every
enrolled, who underwent a comprehensive preventive original 6-s acquisition (a 128 radio-frequency line multi-
medical checkup, after signing an informed consent array with a depth of 4 cm captured at 30 frames per form.
second). The region of interest was manually selected
from the B-mode image capturing the intima–media
2.2 Ultrasound Acquisition
complex on the far wall of the right carotid artery using
The vascular US was performed using Esaote PICUS a rectangular bounding box. Three end-diastolic frames
Machine, Genova, Italy (128 RF linear array transducer from each patient were selected. For each frame, four
with 7.5MHz, B-mode pixels 758 × 508 and RF-matrix ROI sizes (1 mm, 1.2 mm, 1.4 mm, and 1.6 mm) were
1516 × 127). The raw radio-frequency data were pre-
extracted from the same location, with the bounding box
served to facilitate in-depth analysis. The inclusion cri-
centred on the smoothest section of the far wall to ensure
teria required the visibility of the intima–blood interface optimal visualization of the Intima–blood interface (as
in at least some part of the far wall of the right common depicted in Fig. 1). The bounding box encompassed the
carotid artery, in a clear reconstructed B-mode image. blood intima interface with minimal blood lumen on one
Further details are available in the publication by PPS3 side and the adventitia on the other. Initially, the bound- study group et al. [34].
ing box was set at 1mm, gradually expanding by 0.2 mm
towards the adventitia side while maintaining its posi-
2.3 Ultrasound Data Processing
tion, to obtain the four different ROI sizes. Additionally,
First, we developed a graphical user interface (GUI) using a fifth ROI size, termed the variable ROI, was introduced,
MATLAB software (MathWorks, Inc., Massachusetts, which is the most suitable size among the four, pre-
USA, version 2022b) to process raw radio-frequency cisely covering the intima–media (IM) complex (visually
signals and to reconstruct and process B-mode images. selected). Once extracted with the GUI, the features were
Additionally, we identified 178 radiomics features (see normalized before performing feature selection.
description below) to be calculated from the selected
region of interest (ROI). Building on previous work [35], 2.6 Statistical Analysis and Feature Engineering
RF signals were transformed into B-mode ultrasound Descriptive statistics for population variables are pre-
images using standard techniques.
sented as mean ± standard deviation (SD) or as counts
(n) and percentages (%). First, we evaluated the feature 2.4 Radiomic Features
stability across the three frames of the same clip and
A total of 74 radiomic B-mode features and 104 radiomic five ROI sizes of each frame by applying intraclass cor-
radio-frequency (RF) features were evaluated with the relation (ICC) analysis with threshold of ICC > 0.50.
GUI. The B-mode features encompassed the following: We applied a two-way mixed effects model to calcu-
(1) first-order statistics [36], (2) higher-order textural fea-
late absolute agreement, treating ROI sizes as fixed
tures [37–39] (3), transform-based wavelet features [40] effects and individuals as random effects [44]. Second,
and (4) fractal analysis features [41, 42]. Similarly, the we investigated the impact of frame variability on the
RF features comprised the following [43]: (1) time series subset of extracted features with ICC > 0.50 using the
Jadoon et al. Artery Research (2025) 31:6 Page 4 of 12
Fig. 1 Graphical User Interface for ultrasound image visualization, ROI selection and feature extraction
feature selection technique. We applied least absolute 3 Results
shrinkage and selection operator (Lasso—L1 regu-
3.1 Characteristics of the Study Population
larization) with chronological age as outcome [49]. Out of the initial cohort of 200 individuals, 10 were
The following metrics were compared: number, type excluded because the reconstructed images did not dis-
of selected features, mean square error (MSE) and play clearly the IMT complex in any frame, and thus the
R2. These metrics were calculated from four datasets: analysis was run in 190 individuals. There were 48.42%
the three containing the features extracted by three (92) women, 40% (77) hypertensives, 15.78% (30) with
selected frames and one containing their median val-
the presence of carotid plaques and 20% (37) diabetic
ues, using the variable ROI size. Internal validation individuals, with a mean IMT of 631 μm ± 108 stand-
was tested by 80/20 split sample technique.
ard deviation (std) and mean age of 59.47 years (Max
Thirdly, the impact of variation in ROI size on the 74.07–Min 50.01). The baseline characteristics of the
subset of extracted features with ICC > 0.50 was also study population are mentioned in Table 2 and the
investigated by Lasso L1 regression. The following carotid geometric and mechanical properties are men-
metrics were compared: number, type of selected fea- tioned in Table 3.
tures, MSE and R2. These metrics were calculated from
the five datasets containing the median value of each
feature for the three frames for five ROI sizes (1.0 mm, 3.2 Feature Stability Across the Frames
1.2 mm, 1.4 mm, 1.6 mm and Var ROI). The internal Features showing ICC > 0.50 were 73 when ROI size
validation was tested by the 80/20 split sample tech-
was 1 mm, 72 when ROI size was 1.2 mm, 65 when ROI
nique. Additionally, we performed sensitivity analyses size was 1.4 mm, 60 when ROI size was 1.6 mm and the
by applying minimum redundancy maximum rele-
variable ROI (which was used as a reference) yielded 48
vance (MRMR) and stepwise feature selection methods features. Notably, all 48 features with ICC > 0.50 when
instead of Lasso L1, to validate the stability and repro-
ROI size was variable were also part of the sets iden-
ducibility of the results with other feature selection tified by the fixed ROI sizes (See Table S1 in the Sup-
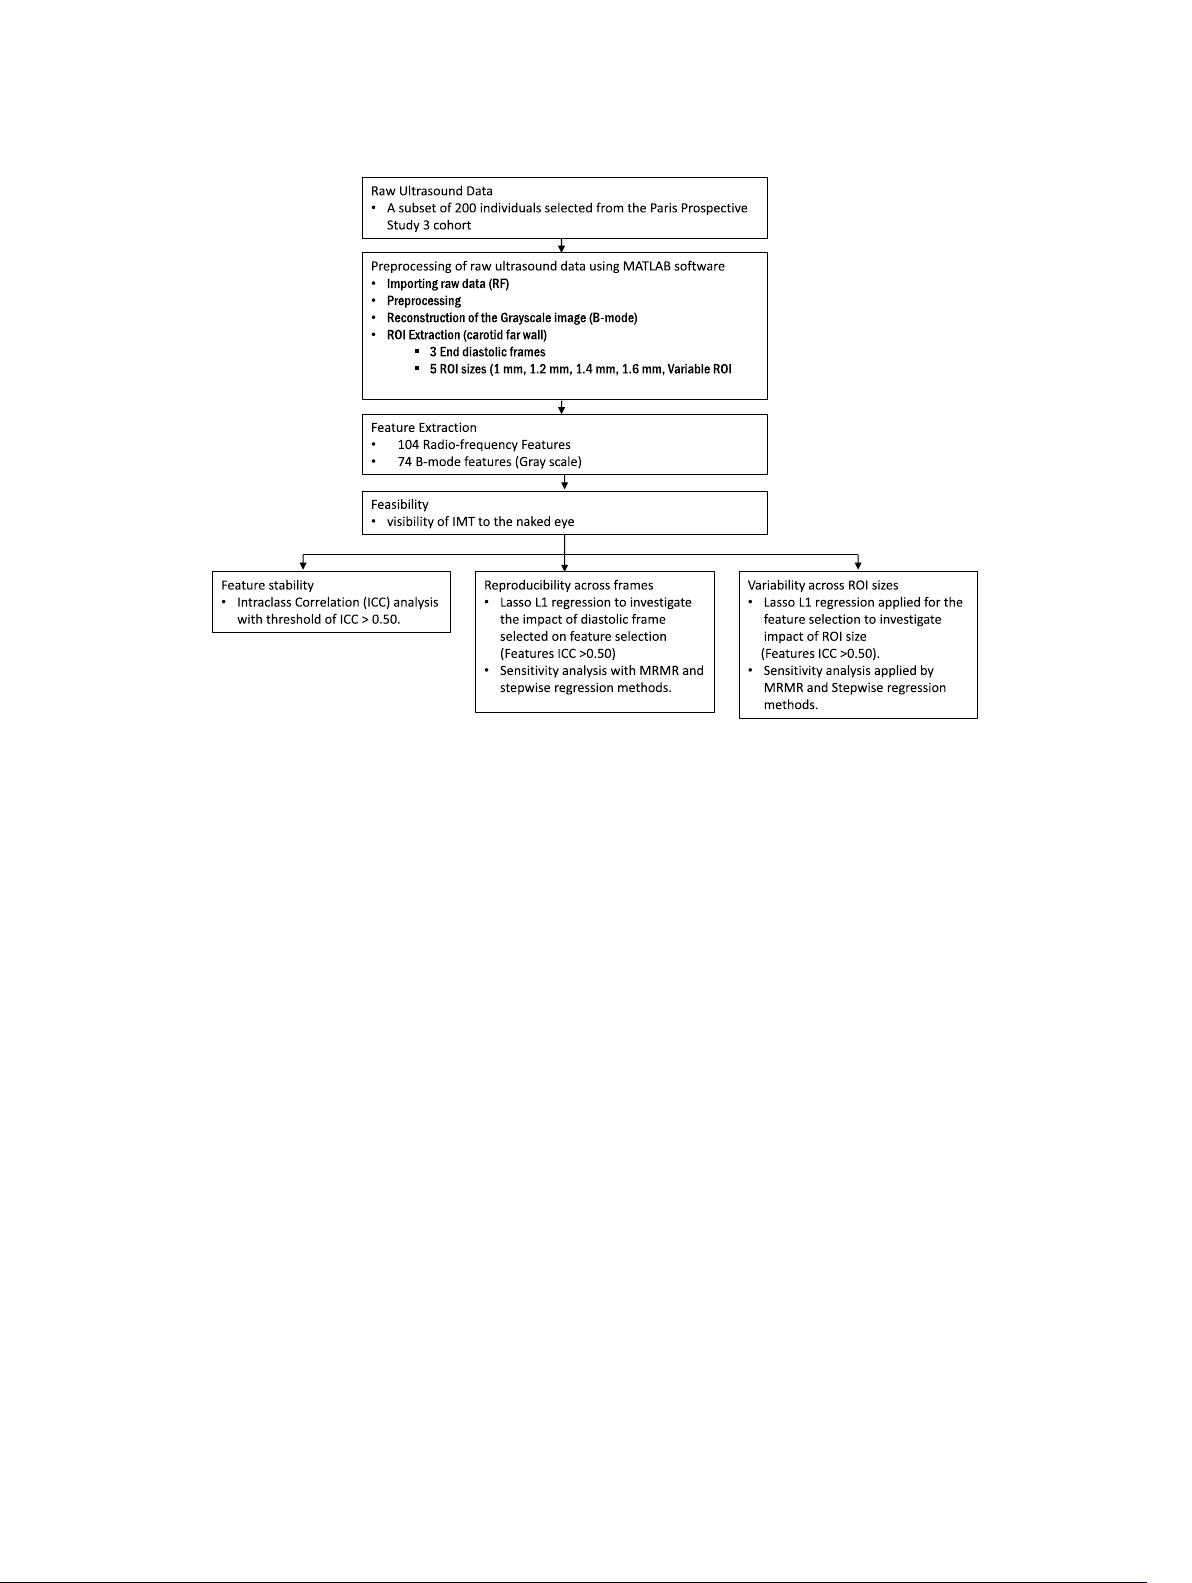
techniques (see workflow diagram Fig. 2). The analyses plementary file). These features included 40 B-mode
were carried out using RStudio version 2023.9.0.463 features (5 first-order, 21 higher-order, 9 wavelet trans-
(Boston, MA), utilizing glmnet, mlr, caret, dplyr, form features) and 8 RF features (5 first-order and 3
mRMRe, e1071 and tidyverse packages. time series features). Jadoon
et al. Artery Research (2025) 31:6 Page 5 of 12
Fig. 2 Comprehensive workflow for radiomics-based analysis of vascular ageing using b-mode and radiofrequency ultrasound imaging of the right common carotid artery
3.3 Reproducibility of Features Across Frames
Consistent and similar results were obtained with dif-
Selected features varied in number from two to ten, ferent feature selection models (MRMR and stepwise
but feature type and class were similar across frames. regression, in Table S2 of Supplementary file).
Selected features included B-mode first-order and
higher-order features, as well as RF first-order features 4 Discussion
(Table 4). L1 regularization demonstrated consistent This study established that feature extraction from the
R2 (0.09–0.14 in the train set, 0.05–0.13 in the test set) IM complex was feasible in 95% of cases for both RF and
and mean square error values (32.3–34.3 in the train set, B-mode files. Approximately, 28% of the features were
30.7–42.3 in the test set) across the four datasets. Simi-
found to be stable across the three end-diastolic frames
lar and consistent model performance was observed with for all five ROI sizes. We further investigated the impact
different feature selection models (MRMR and stepwise of frame and ROI size variability on extracted features
regression, in Table S2 of Supplementary file).
using the feature selection technique. We found no
impact on number, type and value of selected features
3.4 Variability Between ROI Sizes
due to frame variability. However, the ROI size did have
The feature selection model performance varied consid-
an effect on the feature extraction, suggesting that the
erably across different ROI sizes. The best performance ROI size should be carefully chosen.
was obtained by the Var ROI size, as expected; the model
Radiomic analysis is increasingly utilized in carotid
failed to select any feature in the 1.6 ROI size dataset. US, primarily for plaque analysis with findings typically
Overall MSE values ranged from 33.15–36.22 in the train derived from B-mode imaging [24]. This study is likely
to 33.07–34.83 in the test set and R2 values ranged from the first to apply radiomics in two novel ways: first, by
0.07–0.15 in the train set to 0.07–0.17 in the test dataset. focusing on the intima–media complex to character-
Interestingly, model performance and feature selected ize wall ultrastructure rather than solely on plaque;
in ROI size 1.0 and 1.2 datasets were similar to variable and second, by utilizing both B-mode images and raw
ROI size (Table 5). Furthermore, features selected in in radio-frequency signals, which contain richer spatial
ROI size 1.0 and 1.2 datasets were more numerous than information than B-mode alone [26]. While the com-
those in Var ROI size, but the type and class were similar. bined use of RF and B-mode US radiomic features has
Jadoon et al. Artery Research (2025) 31:6 Page 6 of 12 - y y y y coars mit y mit mit or mit or or or mit or iance y iance iance y ar iance ar ar y ar y op viation op y e Non-unif centage e V op es op y y
one Emphasis one Emphasis evel Non-unif er evel V evel Nonunif centage
ength Nonunif er evel V ength V y tur op gy op -Siz -Siz y-L y-L t Run Emphasis y-L y-L op ean value ewness tosis edian value ean entr ength ge Z ge number emphasis ( Fea M Sk Kur Entr Ener M Stand de
M Entr Contrast Angular second moment
Coarseness Contrast Busyness Complexit Str
Small Z Lar Gra Zone Zone P Gra Zone Zone entr
Shor Long Run Emphasis Gra Run-L Run P Gra Run-L Run entr
Small number emphasis (finess index) lar ness index) Number non-unif Entr DCENT entr t) coun n = Total Number ( 7 4 5 8 8 5 ix ix ix atr atr atr evel ix (NGLDM) ey L atr one M ength M e Z ependence lass ing Gr e C evel Distance M evel Siz evel Run L evel D a tur ix ey L ey L ey L y L atr Fea ependence M Gr (GLDM) Neighbor D Gr (GLSZM) Gr (GLRLM) Gra M e tur ex es (t es eatur eatur ype der F e T der F es) tur Fea igher Or First Or H featur es and their Classes eatur adiomic F ted R trac ethod y of Ex tion M ac tr 1 Summar e Ex tur Table Fea B-mode Jadoon
et al. Artery Research (2025) 31:6 Page 7 of 12 a a ix ix a a ix atr y viation) ix atr M 4 atr atr M d de M oss y M ean) a ity es one ength es acr relation viation oid verage y cept y e Z ependence gy er er ocor it er er relation op d de ity er er er Featur eatur iance nt w tor op a es ut or ontrast o count o SD ett 1–12 (M er er
der evel Distance evel Siz evel Run L evel D tur ett 1–12 (standar verage tral slope tral I aramet aramet
tral centr tral Bandwidth tral flatness tions y L
ean homogeneit ean ener ean local homogeneit ean A ean C ean Dissimilar ean sum a ean entr ean C ean var eanV id Band F nal po ess fac tosis oss z oss z ey L ey L ey L ec Fea veraged f M M M M M M M M M M M SdV FD a FD standar FD lacunar
spec spec M S1 paramet S2 P S3 P S4 paramet sig Spec Spec spec Cr Kur cr cr Peaks Fussy Entr M paramet First Or Gr Gr Gr Gra A dir t) coun n = Total Number ( 10 24 3 12 5 1 43 - 4 er oss es trum diff es acr eatur es es ibution mean spec lass eatur eatur eatur ies e C er ap tur tions tal Analysis f tral F ram ec agami distr avelet f ewness of Fea veraged f A dir W Frac Spec Time S Nak diag Sk ence M es m or eatur ibution es ype ransf y domain e T omain F eatur ami distr tur tal Analysis avelet T Fea W Frac Frequenc Time D Nagak Spatial F ethod tion M y ac tr 1 (continued) e Ex equenc -fr tur Table Fea Radio
Jadoon et al. Artery Research (2025) 31:6 Page 8 of 12 a
Table 2 Summary of baseline characteristics of the population a ix ix a a atr ix ix atr Variables Missing data Overall M 4 atr atr M
Population(n = 190) oss M M a es one ength Sex (Female) (n, %) 0 92 (48.4) es acr e Z ependence Smokers (n, %) 0 34 (17.8) Featur eatur a Diabetes (n, %) 0 37(19.4) es
der evel Distance evel Siz evel Run L evel D Hypertensive (n, %) 0 77(40.5) tur tions ey L ey L ey L y L ec
Antidiabetic Drug Users (n, %) 1 21(11.05) Fea veraged f First Or Gr Gr Gr Gra A dir
Antihypertensive Drug Users (n, 0 40(21.05) %) t)
Lipid Lowering Drug Users (n, %) 0 40(21.05) Age (years) 0 59.5 ± 6.2 coun n = BMI (kg/m2) 0 25.2 ± 3.3 Mean Blood Pressure (mmHg) 0 94 ± 11 SBP (mmHg) 0 132 ± 18 DBP (mmHg) 0 76 ± 9 Heart Rate (bat/min) 0 64 ± 10 Total Number ( 43 HDL (mg/dL) 0 59.1 ± 1 5.6 LDL (mg/dL) 0 142.9 ± 34.3 Cholesterol (mg/dL) 0 222.6 ± 38.4
Data for categorical variables are expressed as total number counts (n = counts) enuation map
and percentage of total and for continuous variables as Mean ± SD (standard deviation) lass gy att e C tur t Ener ec
Table 3 Summary of carotid geometric and mechanical Fea Dir characteristics Carotid Variables Missing data Overall
Population(n = 190) ts) coun
Presence of carotid Plaque (n, %) 0 30 (15.7) n = Distension (μm) 3 359.88 ± 121 es (
External diastolic Diameter (mm) 0 7.17 ± 0.73 ype tur e T ea Compliance (m2/kPa) 3 0.58 ± 0.23 tur
Distensibility coefficient (kPa- 3 21.43 ± 8.63 1*10–3) Fea
Carotid Pulse Wave velocity (m/s) 3 7.47 ± 1.57 -mode based f e family IMT (um) 0 631 ± 108.6 tur ea
Data for categorical variables are expressed as total number counts (n = counts)
and percentage of total and for continuous variables as Mean ± SD (standard deviation) -mode f
been applied in oncology, its application in cardiovas- ts including both RF and B ibed in the B
cular radiomics remains unexplored. Incorporating oun
RF-based radiomic features has improved accuracy in es descr
cancer detection and characterization compared to tur ea
B-mode alone in breast cancer [50, 51]. ethod otal number c
The main objective of our study was to assess the fea-
sibility and reproducibility of extracting radiomic fea- tion M ac
tures from the IM complex using both RF and B-mode tr essed as t
US data. In terms of feasibility, RF and B-mode feature xpr 1 (continued) e Ex e e tes the same set of f
extraction was successfully performed on 190 out of tur ta ar
200 clips. The only clips where feature extraction was Table Fea Da Indicaa Jadoon
et al. Artery Research (2025) 31:6 Page 9 of 12
Table 4 Results of reproducibility of features across frames
Frame No Roi size (mm) Model
Train MSE Train R2 Test MSE Test R2 Feature Feature Name (Feature Feature Type selected class) 1 Var Lasso L1 34.36 0.09 40.28 0.05 4 Busyness and complex- B-mode higher order ity (NGLDM), Gray-Level and Wavelet transform Nonuniformity (GLRLM), SdVett_5 (Wavelet trans- form) 2 Var Lasso L1 32.31 0.14 38.31 0.13 10 Standard Deviation (First B-mode first order, higher order), Entropy (GLDM), order, wavelet and RF first Contrast (NGTDM), Mean order entropy (Avg features), Gray-Level Variance (GLRLM), meanVett_3, SdVett_5, SdVett_9 (Wave- let transform), and RF First order: Median (DEA) and Median (SSD) 3 Var Lasso L1 33.73 0.112 42.32 0.11 2
Gray-Level Nonuniformity B- mode Higher order
(GLRLM), SdVett_9(Wavelet and Wavelet transform transform) Med Var Lasso L1 33.86 0.13 30.79 0.11 3 Complexity (NGTDM), B- mode Higher order
Gray-Level Nonuniformity and Wavelet transform (GLRLM), SdVett_9 (Wave- let transform)
Dependent Variable: Chronological age. The Mean square Error (MSE) is represented in years
DEA Direct Energy attenuation map, GLDM Grey Level Distance Matrix, GLRLM Grey Level Run Length Matrix, NGLDM Neighboring Grey Level Dependence Matrix, SSD
Skewness of spectrum difference Map
not feasible were those in which the IMT was not vis-
indicating tissue structure. Wavelet features capture ible at all.
multi-scale structural changes, detecting alterations in
Once feasibility was established, we investigated issues the IM complex [52]. RF features provide insights into
related to ROI delineation, which is crucial for feature acoustic properties, revealing tissue mechanical charac-
extraction integrity. Indeed, inaccurate ROI delineation teristics [33, 53, 54].
could lead to incomplete or inaccurate representation of
Second, we evaluated whether a fixed, automatically
the target anatomical structure (IM complex). In particu-
chosen, ROI size could provide results similar compared
lar, we investigated the impact of the cardiac cycle frame to a tailored ROI size manually drawn by an operator.
(temporal aspect) and of the size of the region of interest Our results show that fixed ROI sizes of 1.0 or 1.2 mm,
(spatial aspect) on the radiomic features.
but not 1.4 and 1.6 mm, provide similar results in terms
First, our analysis of frame variability sought to rec-
of feature reproducibility and selection compared to the
ognize stable and reproducible features across 3 end-
variable ROI. This suggests that the choice of ROI size is
diastolic frames. By intraclass correlation coefficient, we critical in optimizing the extraction of relevant features,
identified a robust set of features consistently present highlighting the importance of selecting an appropriate
irrespective of the frame and ROI size (from B-mode size tailored to the anatomical characteristics of the IM
first-order, higher-order, wavelet, RF first-order, and time complex. Inclusion of portions of the adventitia in the series classes).
ROI significantly alter the radiomic feature profile.
We further investigated the impact of frame variability
Utilizing this methodological pipeline for predictive
on feature selection using chronological age as an out-
modelling may offer the potential to capture both athero-
come. The consistent selection of the same feature types sclerotic and arteriosclerotic features (biomarkers) using
across all frames (type of features) indicated that the a single, non-invasive CCA ultrasound. As vascular age-
choice of frame does not significantly impact the analy-
ing involves both atherosclerotic and arteriosclerotic pro-
sis, allowing for flexibility in frame selection without cesses, radiomic analysis may aid in the early detection of
compromising the integrity of the results. The selected vascular ageing, contribute to improved risk stratification
features from B-mode first-order features describe for vascular diseases, and provide additional insights into
intensity and contrast, reflecting IM complex density. carotid wall ultrastructure, potentially supporting timely
Higher-order features reveal texture and heterogeneity, interventions to reduce adverse outcomes.
Jadoon et al. Artery Research (2025) 31:6 Page 10 of 12
Table 5 Results of variability between ROI sizes
Median ROI size Model Train MSE Train R2 Test MSE Test R2 Feature Feature Name (Feature class) Feature Type Selected Med Var Lasso 33.86 0.13 30.79 0.17 3 Complexity (NGLDM), Gray- B-mode higher order and Wave- Level Nonuniformity (GLRLM), let transform SdVett_9 (Wavelet transform) Med 1 Lasso 33.15 0.15 33.07 0.11 5 Coarseness (NGTDM), Mean B-mode higher order, Wavelet Correlation (Avg features), transform and Rf first order Run length Non-uniformity (GLRLM), meanVett_3 (Wavelet
transform), and RF First order: Standard deviation (DEA) Med 1.2 Lasso 33.24 0.14 31.87 0.15 6 Entropy (First order), Coarse- B-mode first, higher order, ness (NGTDM), Mean variance
Wavelet transform and Rf first (Avg features), SdVett_1 order and SdVett_9 (Wavelet
transform) and RF first order: Standard deviation (DEA) Med 1.4 Lasso 36.22 0.07 34.83 0.07 3
Skewness (first order), Coarse- B-mode first and higher order ness (NGTDM), Gray level non- uniformity (GLRLM) Med 1.6 Lasso – – – – 0 – –
Dependent Variable: Chronological age. The Mean square Error (MSE) is represented in years
DEA Direct Energy attenuation map, GLDM Grey Level Distance Matrix, GLRLM Grey Level Run Length Matrix, NGLDM Neighboring Grey Level Dependence Matrix, SSD
Skewness of spectrum difference Map
We acknowledge some limitations in this study. First, Abbreviations
since this is a pilot investigation, it was conducted in a CAC Calcium score CT Computed tomography
small highly selected population sample. We plan to val- EVA Early vascular ageing
idate our findings in an external dataset that includes a ICC Intraclass correlation
broader age range and diverse ethnicities. Second, fea- IM Intima–media IMT Intima–media thickness
ture extraction has been performed only in end-diastolic LASSO
Least absolute shrinkage and selection operator
frames: exploring the potential impact of different car- MRI Magnetic resonance imaging
diac cycle phases on feature extraction could provide MRMR
Minimum redundancy maximum relevance MSE Mean square error
additional insights. Third, the current study is not pow- PWV Pulse wave velocity
ered for predictive modelling, but only to investigate PPS3 Paris Prospective Study III
the robustness of the approach. Further validation and RF Radio frequency ROI Region of interest
refinement, particularly with a larger dataset, are needed SD Standard deviation
before making definitive conclusions about its effective- SUPERNOVA Supernormal vascular ageing
ness. Fourth, clinical relevance of the extracted features T2D Type 2 diabetes US Ultrasound
as well as potential confounding factors such as comor- VAR Variable
bidities, lifestyle factors and environmental exposures is
beyond the scope of this article, but needs to be investi-
Supplementary Information gated in future studies.
The online version contains supplementary material available at https:// doi.
org/ 10. 1007/ s44200- 025- 00076-w. 5 Conclusions
Our study demonstrates the feasibility of radiomic US
Below is the link to the electronic supplementary material.Supplementary file1 (DOCX 25 KB)
feature extraction from the IM complex using both RF
and B-mode US data, showing minimal sensitivity to var- Author Contributions
iations in frame selection. However, ROI size significantly MJ design and development of GUI, methodology, data analysis, interpreta-
affects feature extraction, highlighting the importance tion of data and drafting the manuscript. FP, EB, FF worked on the design
of precise ROI delineation in radiomics research. Build-
and development of the GUI, interpretation of data and critical review of the
manuscript. HK data collection physician for PPS III study. XJ, JP conception,
ing on these methodological improvements, we aim to design and development of the PPS III study. PB, JP, RM conception of the
expand radiomics applications in vascular health as novel research, interpretation of results and critical review of the manuscript. biomarkers of vascular ageing. Jadoon
et al. Artery Research (2025) 31:6 Page 11 of 12 Funding
cardiovascular events in asymptomatic adult Americans. Eur Heart J
This work was supported by a research grant from the European Commission
Cardiovasc Imaging. 2018;19(9):1042–50.
Marie Skłodowska-Curie Actions PhD program: MINDSHIFT (grant number
11. Vasan RS, Pan S, Xanthakis V, Beiser A, Larson MG, Seshadri S, et al. Arte-
954798, website: http:// www. eumin dshift. eu). The PPS3 (Paris Prospective
rial stiffness and long-term risk of health outcomes: the framingham
Study III) was supported by grants from The National Research Agency (ANR),
heart study. Hypertension. 2022;79(5):1045–56.
the Research Foundation for Hypertension (FRHTA), the Research Institute in
12. Van Sloten TT, Sedaghat S, Laurent S, London GM, Pannier B, Ikram
Public Health (IRESP) and the Region Ile de France (Domaine d’Intérêt Majeur)
MA, et al. Carotid stiffness is associated with incident stroke. J Am Coll
and the H2020 ESCAPENET research program.
Cardiol. 2015;66(19):2116–25.
13. Willeit P, Tschiderer L, Allara E, Reuber K, Seekircher L, Gao L, et al.
Availability of Data and Materials
Carotid intima-media thickness progression as surrogate marker for
The data used in the current study are not publicly available due privacy issues
cardiovascular risk: meta-analysis of 119 clinical trials involving 100 667
but it will be made available on reasonable request. All data analyzed in this
patients. Circulation. 2020;142(7):621–42.
study are presented within the paper and supplementary material.
14. Yeboah J, McClelland RL, Polonsky TS, Burke GL, Sibley CT, O’Leary D,
et al. Comparison of novel risk markers for improvement in car- Declarations
diovascular risk assessment in intermediate-risk individuals. JAMA. 2012;308(8):788.
15. Reesink KD, Spronck B. Constitutive interpretation of arterial stiffness in
Ethics Approval and Consent to Participate
clinical studies: a methodological review. Am J Physiol-Heart Circ Physiol.
The study protocol was approved by the Ethics Committee of Cochin Hospital 2019;316(3):H693-709.
(Paris, France) and was registered on the World Health Organization Interna-
16. Rogers W, Thulasi Seetha S, Refaee TAG, Lieverse RIY, Granzier RWY,
tional Clinical Trials Registry platform (NCT00741728) on 08/25/2008. A total
Ibrahim A, et al. Radiomics: from qualitative to quantitative imaging. Br J
of 10,157 men and women underwent a comprehensive preventive medical
Radiol. 2020;93(1108):20190948.
checkup, after signing an informed consent form.
17. Van Griethuysen JJM, Lambregts DMJ, Trebeschi S, Lahaye MJ, Bakers
FCH, Vliegen RFA, et al. Radiomics performs comparable to morphologic Consent for Publication
assessment by expert radiologists for prediction of response to neo-
All authors read and approved the final manuscript for publication.
adjuvant chemoradiotherapy on baseline staging MRI in rectal cancer.
Abdom Radiol. 2020;45(3):632–43. Competing of Interests
18. Wang J, Yu X, Zeng J, Li H, Qin P. Radiomics model for preoperative
The authors declare no competing interests.
prediction of 3-year survival-based CT image biomarkers in esophageal
cancer. Eur Arch Otorhinolaryngol. 2022;279(11):5433–43. Author details
19. Tsarouchi MI, Vlachopoulos GF, Karahaliou AN, Vassiou KG, Costaridou LI.
1 Université Paris Cité, Inserm, PARCC, F-75015 Paris, France. 2 Clinical Phar-
Multi-parametric MRI lesion heterogeneity biomarkers for breast cancer
macology Unit, AP-HP, Hôpital Européen Georges Pompidou, F-75015 Paris,
diagnosis. Physica Med. 2020;80:101–10.
France. 3 Institute of Clinical Physiology, Italian National Research Council
20. Bhardwaj D, Dasgupta A, DiCenzo D, Brade S, Fatima K, Quiaoit K, et al. (CNR), Pisa, Italy.
Early changes in quantitative ultrasound imaging parameters during
neoadjuvant chemotherapy to predict recurrence in patients with locally
Received: 27 September 2024 Accepted: 10 March 2025
advanced breast cancer. Cancers. 2022;14(5):1247.
21. Cui Y, Wang G, Ren J, Hou L, Li D, Wen Q, et al. Radiomics features at
multiparametric MRI predict disease-free survival in patients with locally
advanced rectal cancer. Acad Radiol. 2022;29(8):e128–38.
22. Cheng X, Dong Z, Liu J, Li H, Zhou C, Zhang F, et al. Prediction of carotid References
in-stent restenosis by computed tomography angiography carotid
1. Boutouyrie P, Chowienczyk P, Humphrey JD, Mitchell GF. Arterial stiffness
plaque-based radiomics. JCM. 2022;11(11):3234.
and cardiovascular risk in hypertension. Circ Res. 2021;128(7):864–86.
23. Dong Z, Zhou C, Li H, Shi J, Liu J, Liu Q, et al. Radiomics versus conven-
2. Laurent S. Defining vascular aging and cardiovascular risk. J Hypertens.
tional assessment to identify symptomatic participants at carotid com- 2012;30:S3-8.
puted tomography angiography. Cerebrovasc Dis. 2022;51(5):647–54.
3. Nilsson PM, Boutouyrie P, Laurent S. Vascular aging: a tale of EVA and
24. Hou C, Li S, Zheng S, Liu LP, Nie F, Zhang W, et al. Quality assessment of
ADAM in cardiovascular risk assessment and prevention. Hypertension.
radiomics models in carotid plaque: a systematic review. Quant Imaging 2009;54(1):3–10.
Med Surg. 2024;14(1):1141–54.
4. Nilsson MP. Early vascular ageing a concept in development. Eur Endo-
25. Huang Z, Cheng XQ, Liu HY, Bi XJ, Liu YN, Lv WZ, et al. Relation of carotid crinol. 2015;11(1):26–31.
plaque features detected with ultrasonography-based radiomics to clini-
5. Bruno RM, Nilsson PM, Engström G, Wadström BN, Empana JP, Bout-
cal symptoms. Transl Stroke Res. 2022;13(6):970–82.
ouyrie P, et al. Early and supernormal vascular aging: clinical character-
26. Le EPV, Rundo L, Tarkin JM, Evans NR, Chowdhury MM, Coughlin PA,
istics and association with incident cardiovascular events. Hyperten-
et al. Assessing robustness of carotid artery CT angiography radiomics sion. 2020;76(5):1616–24.
in the identification of culprit lesions in cerebrovascular events. Sci Rep.
6. Laurent S, Boutouyrie P, Cunha PG, Lacolley P, Nilsson PM. Concept of 2021;11(1):3499.
extremes in vascular aging: from early vascular aging to supernormal
27. Liu Y, Kong Y, Yan Y, Hui P. Explore the value of carotid ultrasound radiom-
vascular aging. Hypertension. 2019;74(2):218–28.
ics nomogram in predicting ischemic stroke risk in patients with type 2
7. Li A, Yan J, Zhao Y, Yu Z, Tian S, Khan AH, et al. Vascular aging: assess-
diabetes mellitus. Front Endocrinol. 2024;19(15):1357580.
ment and intervention. CIA. 2023;18:1373–95.
28. Van Engelen A, Wannarong T, Parraga G, Niessen WJ, Fenster A, Spence
8. Jamthikar AD, Gupta D, Saba L, Khanna NN, Viskovic K, Mavrogeni S,
JD, et al. Three-dimensional carotid ultrasound plaque texture predicts
et al. Artificial intelligence framework for predictive cardiovascular
vascular events. Stroke. 2014;45(9):2695–701.
and stroke risk assessment models: a narrative review of integrated
29. Molinari F, Zeng G, Suri JS. A state of the art review on intima–
approaches using carotid ultrasound. Comput Biol Med. 2020;126:
media thickness (IMT) measurement and wall segmentation tech- 104043.
niques for carotid ultrasound. Comput Methods Programs Biomed.
9. Mantella LE, Colledanchise KN, Hétu MF, Feinstein SB, Abunassar J, Johri 2010;100(3):201–21.
AM. Carotid intraplaque neovascularization predicts coronary artery
30. Scicolone R, Vacca S, Pisu F, Benson JC, Nardi V, Lanzino G, et al. Radiomics
disease and cardiovascular events. Eur Heart J Cardiovasc Imaging.
and artificial intelligence: general notions and applications in the carotid 2019;20(11):1239–47.
vulnerable plaque. Eur J Radiol. 2024;176: 111497.
10. Sillesen H, Sartori S, Sandholt B, Baber U, Mehran R, Fuster V.
Carotid plaque thickness and carotid plaque burden predict future
Jadoon et al. Artery Research (2025) 31:6 Page 12 of 12
31. Ricci V, Cocco G, Donati D, Farì G, Chang KV, Özçakar L. From histopathol-
2013 IEEE international ultrasonics symposium (IUS) [Internet]. Prague,
ogy to high-resolution ultrasound imaging of skin scars. Diagnostics.
Czech Republic: IEEE; 2013 [cited 2024 Jul 17]. p. 872–5. Available from: 2023;13(24):3629.
http:// ieeex plore. ieee. org/ docum ent/ 67252 96/
32. Lacolley P, Regnault V, Segers P, Laurent S. Vascular smooth muscle cells
53. Dong Y, Wang QM, Li Q, Li LY, Zhang Q, Yao Z, et al. Preoperative predic-
and arterial stiffening: relevance in development, aging, and disease.
tion of microvascular invasion of hepatocellular carcinoma: radiomics
Physiol Rev. 2017;97(4):1555–617.
algorithm based on ultrasound original radio frequency signals. Front
33. Hu R, Singla R, Deeba F, Rohling RN. Acoustic shadow detection: study Oncol. 2019;14(9):1203.
and statistics of B-mode and radiofrequency data. Ultrasound Med Biol.
54. Azzopardi C, Camilleri KP, Hicks YA. Carotid ultrasound segmentation 2019;45(8):2248–57.
using radio-frequency derived phase information and gabor filters. In:
34. on behalf of the PPS3 Study Group, Empana JP, Bean K, Guibout C,
2015 37th annual international conference of the IEEE engineering in
Thomas F, Bingham A, et al. Paris prospective study III: a study of novel
medicine and biology society (EMBC) [Internet]. Milan: IEEE; 2015 [cited
heart rate parameters, baroreflex sensitivity and risk of sudden death. Eur
2024 May 2]. p. 6338–41. Available from: http:// ieeex plore. ieee. org/
J Epidemiol. 2011;26(11):887–92. docum ent/ 73198 42/
35. Standard B-mode ultrasound measures local carotid artery characteris-
tics as reliably as radiofrequency phase tracking in symptomatic carotid Publisher’s Note
artery patients - Ultrasound in medicine and biology [Internet]. [cited
2024 Aug 21]. Available from: https:// www. umbjo urnal. org/ artic le/ S0301-
Springer Nature remains neutral with regard to jurisdictional claims in pub- 5629(15) 00476-7/ abstr act
lished maps and institutional affiliations.
36. Ariyoshi K, Okuya S, Kunitsugu I, Matsunaga K, Nagao Y, Nomiyama R,
et al. Ultrasound analysis of gray-scale median value of carotid plaques
is a useful reference index for cerebro-cardiovascular events in patients
with type 2 diabetes. J Diabetes Invest. 2015;6(1):91–7.
37. Sim Y, Lee SE, Kim EK, Kim S. A radiomics approach for the classification
of fibroepithelial lesions on breast ultrasonography. Ultrasound Med Biol. 2020;46(5):1133–41.
38. Allison JW, Barr LL, Massoth RJ, Berg GP, Krasner BH, Garra BS. Under-
standing the process of quantitative ultrasonic tissue characterization.
Radiographics. 1994;14(5):1099–108.
39. Kim JK, Park HW. Statistical textural features for detection of micro-
calcifications in digitized mammograms. IEEE Trans Med Imaging. 1999;18(3):231–8.
40. Arivazhagan S, Ganesan L. Texture classification using wavelet transform.
Pattern Recogn Lett. 2003;24(9–10):1513–21.
41. Al-Kadi OS, Watson D. Texture analysis of aggressive and nonaggressive
lung tumor CE CT images. IEEE Trans Biomed Eng. 2008;55(7):1822–30.
42. Alic L, Niessen WJ, Veenland JF. Quantification of heterogeneity as a
biomarker in tumor imaging: a systematic review. PLoS ONE. 2014;9(10): e110300.
43. Van Griethuysen JJM, Fedorov A, Parmar C, Hosny A, Aucoin N, Narayan
V, et al. Computational radiomics system to decode the radiographic
phenotype. Can Res. 2017;77(21):e104–7.
44. Zheng Q, Lin C, Xu D, Zhao H, Song M, Ou D, et al. A preliminary study on
exploring a potential ultrasound method for predicting cervical cancer. J Cancer. 2022;13(3):793–9.
45. Xiao T, Shen W, Wang Q, Wu G, Yu J, Cui L. The detection of prostate
cancer based on ultrasound RF signal. Front Oncol. 2022;12(12): 946965.
46. Shams E, Karimi D, Moussavi Z. Bispectral analysis of tracheal breath
sounds for Obstructive Sleep Apnea. In: 2012 annual international confer-
ence of the IEEE engineering in medicine and biology society [Internet].
San Diego, CA: IEEE; 2012 [cited 2024 Feb 12]. p. 37–40. Available from:
http:// ieeex plore. ieee. org/ docum ent/ 63458 65/
47. Tsui PH, Zhou Z, Lin YH, Hung CM, Chung SJ, Wan YL. Effect of ultrasound
frequency on the Nakagami statistics of human liver tissues. PLoS ONE. 2017;12(8): e0181789.
48. Wang Q, Dong Y, Xiao T, Zhang S, Yu J, Li L, et al. Prediction of pro-
grammed cell death protein 1 in hepatocellular carcinoma patients using
radiomics analysis with radiofrequency-based ultrasound multifeature
maps. BioMed Eng OnLine. 2022;21(1):24.
49. Tibshirani R. Regression shrinkage and selection via the lasso. J R Stat Soc
Ser B Stat Methodol. 1996;58(1):267–88.
50. Klimonda Z, Karwat P, Dobruch-Sobczak K, Piotrzkowska-Wróblewska
H, Litniewski J. Assessment of breast cancer response to neoadjuvant
chemotherapy based on ultrasound backscattering envelope statistics.
Med Phys. 2022;49(2):1047–54.
51. Tadayyon H, Sannachi L, Gangeh MJ, Kim C, Ghandi S, Trudeau M,
et al. A priori prediction of neoadjuvant chemotherapy response and
survival in breast cancer patients using quantitative ultrasound. Sci Rep. 2017;7(1):45733.
52. Golemati S, Lehareas S, Tsiaparas NN, Chatziioannou A, Nikita KS, Perrea
DN. Multiresolution features of carotid artery wall and plaque toward
identifying vulnerable asymptomatic cases from B-mode ultrasound. In:
Document Outline
- Radiomics Feature Extraction from Ultrasound B-Mode Images and Radio-Frequency Signals of the Carotid Arterial Wall: A Feasibility Study
- Abstract
- Background
- Methods
- Results
- Conclusion
- 1 Introduction
- 2 Materials and Methods
- 2.1 Study Population
- 2.2 Ultrasound Acquisition
- 2.3 Ultrasound Data Processing
- 2.4 Radiomic Features
- 2.5 Data Extraction Settings
- 2.6 Statistical Analysis and Feature Engineering
- 3 Results
- 3.1 Characteristics of the Study Population
- 3.2 Feature Stability Across the Frames
- 3.3 Reproducibility of Features Across Frames
- 3.4 Variability Between ROI Sizes
- 4 Discussion
- 5 Conclusions
- References
- Abstract
Tài liệu liên quan:
-
Cambridge IELTS 13 Test-1 Overview and Practice Review | Tài liệu Tiếng Anh
6 3 -
IELTS Test 2 Review - Cambridge 13 Preparation Guide | Tài liệu Tiếng Anh
9 5 -
Litfocus Litreading Survey: Student Reading Interests & Habits Questionnaire | Tài liệu Tiếng Anh
9 5 -

Sách Pre-intermediate Market leader - Business English Course Book
24 12 -

Exam booster for B1 preliminary and B1 preliminary for schools with answer key
10 5