Statistics for business and economics (13e) - chapter 6 notes môn Xác suất thống kê| Trường Đại học Ngoại Thương
It is not possible to talk about the probability of the randomvariable assuming a particular value.Instead, we talk about the probability of the random variable assuming a value within a given interval. Tài liệu giúp bạn tham khảo, ôn tập và đạt kết quả cao. Mời đọc đón xem!
Môn: Xác suất thống kê (FTU) 355 tài liệu
Trường: Trường Đại học Ngoại Thương 1.1 K tài liệu
Tác giả:


Preview text:
tistics for sinSleide s ss b yand Economics (13e) John Loucks
on, Sweeney, Williams, Camm, Cochran St. Edward’s 7 Cengage Learning University by John Loucks wards University
age Learning. May not be scanned, copied or duplicated, or posted to a publicly accessible website, in whole or in part, except for use as permitted in a license distributed with a certain product or service or
a password-protected website or school-approved learning management system for classroom use.
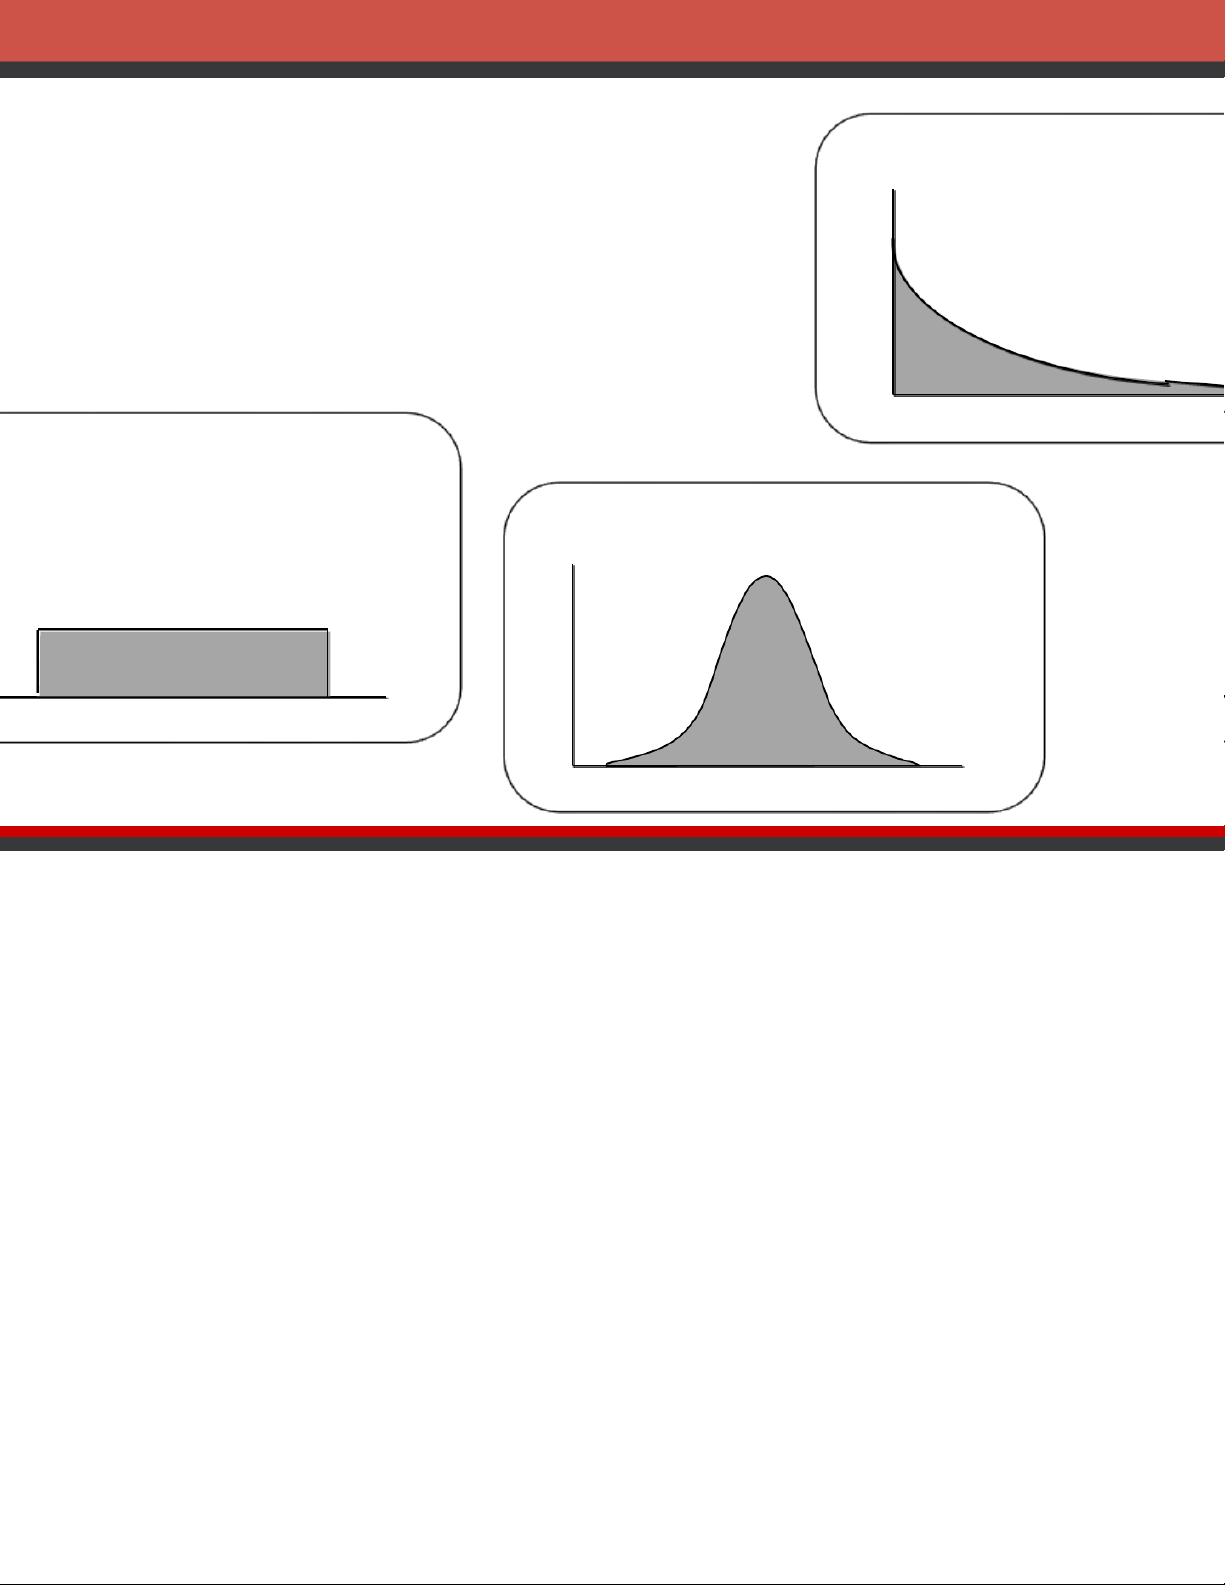
Statistics for Business and Economic apter 6 f (x)Exponential
ntinuous Probability Distributions iform Probability Distribution rmal Probability Distribution
ponential Probability Distribution Uniform x) f (x)Normal x x
age Learning. May not be scanned, copied or duplicated, or posted to a publicly accessible website, in whole or in part, except for use as permitted in a license distributed with a certain product or service or
a password-protected website or school-approved learning management system for classroom use.
Statistics for Business and Economic
ntinuous Probability Distributions
continuous random variable can assume any value in an interval on the real
ine or in a collection of intervals.
s not possible to talk about the probability of the random variable assuming particular value.
tead, we talk about the probability of the random variable assuming a value within a given interval.
age Learning. May not be scanned, copied or duplicated, or posted to a publicly accessible website, in whole or in part, except for use as permitted in a license distributed with a certain product or service or
a password-protected website or school-approved learning management system for classroom use.
Statistics for Business and Economic
ntinuous Probability Distributions
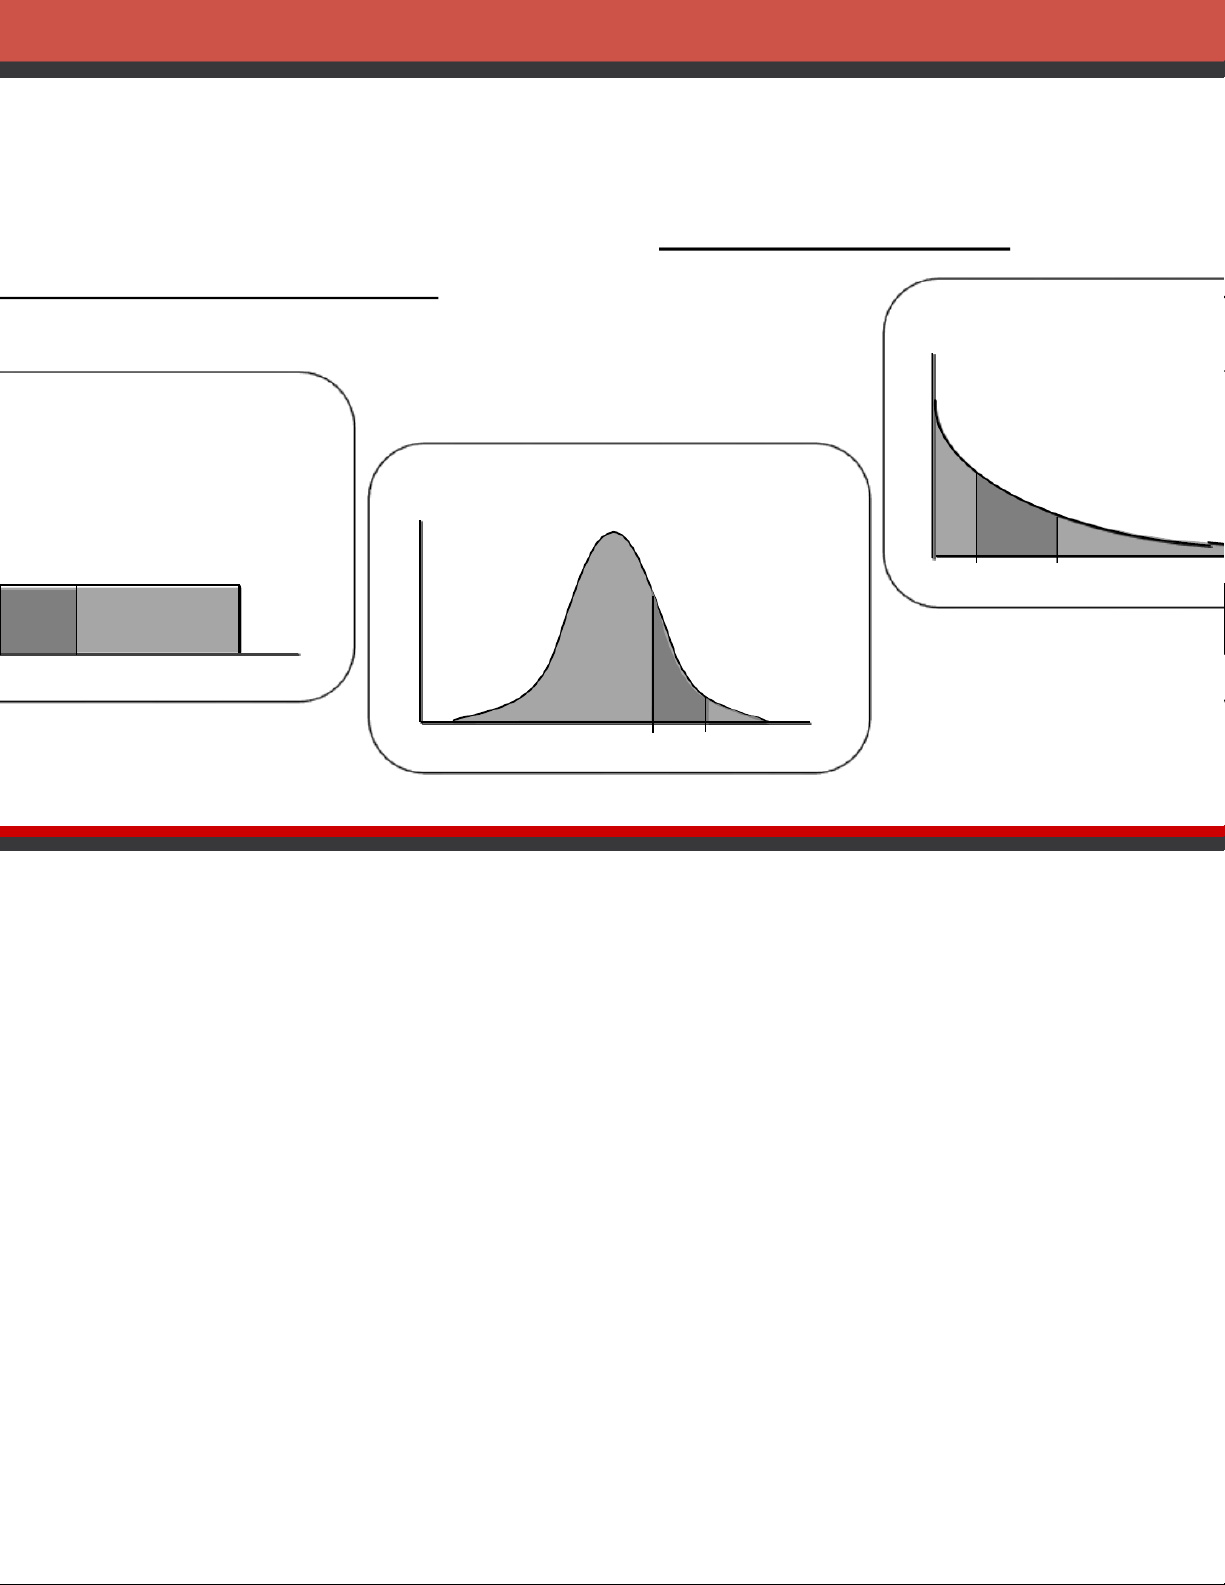
e probability of the random variable assuming a value within some given
nterval from x1to x2is defined to be the area under the graph of the
robability density function between x1and x2. f (x)Exponential Uniform f (x)Normal x1x2 x 1 x2 x x1x2
age Learning. May not be scanned, copied or duplicated, or posted to a publicly accessible website, in whole or in part, except for use as permitted in a license distributed with a certain product or service or
a password-protected website or school-approved learning management system for classroom use.
Statistics for Business and Economic iform Probability Distribution
random variable is uniformly distributed whenever the probability is
roportional to the interval’s length.
e uniform probability density function is: f (x) = 1/(b–a) for a= 0 elsewhere
where: a= smallest value the variable can assume
b= largest value the variable can assume
age Learning. May not be scanned, copied or duplicated, or posted to a publicly accessible website, in whole or in part, except for use as permitted in a license distributed with a certain product or service or
a password-protected website or school-approved learning management system for classroom use.
Statistics for Business and Economic iform Probability Distribution pected Value of x E(x) = (a+ b)/2 riance of x Var(x) = (b-a)2/12
age Learning. May not be scanned, copied or duplicated, or posted to a publicly accessible website, in whole or in part, except for use as permitted in a license distributed with a certain product or service or
a password-protected website or school-approved learning management system for classroom use.
Statistics for Business and Economic iform Probability Distribution xample: Slater's Buffet
Slater’s customers are charged for the amount of salad they take.
Sampling suggests that the amount of salad taken is uniformly distributed
between 5 ounces and 15 ounces.
age Learning. May not be scanned, copied or duplicated, or posted to a publicly accessible website, in whole or in part, except for use as permitted in a license distributed with a certain product or service or
a password-protected website or school-approved learning management system for classroom use.
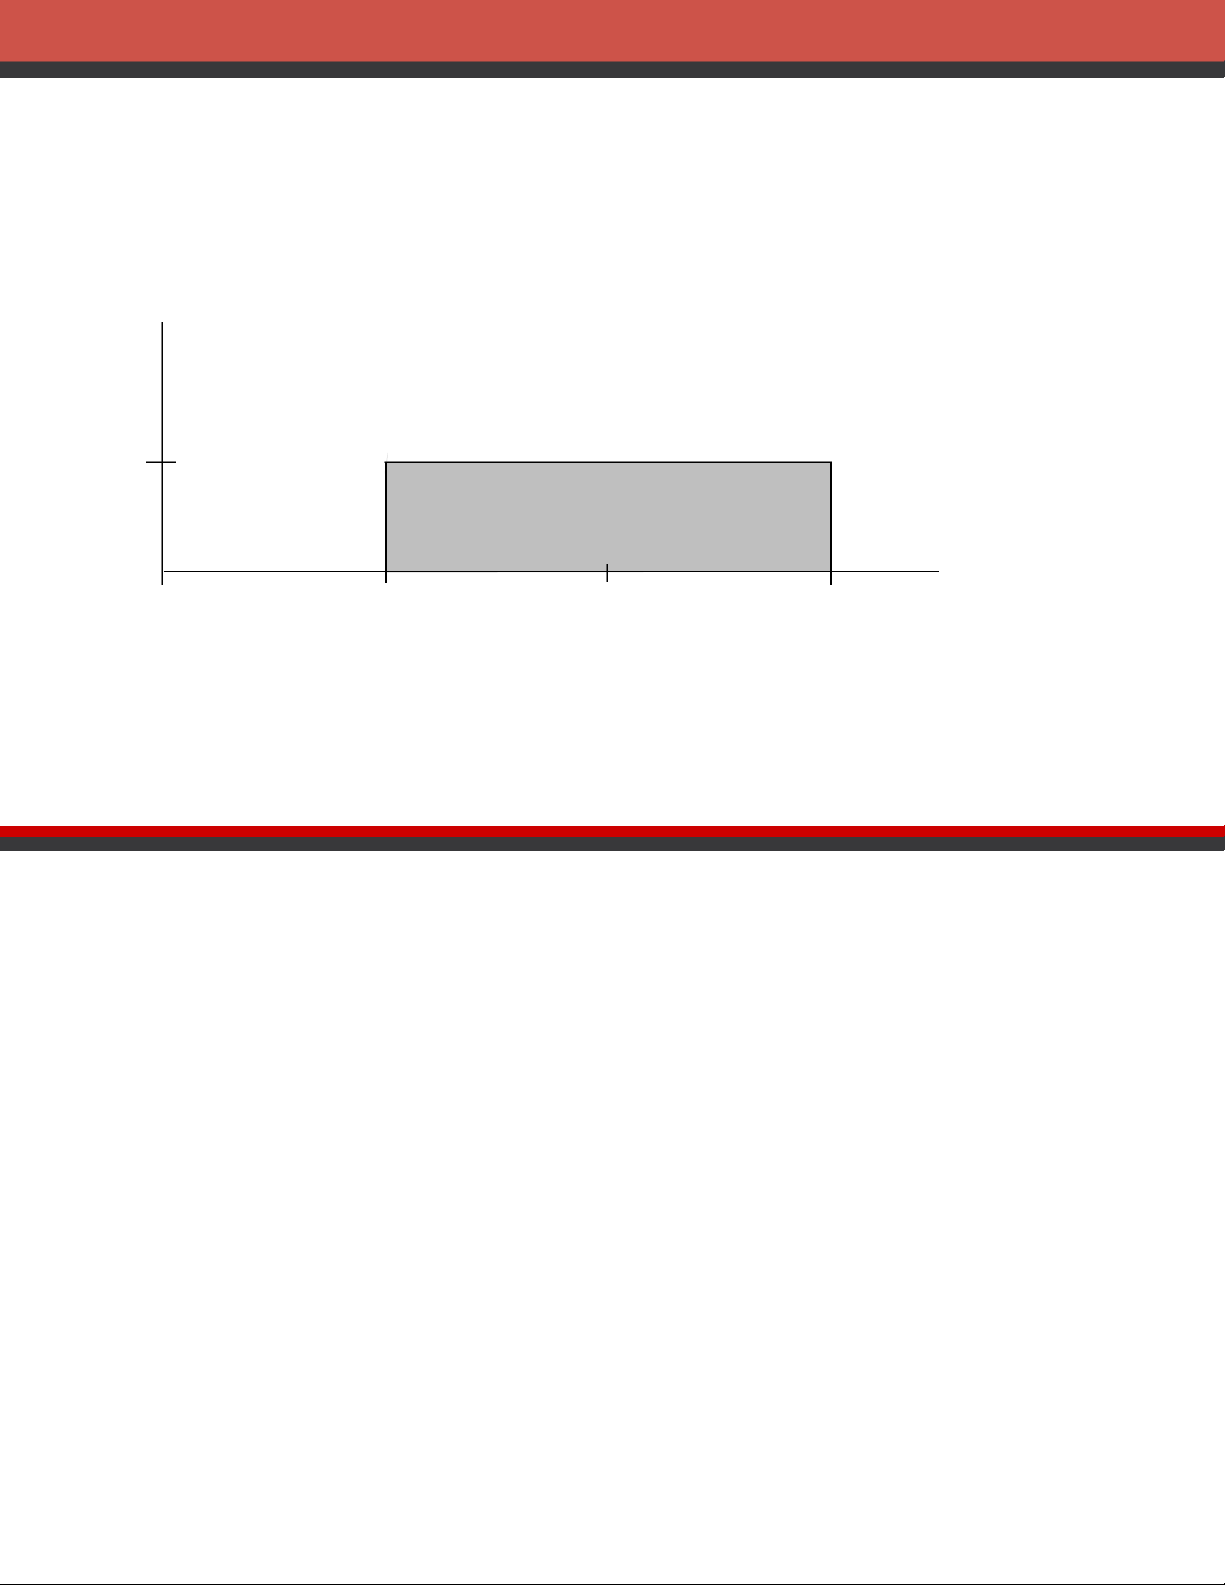
Statistics for Business and Economic iform Probability Distribution
niform Probability Density Function f(x) = 1/10 for 5 < x<15 = 0 elsewhere where: x= salad plate filling weight
age Learning. May not be scanned, copied or duplicated, or posted to a publicly accessible website, in whole or in part, except for use as permitted in a license distributed with a certain product or service or
a password-protected website or school-approved learning management system for classroom use.
Statistics for Business and Economic iform Probability Distribution pected Value of x E(x) = (a+ b)/2 = (5 + 15)/2 = 10 riance of x Var(x) = (b-a)2/12 = (15 –5)2/12 = 8.33
age Learning. May not be scanned, copied or duplicated, or posted to a publicly accessible website, in whole or in part, except for use as permitted in a license distributed with a certain product or service or
a password-protected website or school-approved learning management system for classroom use.
Statistics for Business and Economic iform Probability Distribution lad Plate Filling Weight f( ) x 1/10 x 0 510 15 Salad Weight (oz.)
age Learning. May not be scanned, copied or duplicated, or posted to a publicly accessible website, in whole or in part, except for use as permitted in a license distributed with a certain product or service or
a password-protected website or school-approved learning management system for classroom use.
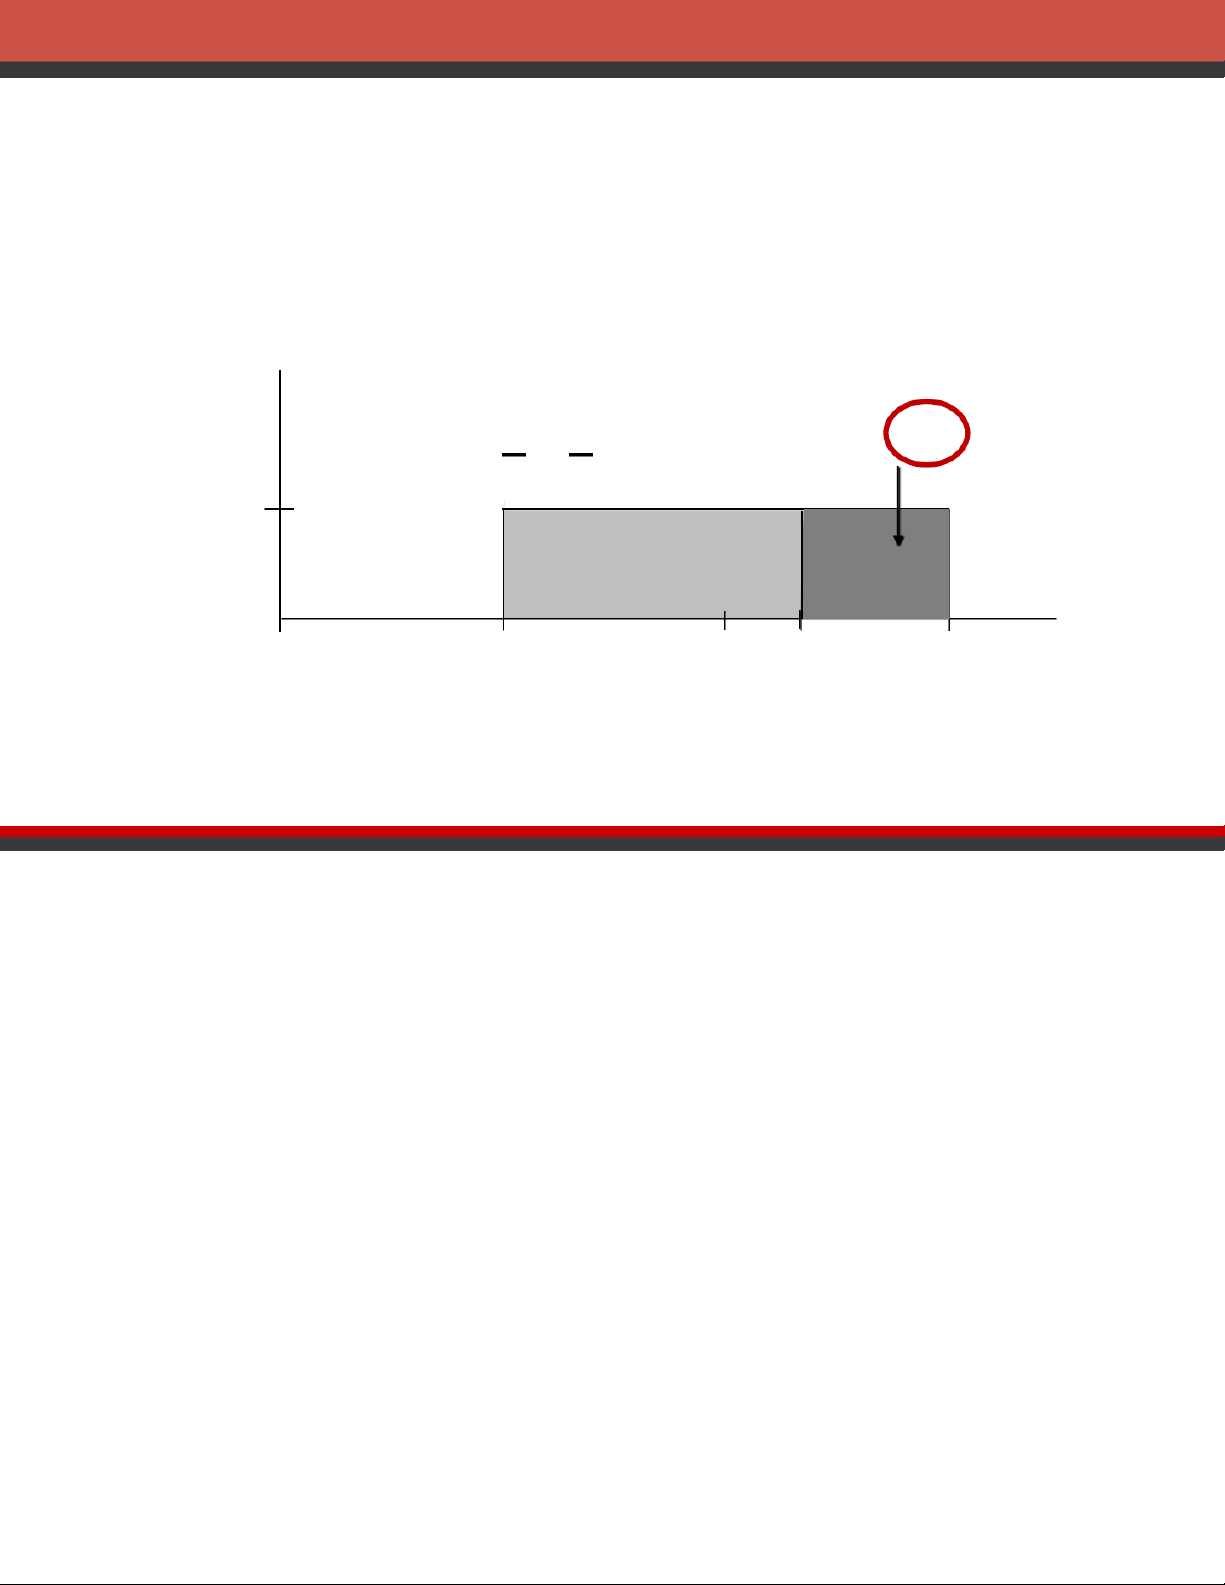
Statistics for Business and Economic iform Probability Distribution
What is the probability that a customer
will take between 12 and 15 ounces of salad? f( ) x
P(12 < x< 15) = 1/10(3) = .3 1/10 x 0 510 15 12 Salad Weight (oz.)
age Learning. May not be scanned, copied or duplicated, or posted to a publicly accessible website, in whole or in part, except for use as permitted in a license distributed with a certain product or service or
a password-protected website or school-approved learning management system for classroom use.
Statistics for Business and Economic ea as a Measure of Probability
e area under the graph of f( ) and pr x obability are identical.
is is valid for all continuous random variables.
e probability that xtakes on a value between some lower value x1and some
higher value x2can be found by computing the area under the graph of f(x)
ver the interval from x1to x2.
age Learning. May not be scanned, copied or duplicated, or posted to a publicly accessible website, in whole or in part, except for use as permitted in a license distributed with a certain product or service or
a password-protected website or school-approved learning management system for classroom use.
Statistics for Business and Economic rmal Probability Distribution
e normal probability distribution is the most important distribution for
describing a continuous random variable.
s widely used in statistical inference.
has been used in a wide variety of applications including: •Heights of people •Test scores •Amounts of rainfall •Scientific measurements
raham de Moivre, a French mathematician, published The Doctrine of Chances in 1733.
derived the normal distribution.
age Learning. May not be scanned, copied or duplicated, or posted to a publicly accessible website, in whole or in part, except for use as permitted in a license distributed with a certain product or service or
a password-protected website or school-approved learning management system for classroom use.
Statistics for Business and Economic rmal Probability Distribution
rmal Probability Density Function 𝑓 𝑥 = 1
𝜎2𝜋 𝑒−1/2((𝑥−𝜇)/𝜎)2 where: = mean = standard deviation = 3.14159 e= 2.71828
age Learning. May not be scanned, copied or duplicated, or posted to a publicly accessible website, in whole or in part, except for use as permitted in a license distributed with a certain product or service or
a password-protected website or school-approved learning management system for classroom use.
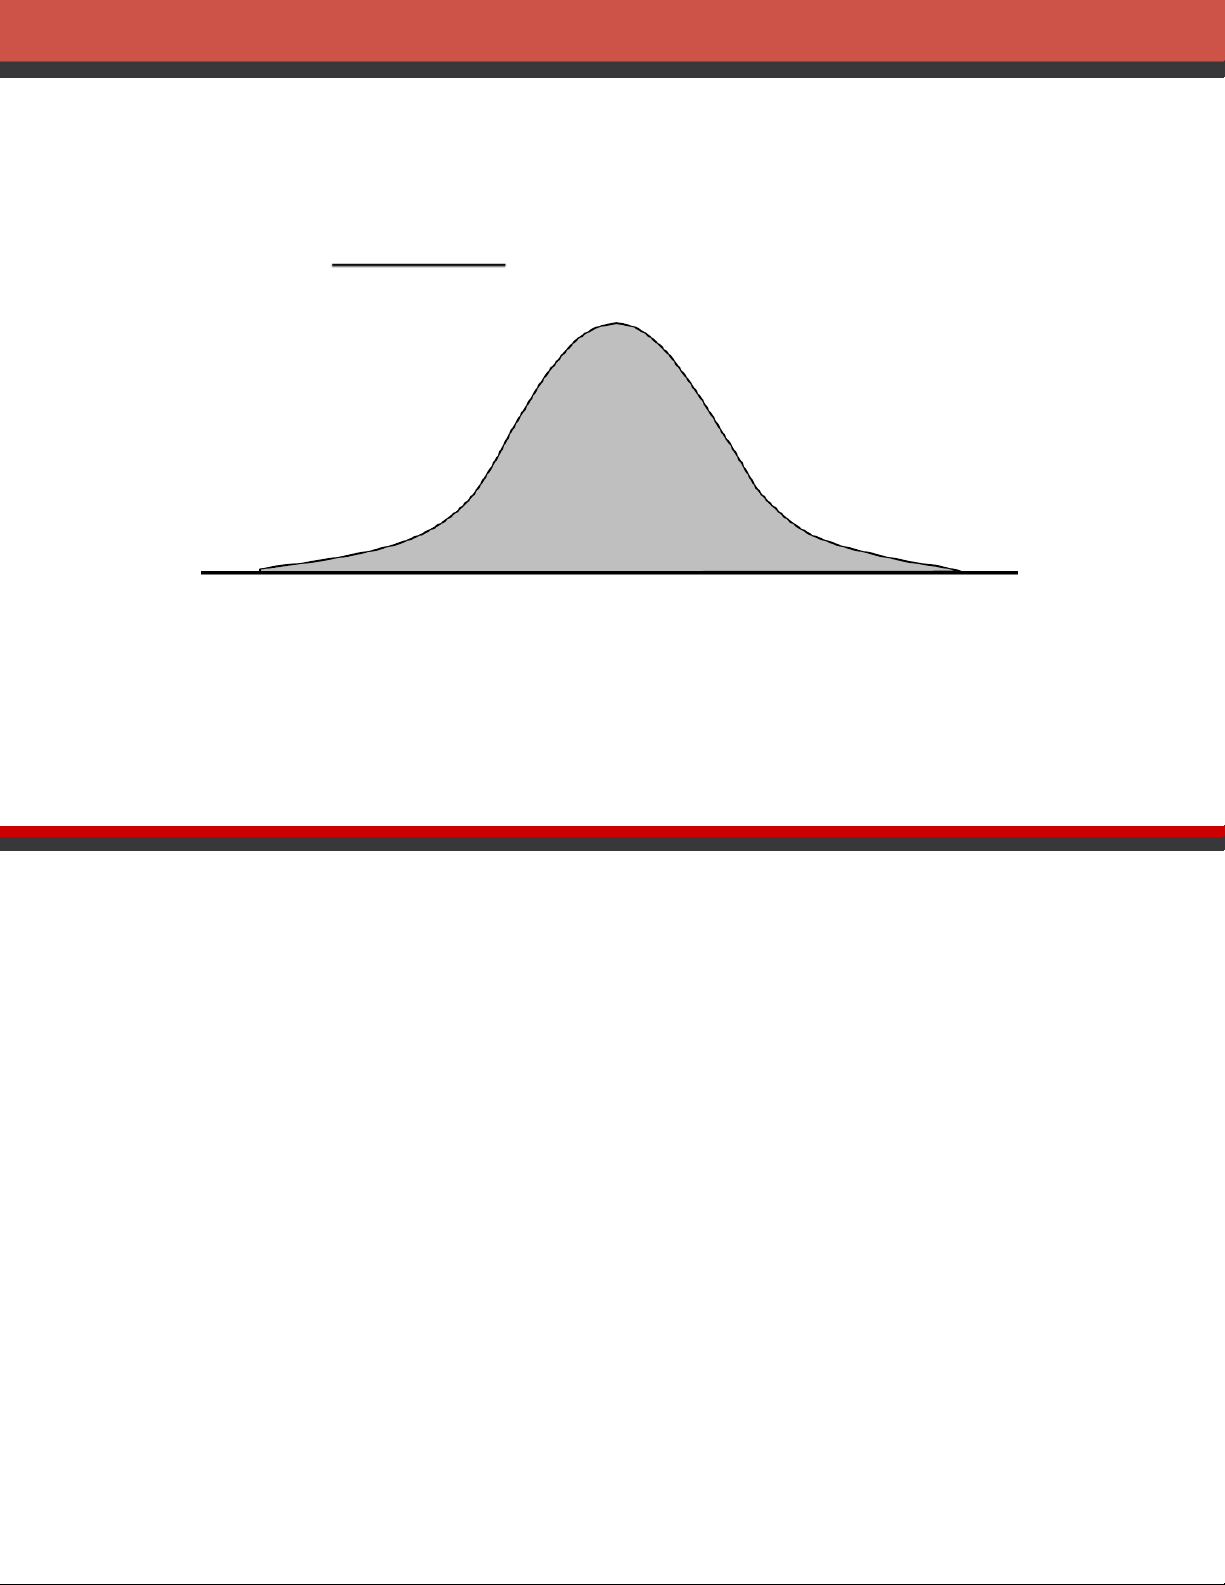
Statistics for Business and Economic rmal Probability Distribution aracteristics
The distribution is symmetric; its skewness measure is zero. x
age Learning. May not be scanned, copied or duplicated, or posted to a publicly accessible website, in whole or in part, except for use as permitted in a license distributed with a certain product or service or
a password-protected website or school-approved learning management system for classroom use.
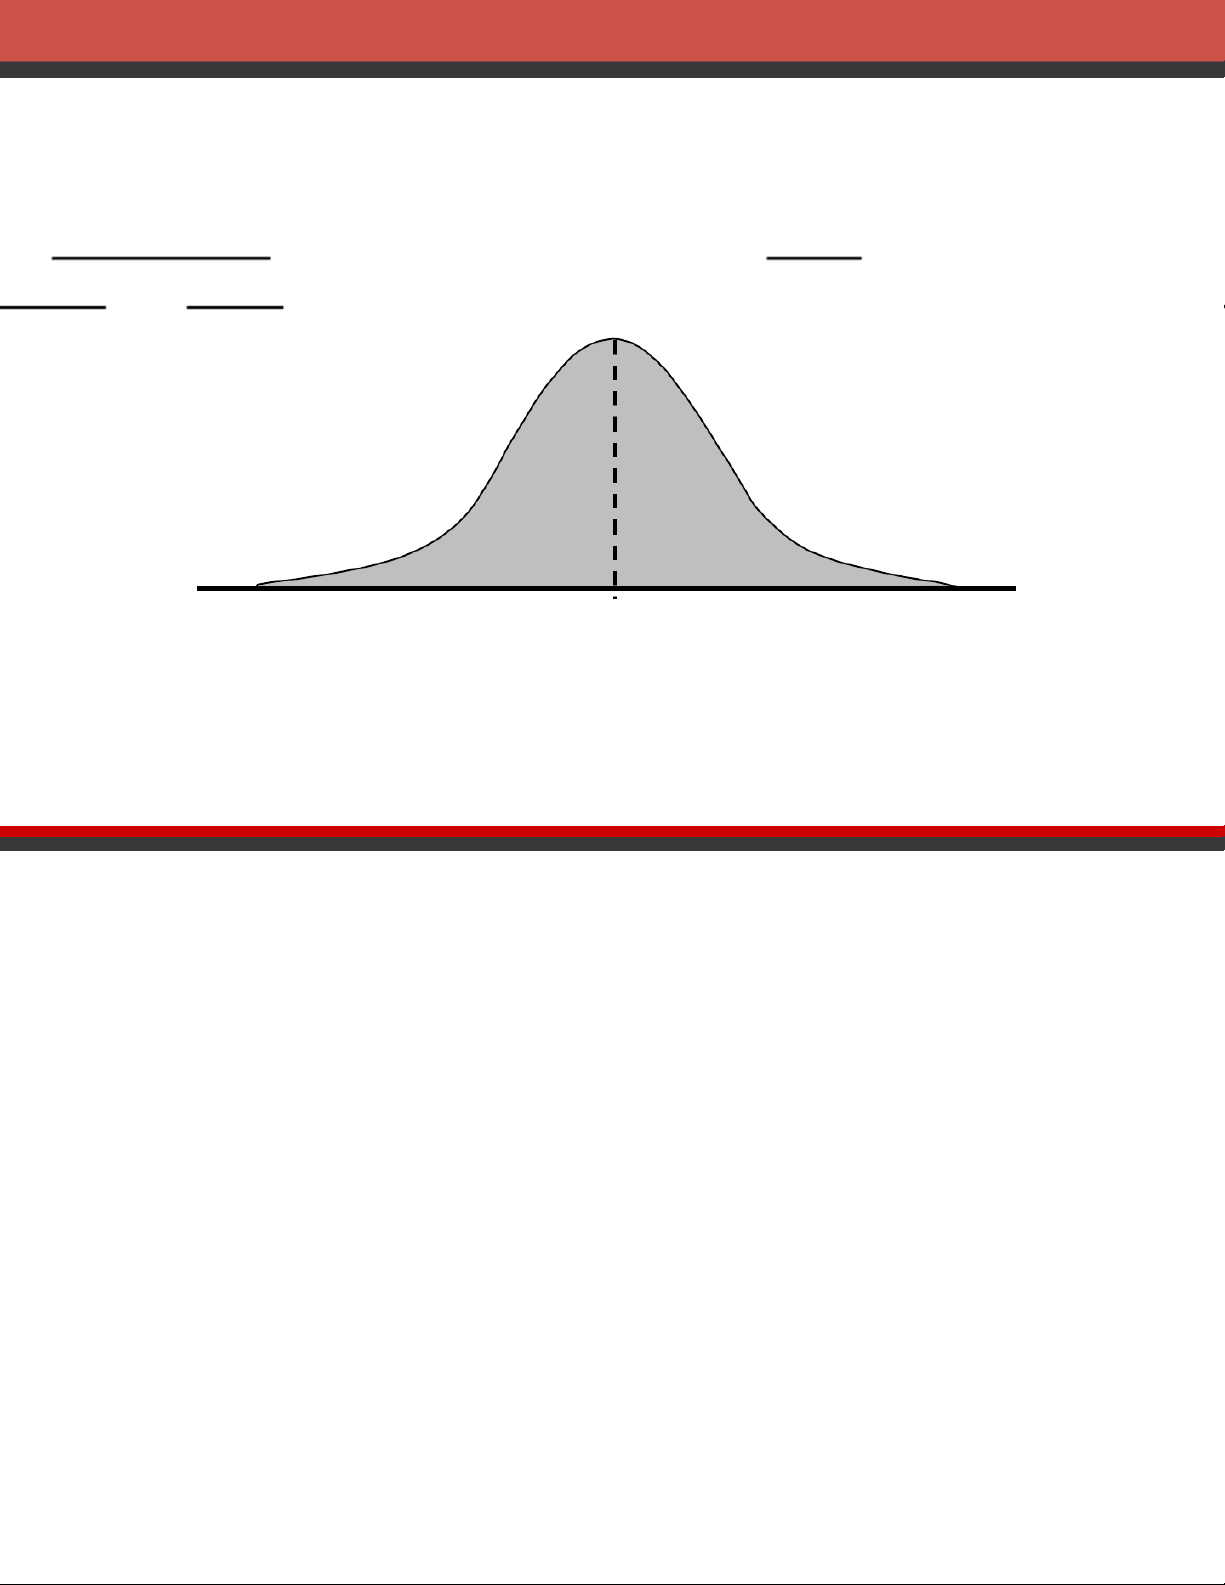
Statistics for Business and Economic rmal Probability Distribution aracteristics
The entire family of normal probability distributions is defined by its mean and its standard deviation . Standard Deviation x Mean
age Learning. May not be scanned, copied or duplicated, or posted to a publicly accessible website, in whole or in part, except for use as permitted in a license distributed with a certain product or service or
a password-protected website or school-approved learning management system for classroom use.
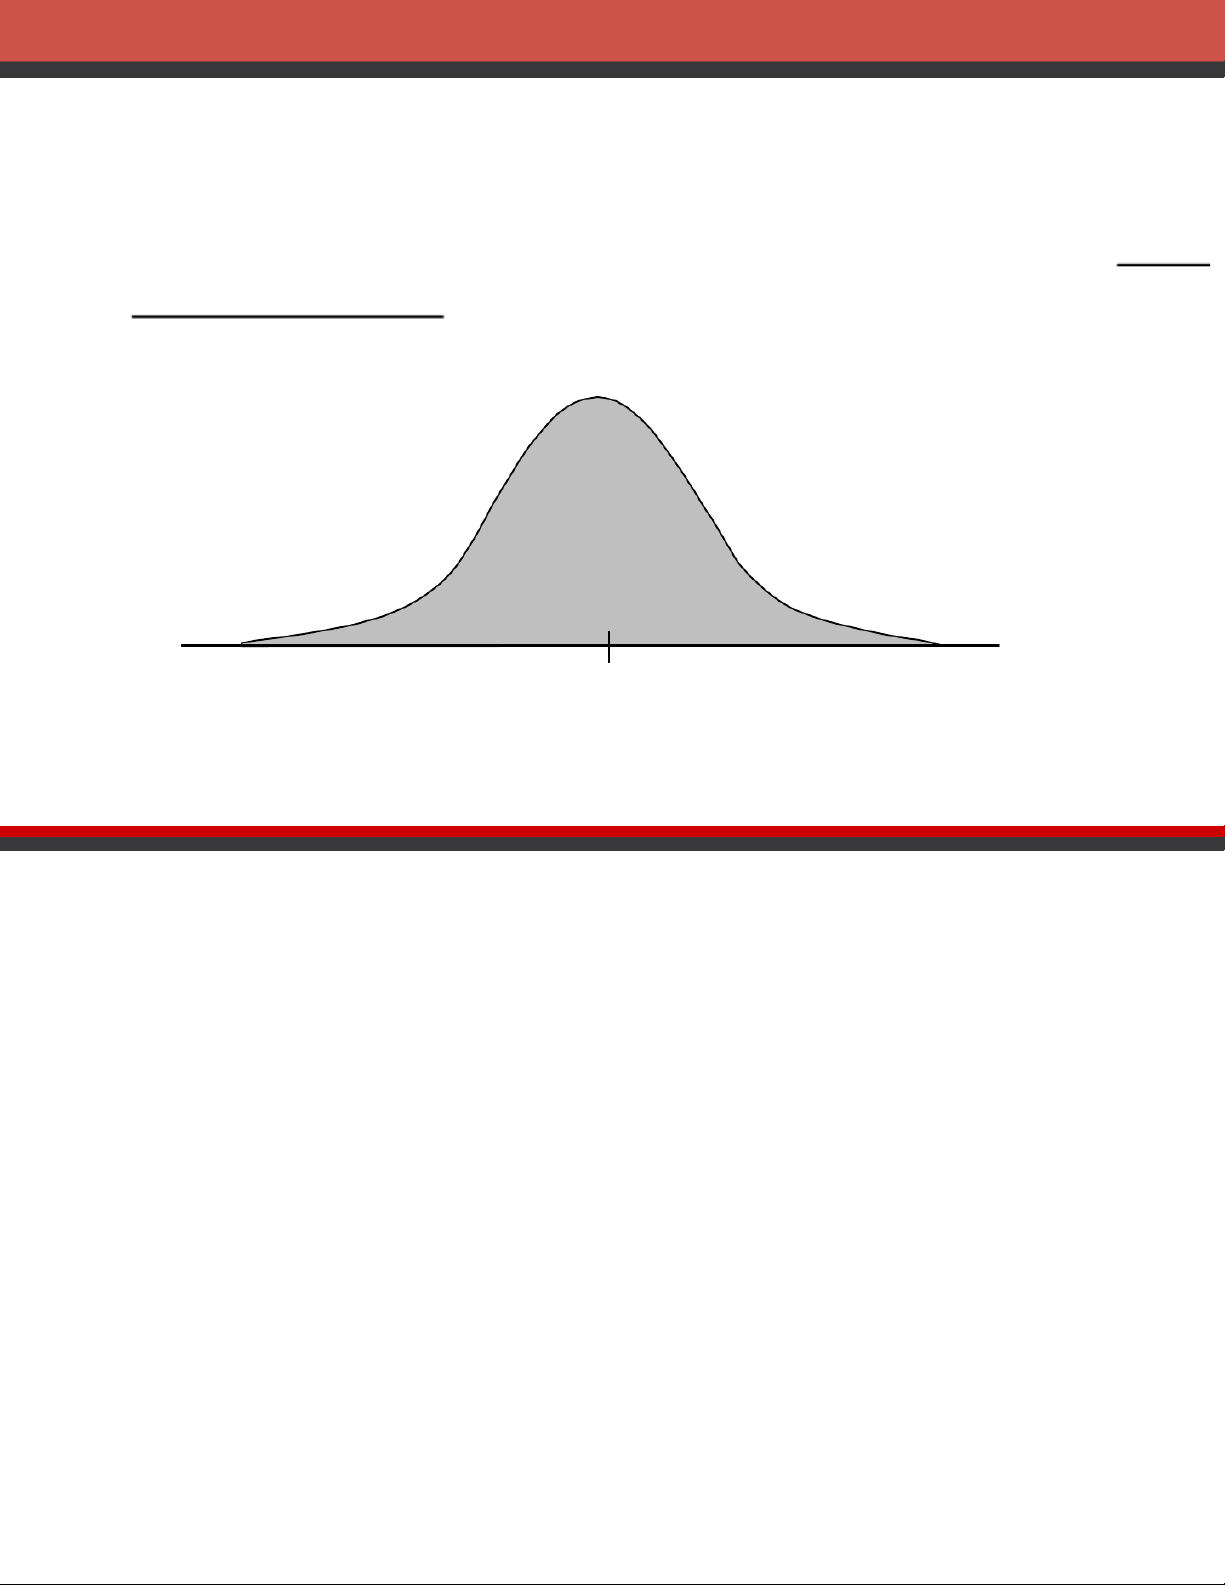
Statistics for Business and Economic rmal Probability Distribution aracteristics
The highest point on the normal curve is at the mean, which is also the median and mode. x
age Learning. May not be scanned, copied or duplicated, or posted to a publicly accessible website, in whole or in part, except for use as permitted in a license distributed with a certain product or service or
a password-protected website or school-approved learning management system for classroom use.
Statistics for Business and Economic rmal Probability Distribution aracteristics
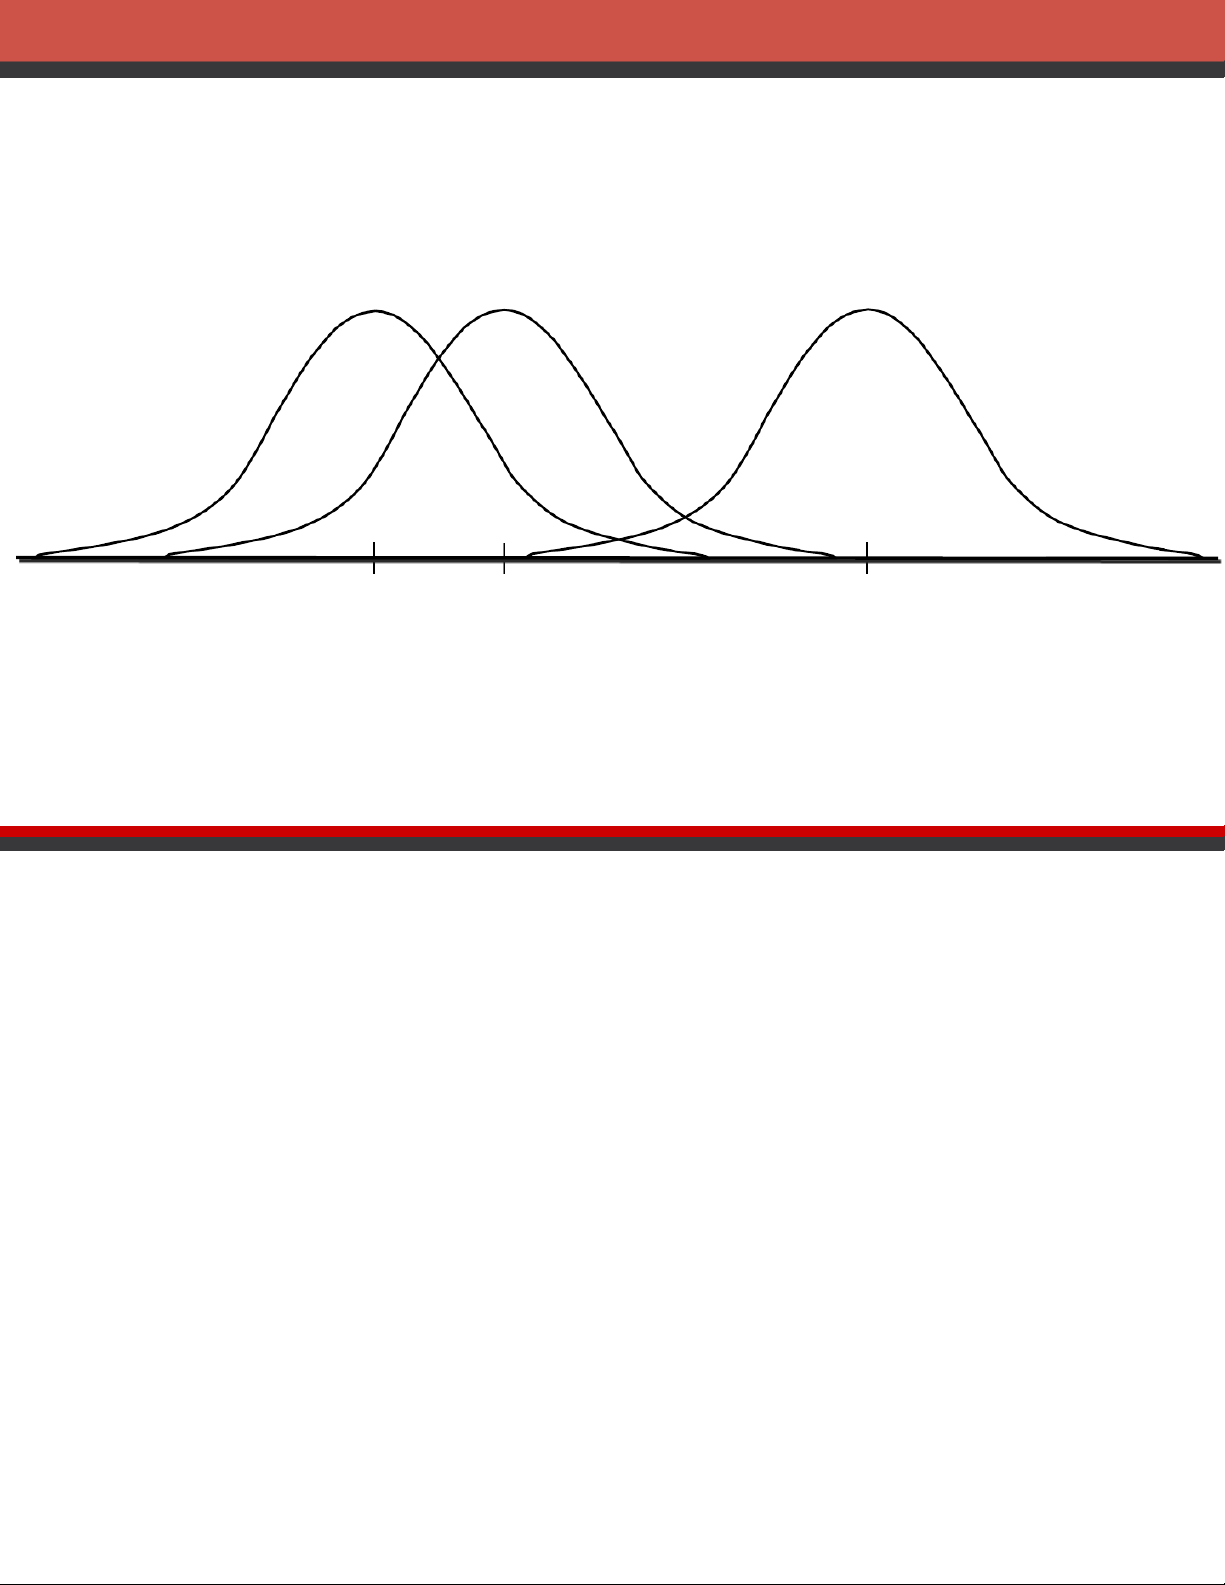
The mean can be any numerical value: negative, zero, or positive. -10 025
age Learning. May not be scanned, copied or duplicated, or posted to a publicly accessible website, in whole or in part, except for use as permitted in a license distributed with a certain product or service or
a password-protected website or school-approved learning management system for classroom use.
Statistics for Business and Economic rmal Probability Distribution aracteristics
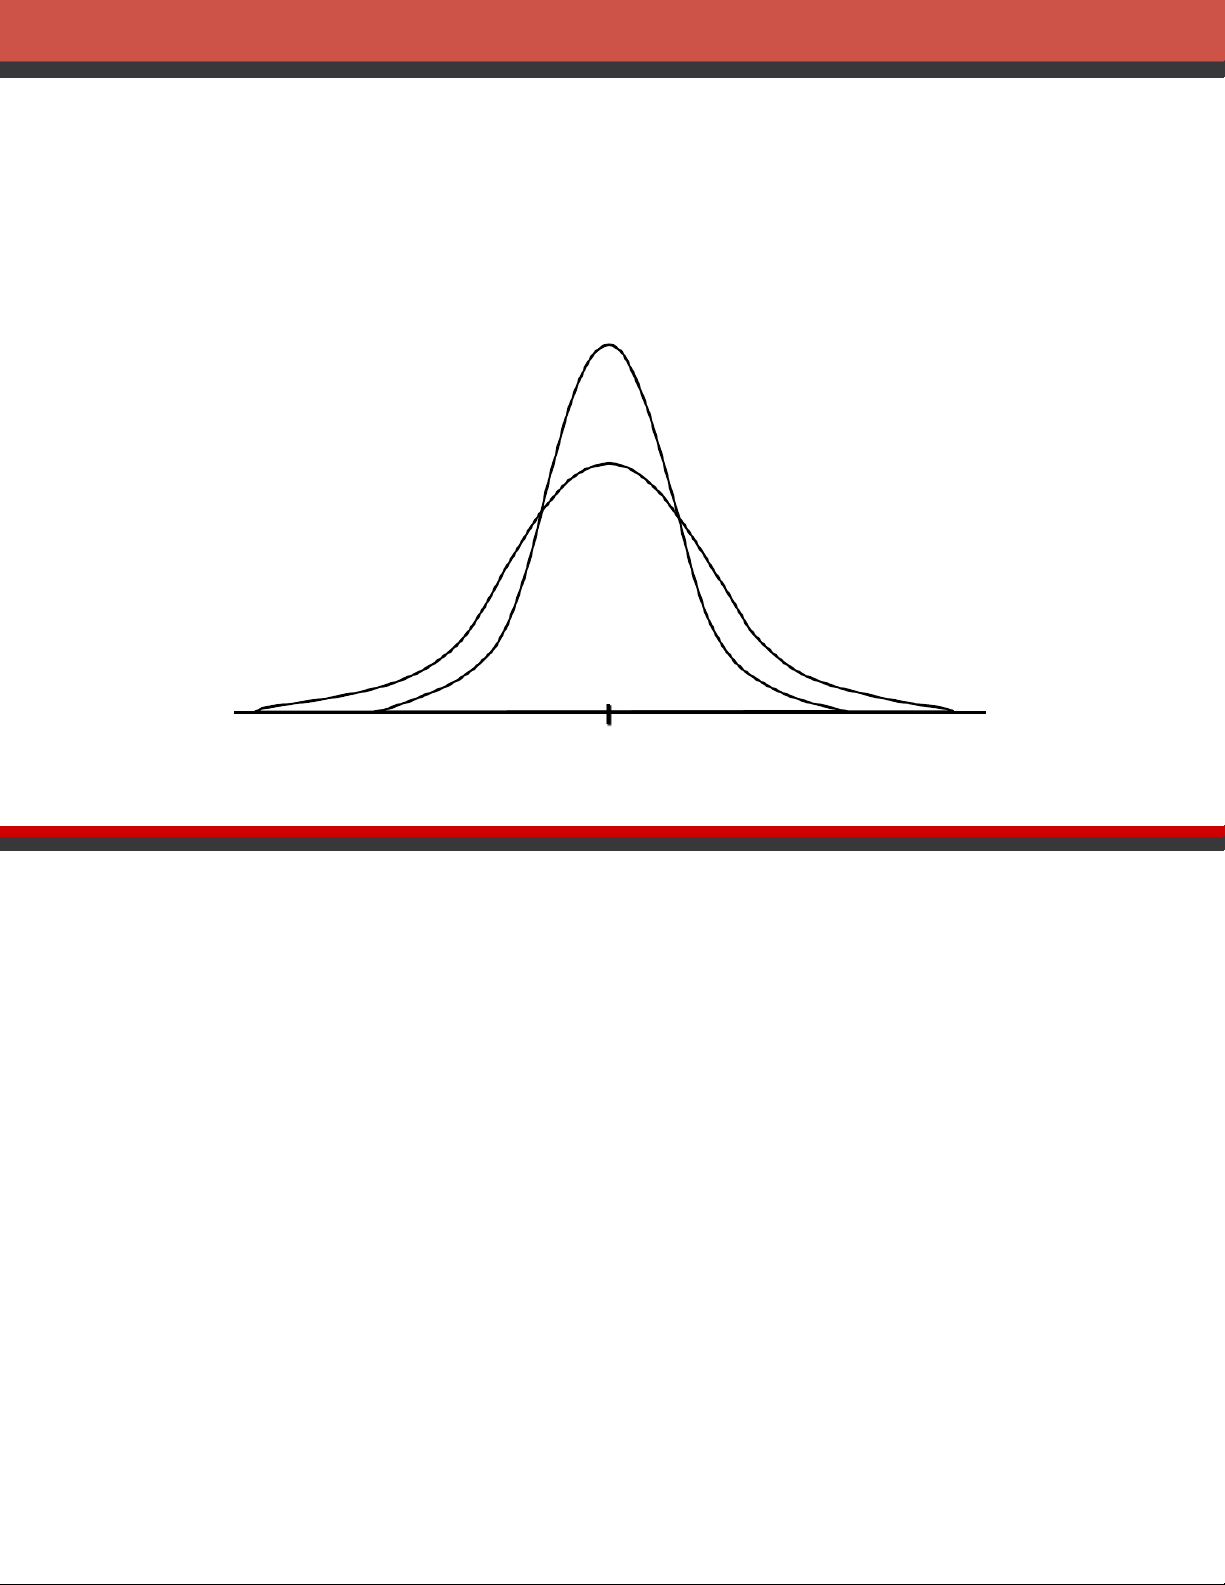
The standard deviation determines the width of the
urve: larger values result in wider, flatter curves. = 15 = 25 x
age Learning. May not be scanned, copied or duplicated, or posted to a publicly accessible website, in whole or in part, except for use as permitted in a license distributed with a certain product or service or
a password-protected website or school-approved learning management system for classroom use.
Statistics for Business and Economic rmal Probability Distribution aracteristics
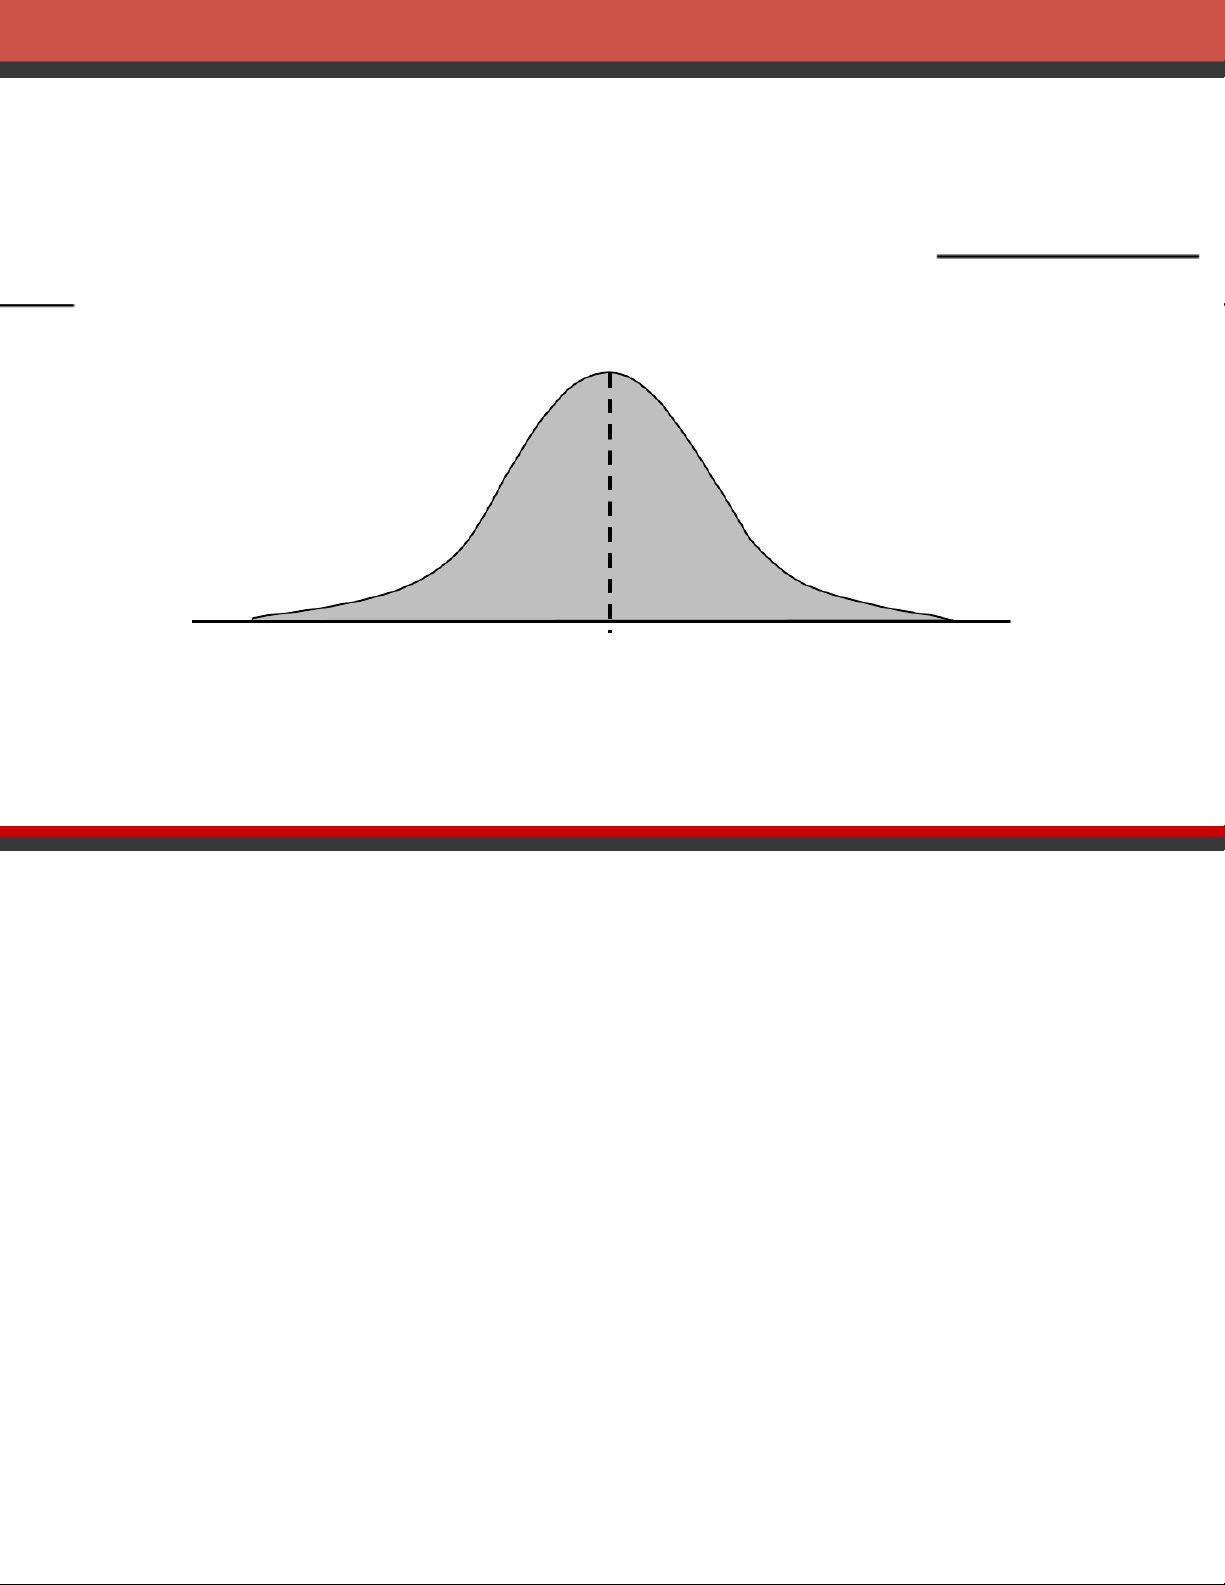
Probabilities for the normal random variable are given by areas under the
curve. The total area under the curve is 1 (.5 to the left of the mean and 5 to the right). .5 .5 x
age Learning. May not be scanned, copied or duplicated, or posted to a publicly accessible website, in whole or in part, except for use as permitted in a license distributed with a certain product or service or
a password-protected website or school-approved learning management system for classroom use.
Tài liệu liên quan:
-

Bảng giá trị phân phối thống kê poisson và student môn Xác suất thống kê| Trường Đại học Ngoại Thương
27 14 -

Bảng giá trị quyết định thống kê wilcoxon rank-sum test môn Xác suất thống kê| Trường Đại học Ngoại Thương
29 15 -

Bài 1 Định nghĩa cổ điển về xác suất môn Xác suất thống kê| Trường Đại học Ngoại Thương
26 13 -

Exercises for probability & statistics môn Xác suất thống kê| Trường Đại học Ngoại Thương
26 13 -

Đề thi cuối kỳ lý thuyết môn Xác suất thống kê| Trường Đại học Ngoại Thương
27 14