Statistics for business and economics - chapter 3b notes môn Xác suất thống kê| Trường Đại học Ngoại Thương
Seventy efficiency apartments were randomly sampled in acollege town. The monthly rent prices for the apartments are listed below in ascending order. Tài liệu giúp bạn tham khảo, ôn tập và đạt kết quả cao. Mời đọc đón xem!
Môn: Xác suất thống kê (FTU) 355 tài liệu
Trường: Trường Đại học Ngoại Thương 1.1 K tài liệu
Tác giả:


Preview text:
tistics for sinSleide s ss b yand Economics (13e) John Loucks
on, Sweeney, Williams, Camm, Cochran St. Edward’s 7 Cengage Learning University by John Loucks wards University
age Learning. May not be scanned, copied or duplicated, or posted to a publicly accessible website, in whole or in part, except for use as permitted in a license distributed with a certain product or service or
a password-protected website or school-approved learning management system for classroom use.
Statistics for Business and Economic apter 3, Part B
scriptive Statistics: Numerical Measures
Measures of Distribution Shape, Relative Location, and Detecting Outliers
ve-Number Summaries and Box Plots
Measures of Association Between Two Variables
ata Dashboards: Adding Numerical Measures to Improve Effectiveness
age Learning. May not be scanned, copied or duplicated, or posted to a publicly accessible website, in whole or in part, except for use as permitted in a license distributed with a certain product or service or
a password-protected website or school-approved learning management system for classroom use.
Statistics for Business and Economic easures of Distribution Shape,
lative Location, and Detecting Outliers istribution Shape Scores hebyshev’s Theorem mpirical Rule etecting Outliers
age Learning. May not be scanned, copied or duplicated, or posted to a publicly accessible website, in whole or in part, except for use as permitted in a license distributed with a certain product or service or
a password-protected website or school-approved learning management system for classroom use.
Statistics for Business and Economic stribution Shape: Skewness
n important numerical measure of the shape of a distribution is called skewness.
he formula for the skewness of sample data is Skewness = 3 (𝑛−1) 𝑛 ( −2) σ𝑥𝑖−ҧ 𝑥 𝑠
kewness can be easily computed using statistical software.
age Learning. May not be scanned, copied or duplicated, or posted to a publicly accessible website, in whole or in part, except for use as permitted in a license distributed with a certain product or service or
a password-protected website or school-approved learning management system for classroom use.
Statistics for Business and Economic stribution Shape: Skewness ymmetric (not skewed) •Skewness is zero. •Mean and median are equal. Skewness = 0 .35 .30 .25 .20 .15 .10 Relat .05 ive Frequency 0
age Learning. May not be scanned, copied or duplicated, or posted to a publicly accessible website, in whole or in part, except for use as permitted in a license distributed with a certain product or service or
a password-protected website or school-approved learning management system for classroom use.
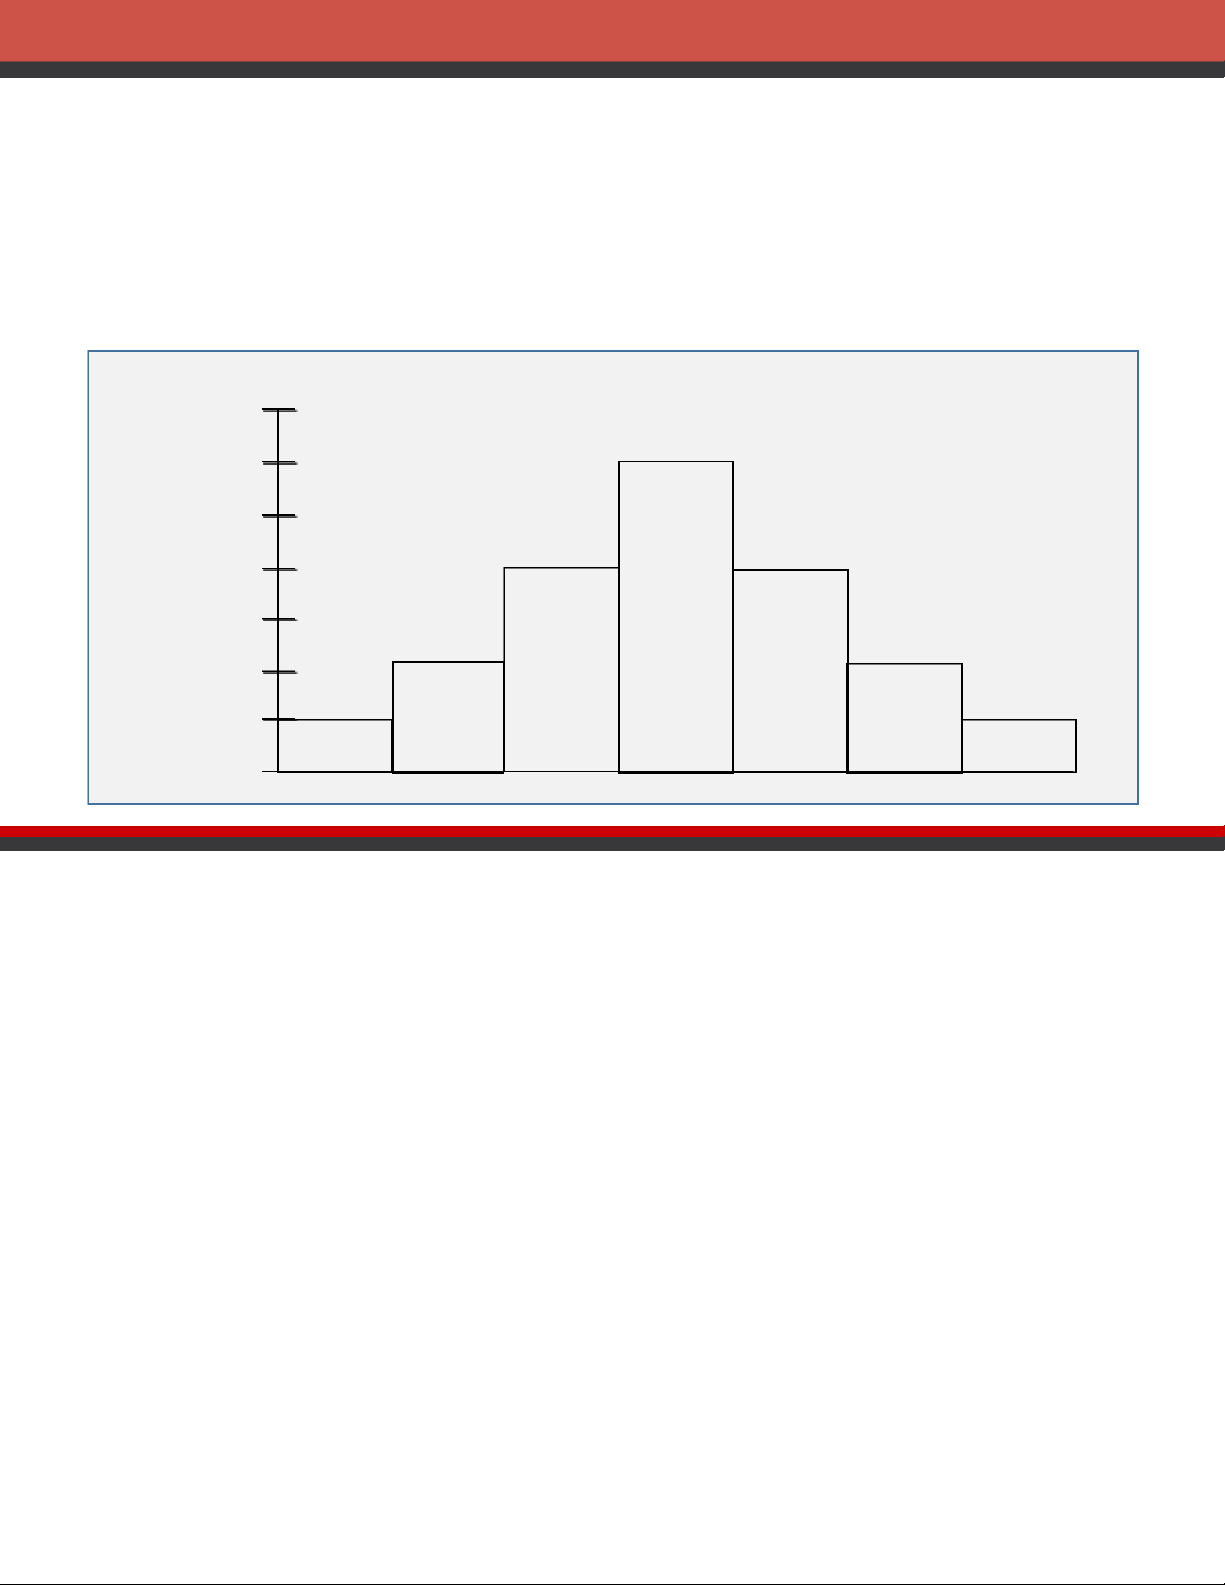
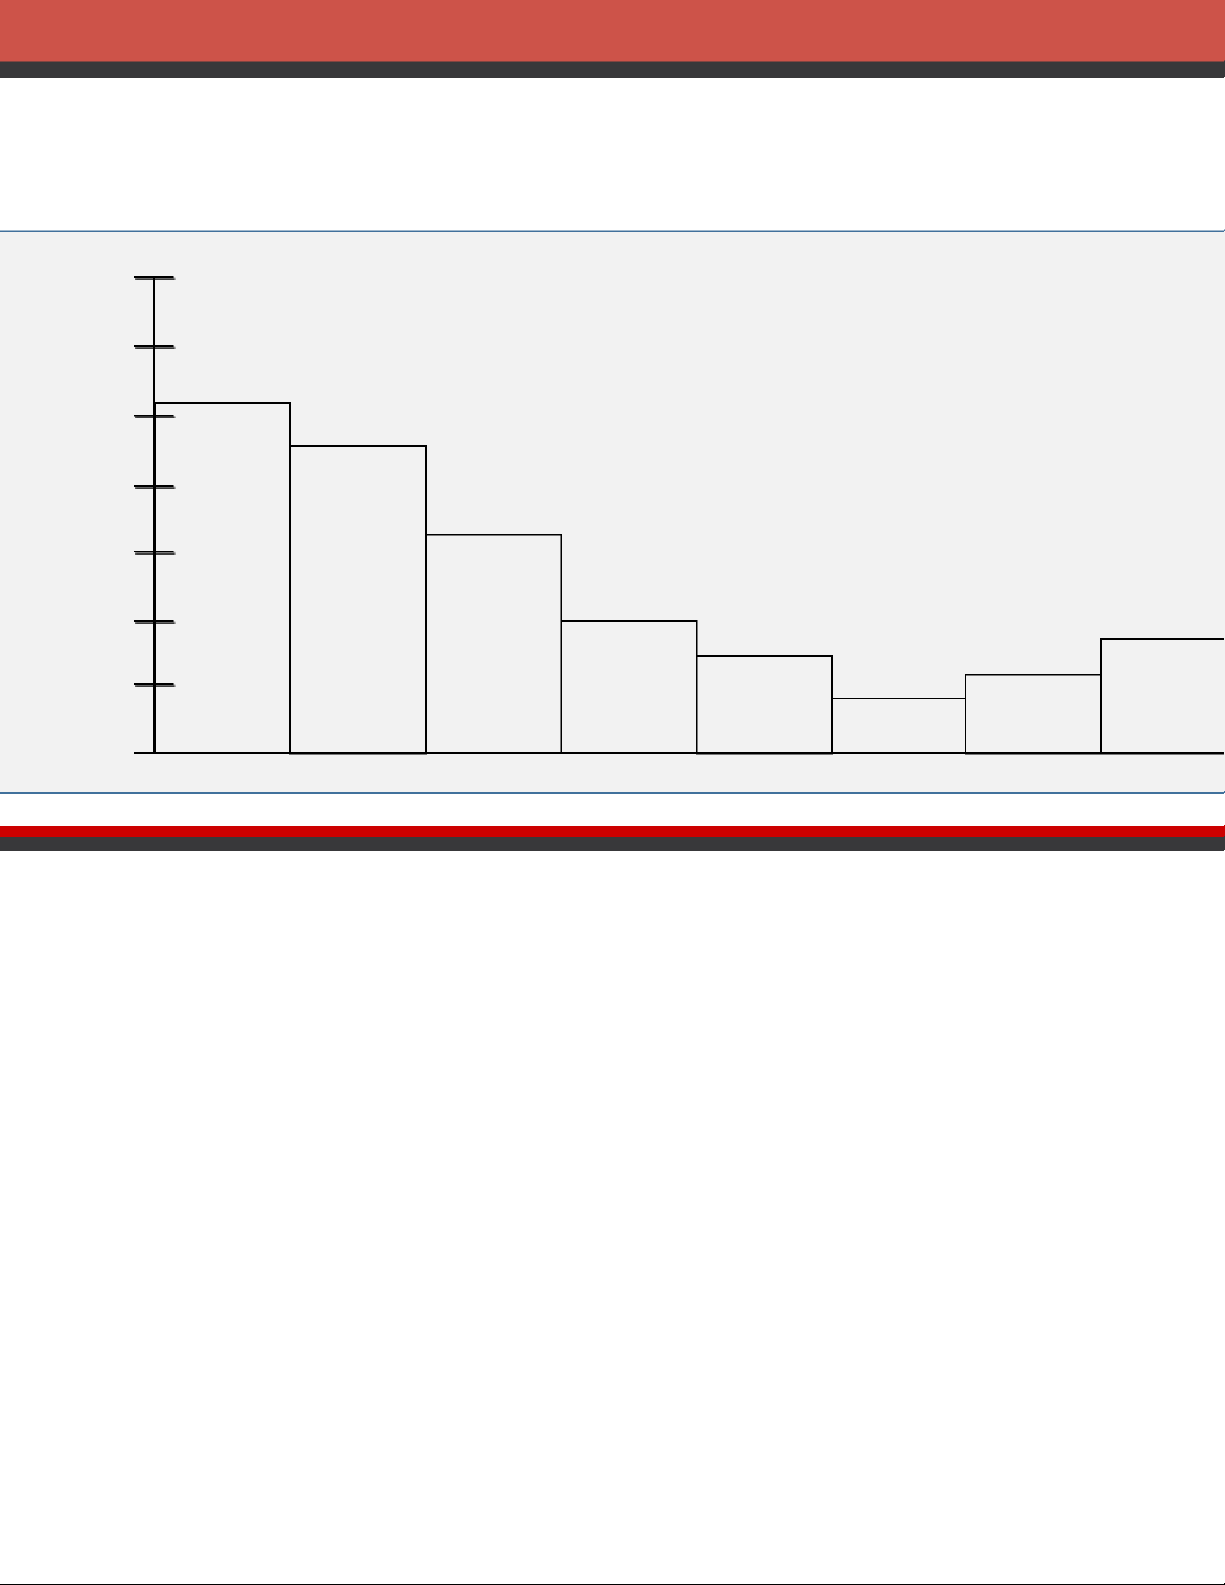
Statistics for Business and Economic stribution Shape: Skewness Moderately Skewed Left •Skewness is negative.
•Mean will usually be less than the median. .35 Skewness = - .31 .30 .25 .20 .15 .10 Relat .05 ive Frequency 0
age Learning. May not be scanned, copied or duplicated, or posted to a publicly accessible website, in whole or in part, except for use as permitted in a license distributed with a certain product or service or
a password-protected website or school-approved learning management system for classroom use.
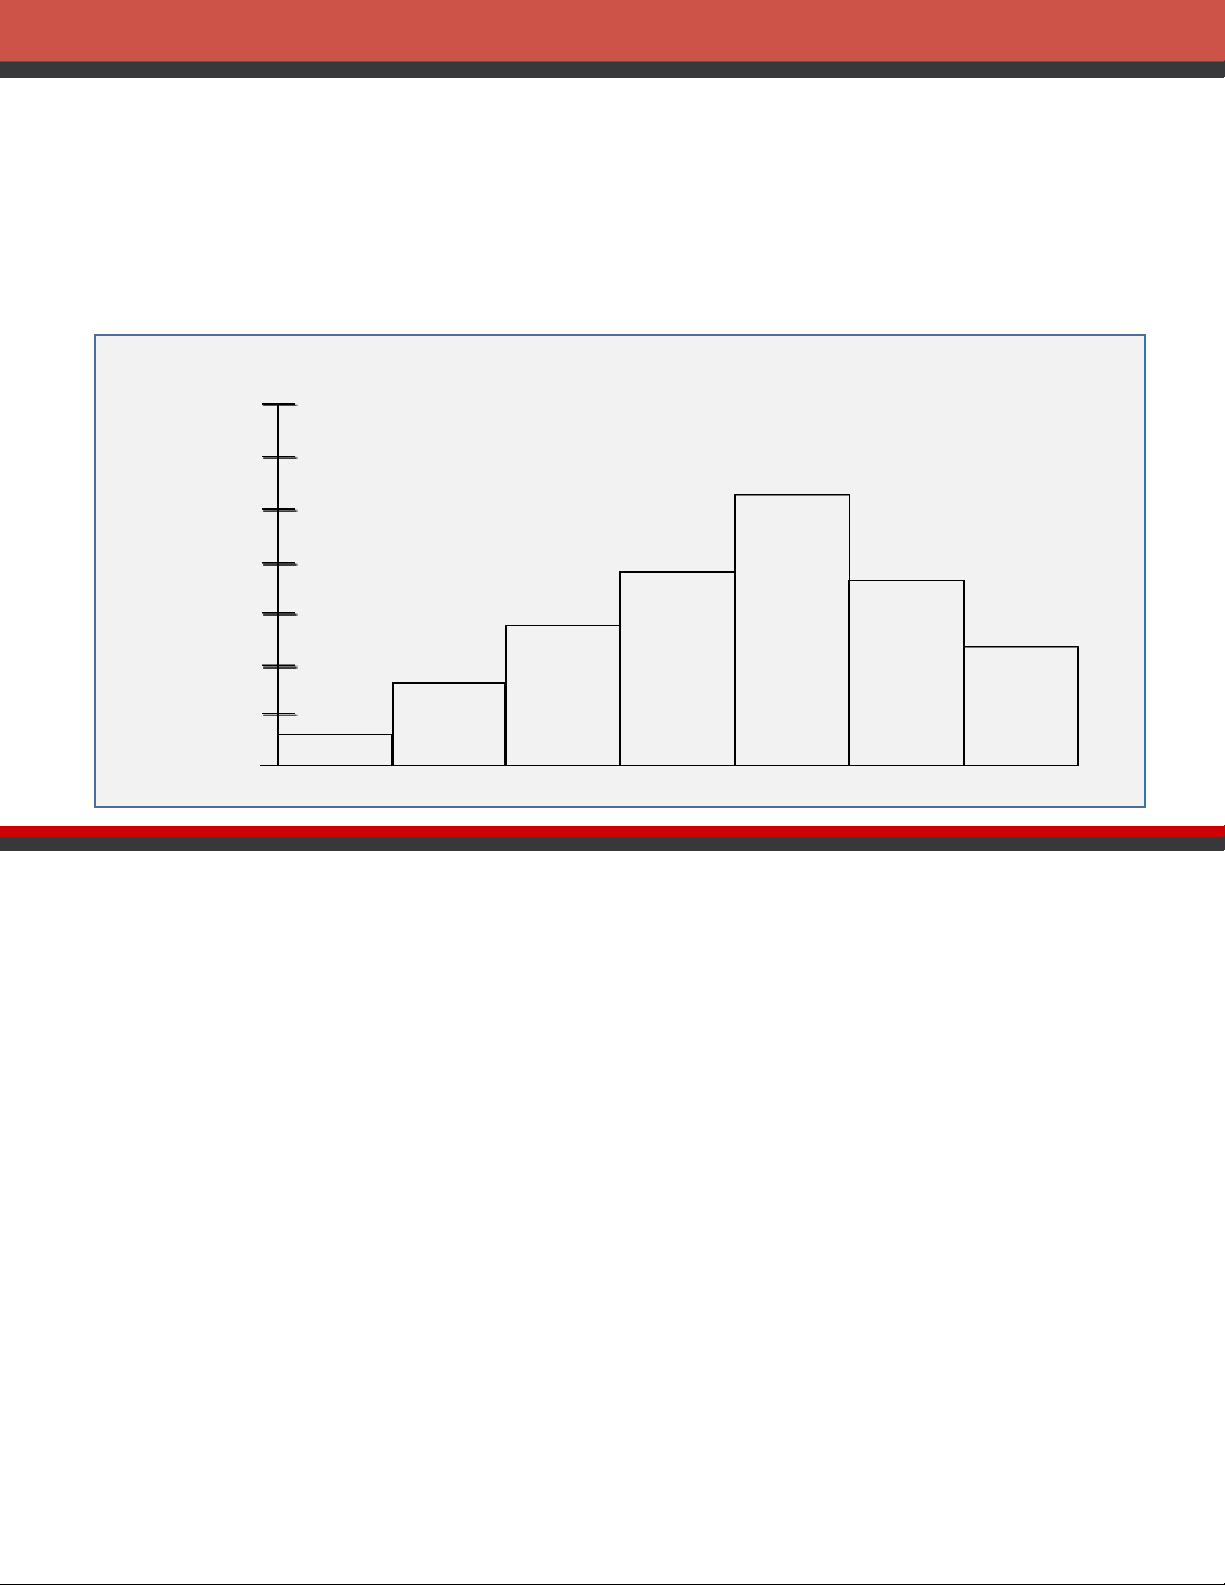
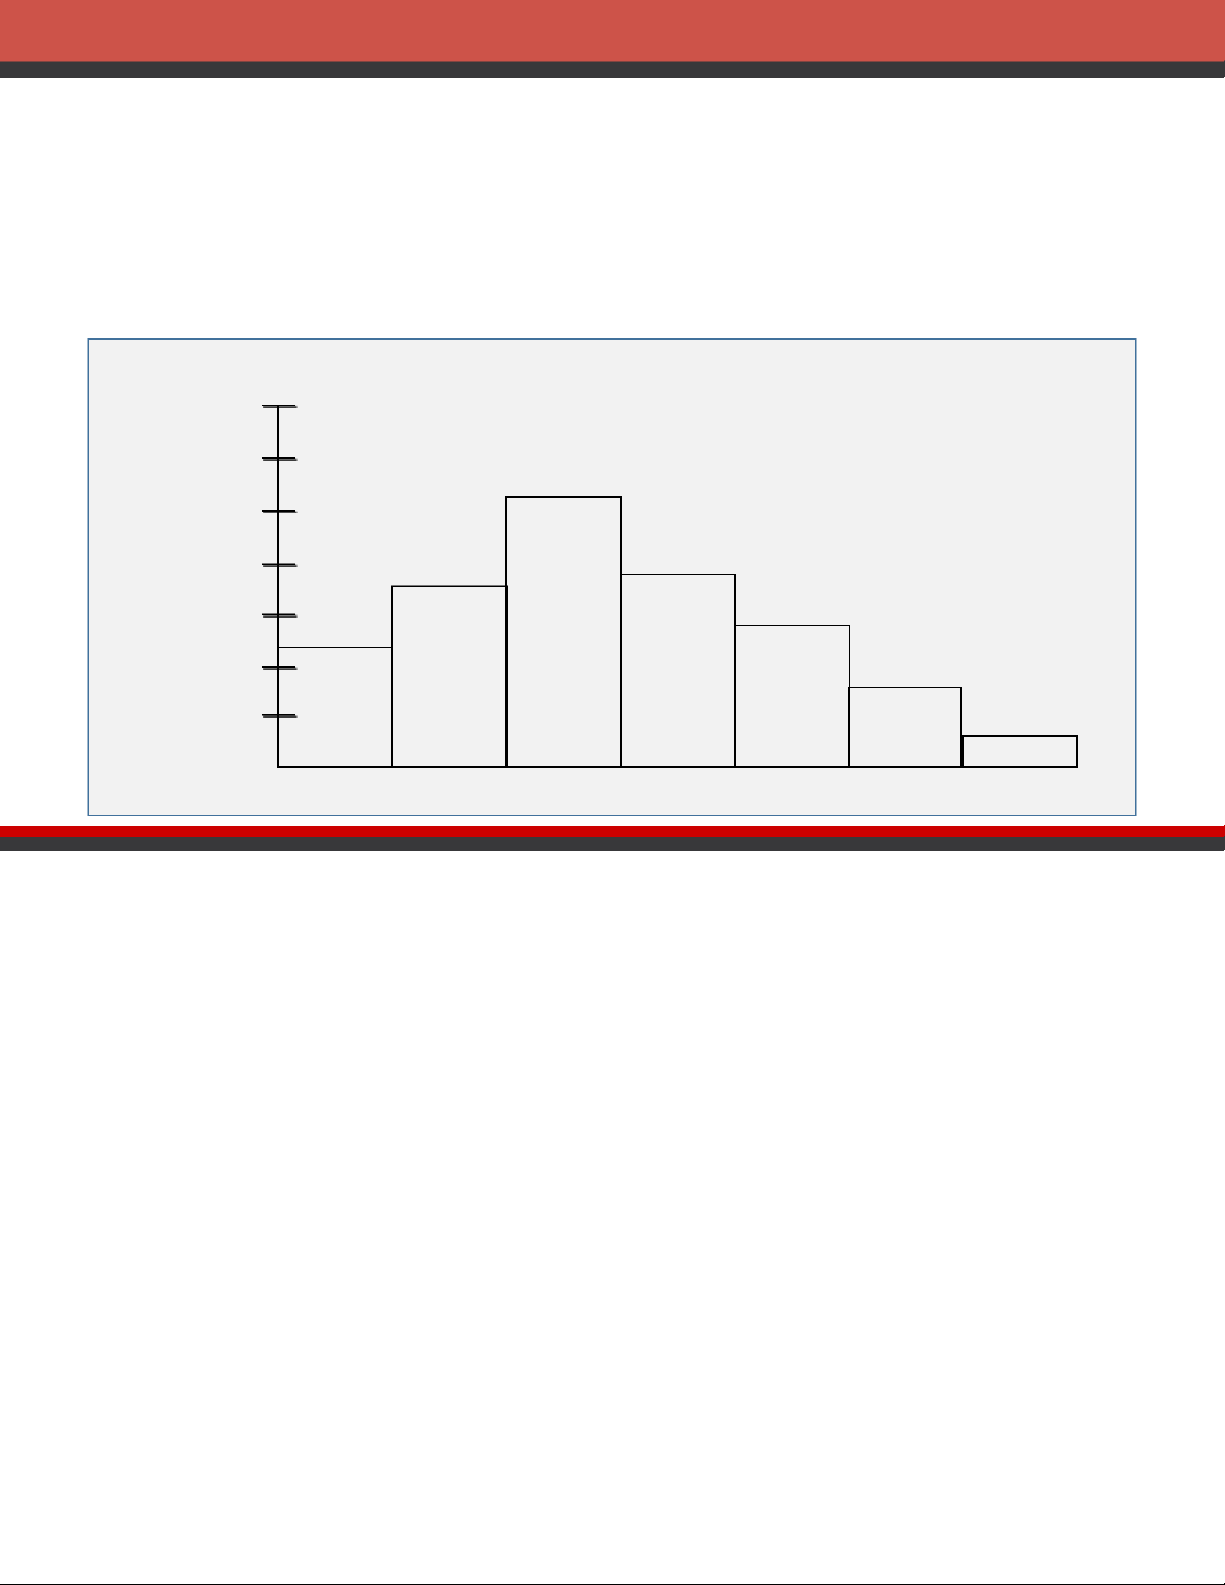
Statistics for Business and Economic stribution Shape: Skewness Moderately Skewed Right •Skewness is positive.
•Mean will usually be more than the median. .35 Skewness = .31 .30 .25 .20 .15 .10 Re.lat 05 ive Frequency 0
age Learning. May not be scanned, copied or duplicated, or posted to a publicly accessible website, in whole or in part, except for use as permitted in a license distributed with a certain product or service or
a password-protected website or school-approved learning management system for classroom use.
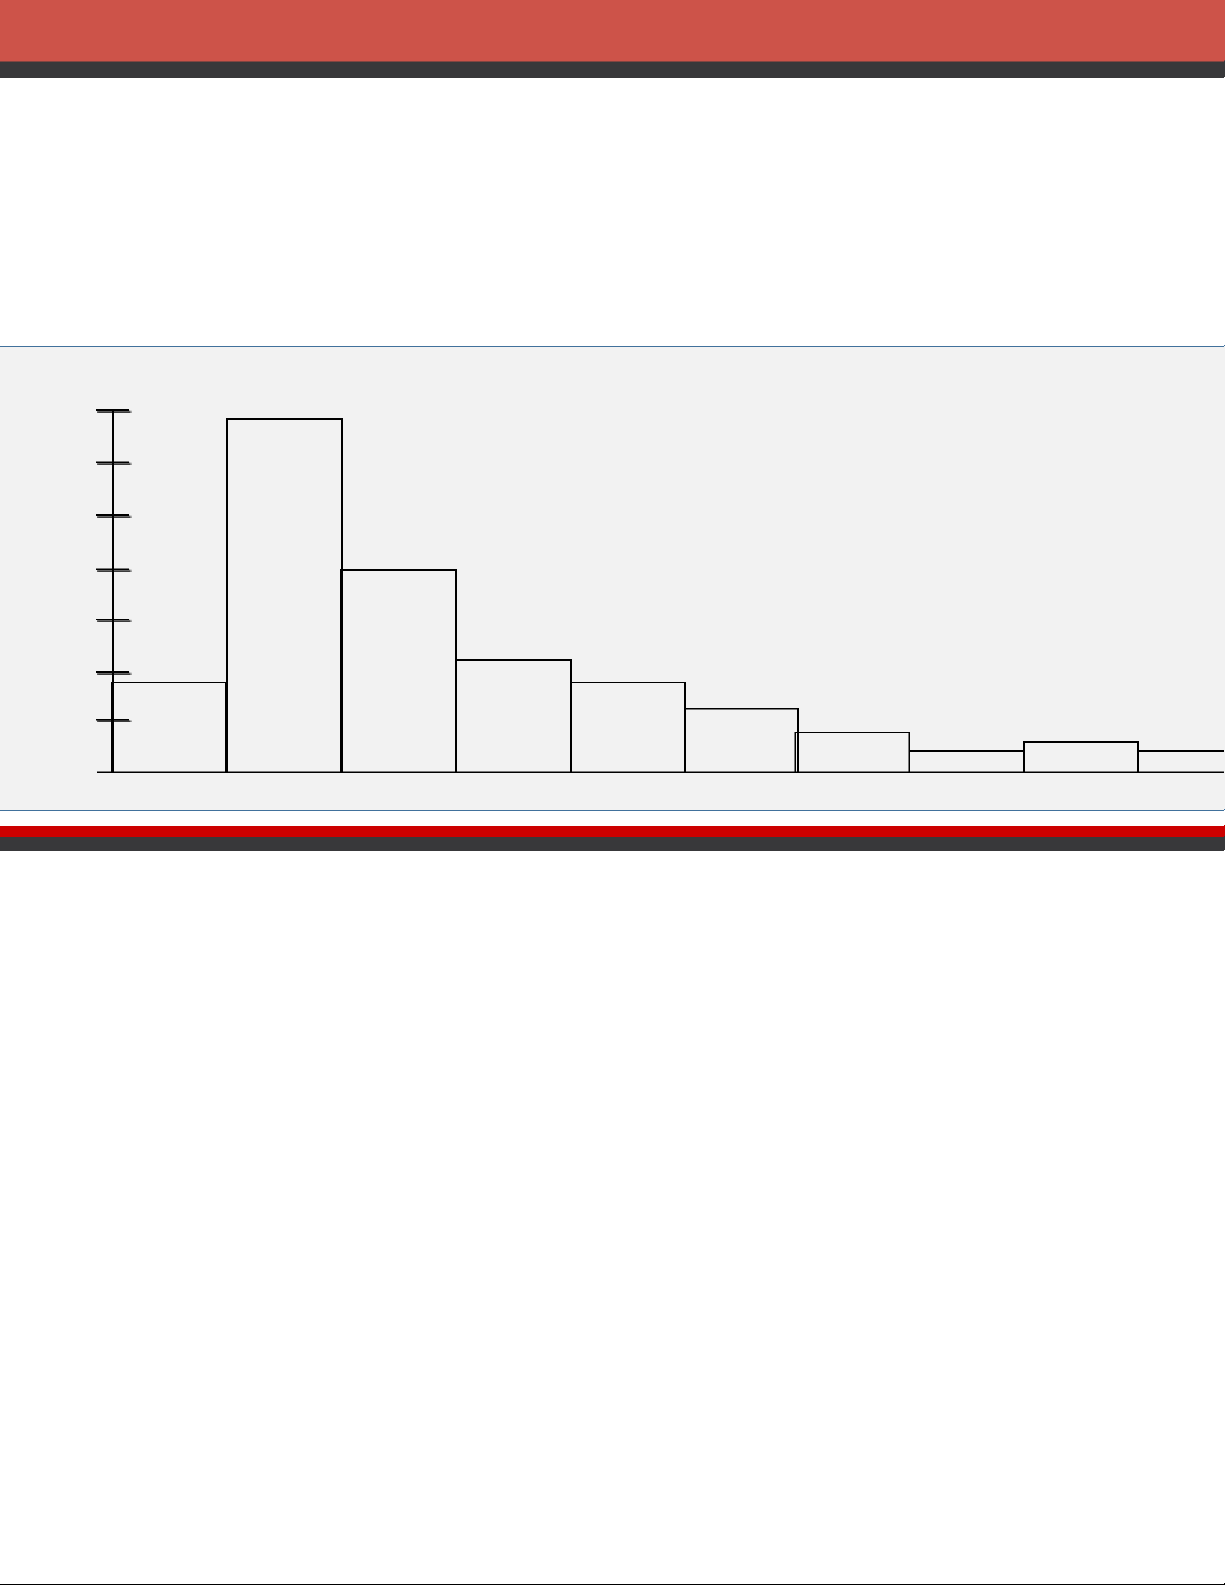
Statistics for Business and Economic stribution Shape: Skewness Highly Skewed Right
•Skewness is positive (often above 1.0).
•Mean will usually be more than the median. .35 Skewness = 1.25 .30 .25 .20 .15 .10 Relat .05ive Frequency 0
age Learning. May not be scanned, copied or duplicated, or posted to a publicly accessible website, in whole or in part, except for use as permitted in a license distributed with a certain product or service or
a password-protected website or school-approved learning management system for classroom use.
Statistics for Business and Economic stribution Shape: Skewness xample: Apartment Rents
Seventy efficiency apartments were randomly sampled in a college town. Th
monthly rent prices for the apartments are listed below in ascending order. 525530 530 535 535 535 535 535 540 540
540 540 540 545545 545 545 545 550 550
550 550 550 550 550 560 560 560 565 565
565 570 570 572 575 575 575 580 580580
580 585 590590 590 600 600 600 600 610
610 615 625 625 625 635 649 650 670670 675 675 680690 700 700 700 700 715 715
age Learning. May not be scanned, copied or duplicated, or posted to a publicly accessible website, in whole or in part, except for use as permitted in a license distributed with a certain product or service or
a password-protected website or school-approved learning management system for classroom use.
Statistics for Business and Economic stribution Shape: Skewness xample: Apartment Rents .35 Skewness = .92 .30 .25 .20 .15 .10 Relative Frequency .05 0
age Learning. May not be scanned, copied or duplicated, or posted to a publicly accessible website, in whole or in part, except for use as permitted in a license distributed with a certain product or service or
a password-protected website or school-approved learning management system for classroom use.
Statistics for Business and Economic Scores
he z-score is often called the standardized value.
denotes the number of standard deviations a data value xiis from the mean. 𝑧𝑖=𝑥𝑖−ҧ𝑥 𝑠
age Learning. May not be scanned, copied or duplicated, or posted to a publicly accessible website, in whole or in part, except for use as permitted in a license distributed with a certain product or service or
a password-protected website or school-approved learning management system for classroom use.
Statistics for Business and Economic Scores
n observation’s z-score is a measure of the relative location of the observatio in a data set.
data value less than the sample mean will have a z-score less than zero.
data value greater than the sample mean will have a z-score greater than zero.
data value equal to the sample mean will have a z-score of zero.
age Learning. May not be scanned, copied or duplicated, or posted to a publicly accessible website, in whole or in part, except for use as permitted in a license distributed with a certain product or service or
a password-protected website or school-approved learning management system for classroom use.
Statistics for Business and Economic Scores xample: Apartment Rents
•z-Score of Smallest Value (525) 𝑧𝑖= 𝑥𝑖−ҧ𝑥 𝑠=525−590.80 54.74 = -1.20
Standardized Values for Apartment Rents 20 -1.11 -1.11 -1.02 -1.02 -1.02 -1.02 -1.02 -0.93 -0.93 93 -0.93 -0.93 -0.84 -0.84 -0.84 -0.84 -0.84 -0.75 -0.75 75 -0.75 -0.75 -0.75 -0.75 -0.56 -0.56 -0.56 -0.47 -0.47 47 -0.38 -0.38 -0.34 -0.29 -0.29 -0.29 -0.20 -0.20 -0.20 20 -0.11 -0.01 -0.01 -0.01 0.17 0.17 0.17 0.17 0.35 35 0.44 0.62 0.62 0.62 0.81 1.06 1.08 1.45 1.45 54 1.54 1.63 1.81 1.99 1.99 1.99 1.99 2.27 2.27
age Learning. May not be scanned, copied or duplicated, or posted to a publicly accessible website, in whole or in part, except for use as permitted in a license distributed with a certain product or service or
a password-protected website or school-approved learning management system for classroom use.
Statistics for Business and Economic ebyshev’s Theorem
t least (1 - 1/z2) of the data values must be within zstandard deviations of
the mean, where z is any value greater than 1.
hebyshev’s theorem requires z> 1; but zneed not be an integer.
age Learning. May not be scanned, copied or duplicated, or posted to a publicly accessible website, in whole or in part, except for use as permitted in a license distributed with a certain product or service or
a password-protected website or school-approved learning management system for classroom use.
Statistics for Business and Economic ebyshev’s Theorem
t least 75% of the data values must be within z= 2 standard deviations of the mean.
t least 89% of the data values must be within z= 3 standard deviations of the mean.
t least 94% of the data values must be within z= 4 standard deviations of the mean.
age Learning. May not be scanned, copied or duplicated, or posted to a publicly accessible website, in whole or in part, except for use as permitted in a license distributed with a certain product or service or
a password-protected website or school-approved learning management system for classroom use.
Statistics for Business and Economic ebyshev’s Theorem xample: Apartment Rents
Let z= 1.5 with ҧ𝑥 = 590.80 and s= 54.74
At least (1 - 1/(1.5)2) = 1 - 0.44 = 0.56 or 56%
of the rent values must be between
ҧ𝑥 -z(s) = 590.80 - 1.5(54.74) = 509 and
ҧ𝑥 + z(s) = 590.80 + 1.5(54.74) = 673
(Actually, 86% of the rent values are between 509 and 673.)
age Learning. May not be scanned, copied or duplicated, or posted to a publicly accessible website, in whole or in part, except for use as permitted in a license distributed with a certain product or service or
a password-protected website or school-approved learning management system for classroom use.
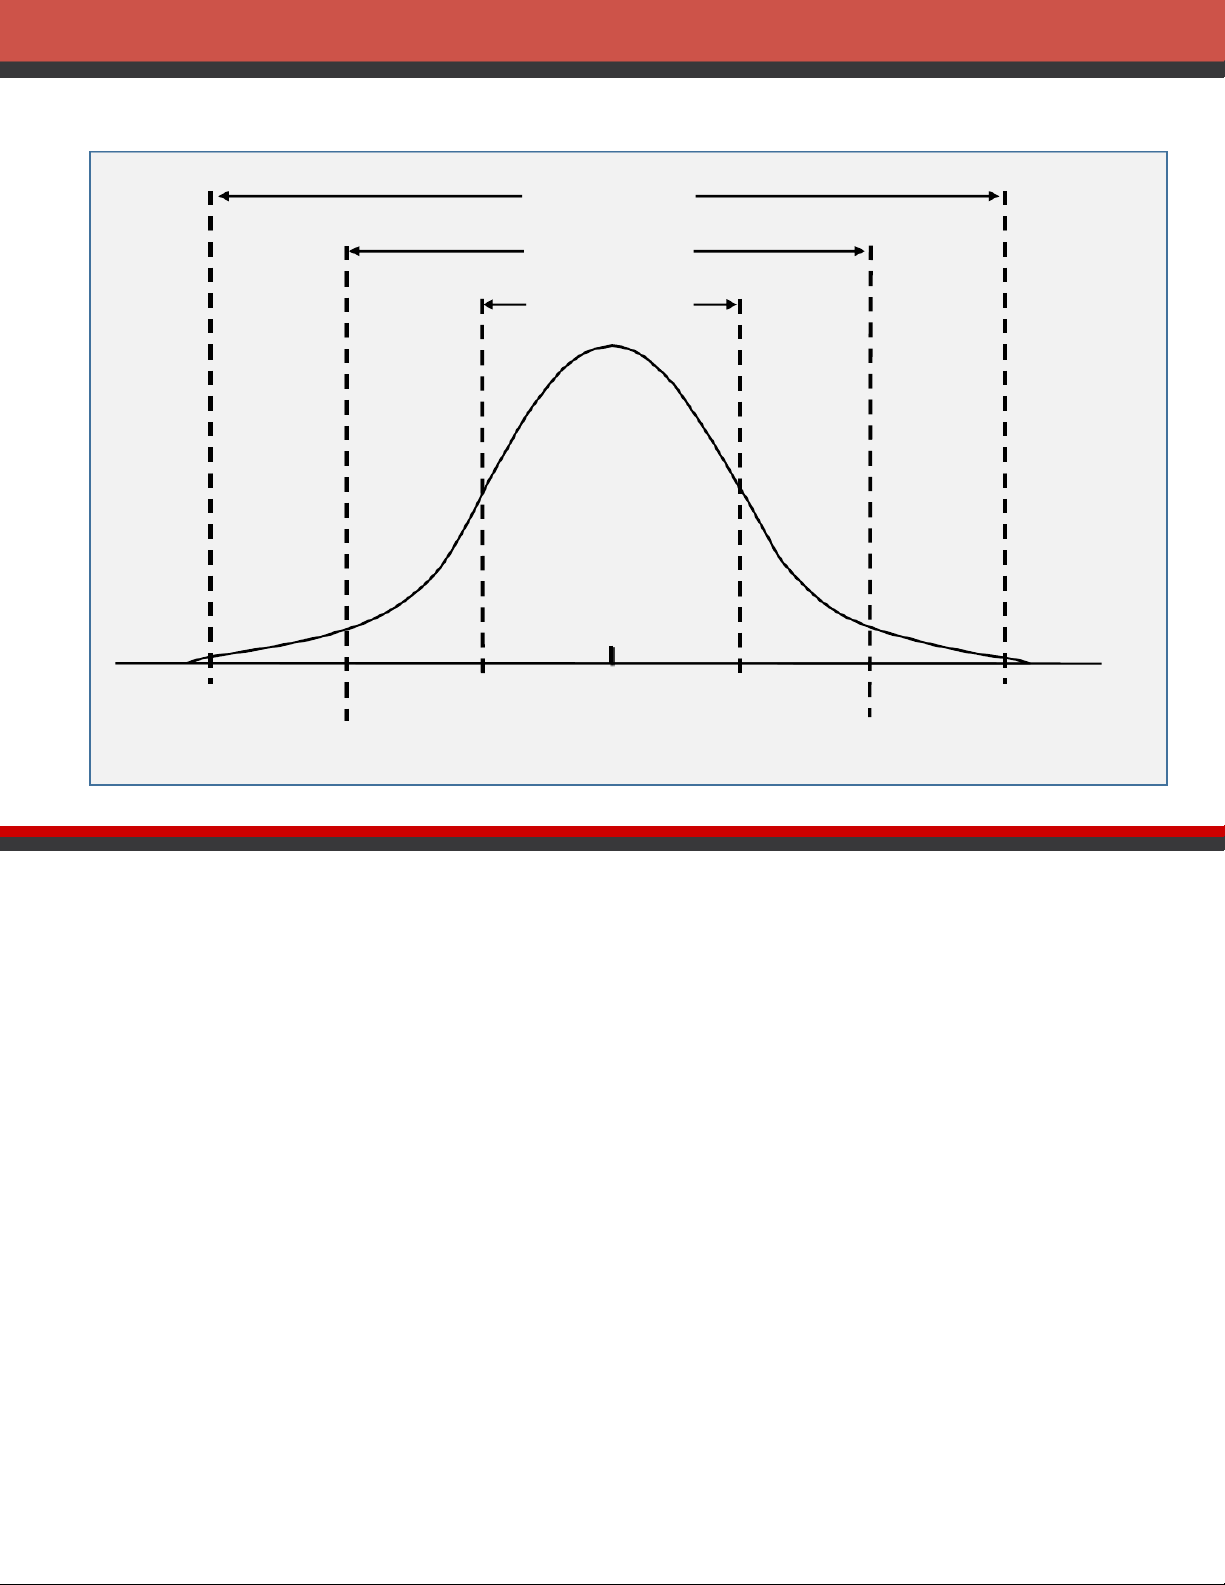
Statistics for Business and Economic mpirical Rule
When the data are believed to approximate a bell-shaped distribution:
•The empirical rule can be used to determine the percentage of data
values that must be within a specified number of standard deviations of the mean.
•The empirical rule is based on the normal distribution, which is covered in Chapter 6.
age Learning. May not be scanned, copied or duplicated, or posted to a publicly accessible website, in whole or in part, except for use as permitted in a license distributed with a certain product or service or
a password-protected website or school-approved learning management system for classroom use.
Statistics for Business and Economic mpirical Rule
r data having a bell-shaped distribution:
Approximately 68% of the data values will be within one standard deviation of the mean.
Approximately 95% of the data values will be within two standard deviations of the mean.
Almost all of the data values will be within three standard deviations of the mean.
age Learning. May not be scanned, copied or duplicated, or posted to a publicly accessible website, in whole or in part, except for use as permitted in a license distributed with a certain product or service or
a password-protected website or school-approved learning management system for classroom use.
Statistics for Business and Economic mpirical Rule 99.72% 95.44% 68.26% z m–3 s m –1 s m m+ 1s m+ 3s m–2 s m+ 2s
age Learning. May not be scanned, copied or duplicated, or posted to a publicly accessible website, in whole or in part, except for use as permitted in a license distributed with a certain product or service or
a password-protected website or school-approved learning management system for classroom use.
Statistics for Business and Economic tecting Outliers
n outlier is an unusually small or unusually large value in a data set.
data value with a z-score less than -3 or greater than +3 might be considered an outlier. might be:
•an incorrectly recorded data value
•a data value that was incorrectly included in the data set
•a correctly recorded data value that belongs in the data set
age Learning. May not be scanned, copied or duplicated, or posted to a publicly accessible website, in whole or in part, except for use as permitted in a license distributed with a certain product or service or
a password-protected website or school-approved learning management system for classroom use.
Tài liệu liên quan:
-

Bảng giá trị phân phối thống kê poisson và student môn Xác suất thống kê| Trường Đại học Ngoại Thương
27 14 -

Bảng giá trị quyết định thống kê wilcoxon rank-sum test môn Xác suất thống kê| Trường Đại học Ngoại Thương
29 15 -

Bài 1 Định nghĩa cổ điển về xác suất môn Xác suất thống kê| Trường Đại học Ngoại Thương
26 13 -

Exercises for probability & statistics môn Xác suất thống kê| Trường Đại học Ngoại Thương
26 13 -

Đề thi cuối kỳ lý thuyết môn Xác suất thống kê| Trường Đại học Ngoại Thương
27 14