Tài liệu về Chapter 2 :Thinking Like an Economist môn Tiếng Anh A1 | Đại học Thăng Long
Tài liệu về Chapter 2 :Thinking Like an Economist môn Tiếng Anh A1 | Đại học Thăng Long được chia sẻ dưới dạng file PDF sẽ giúp bạn đọc tham khảo , củng cố kiến thức ,ôn tập và đạt điểm cao. Mời bạn đọc đón xem!
Trường: Trường Đại học Thăng Long 550 tài liệu
Tác giả:

Preview text:
lOMoARcPSD| 40615597 Microeconomics lOMoAR cPSD|
Chapter 2: Thinking Like an Economist
Name:……………………………. Class:……………………………
1. The production possibilities frontier is a
a. map which shows the frontier beyond which agriculture is unprofitable.
b. map which shows areas of the world in which capitalist production is now possible.
c. graph that shows the various combinations of output that the economy
can possibly produce given the available resources and technology.
d. graph which shows the various combinations of resources that can be
used to produce a given level of output.
2. Which of the following concepts is NOT illustrated by the production possibilities frontier? a. efficiency b. opportunity cost c. equity d. tradeoffs lOMoARcPSD| 40615597
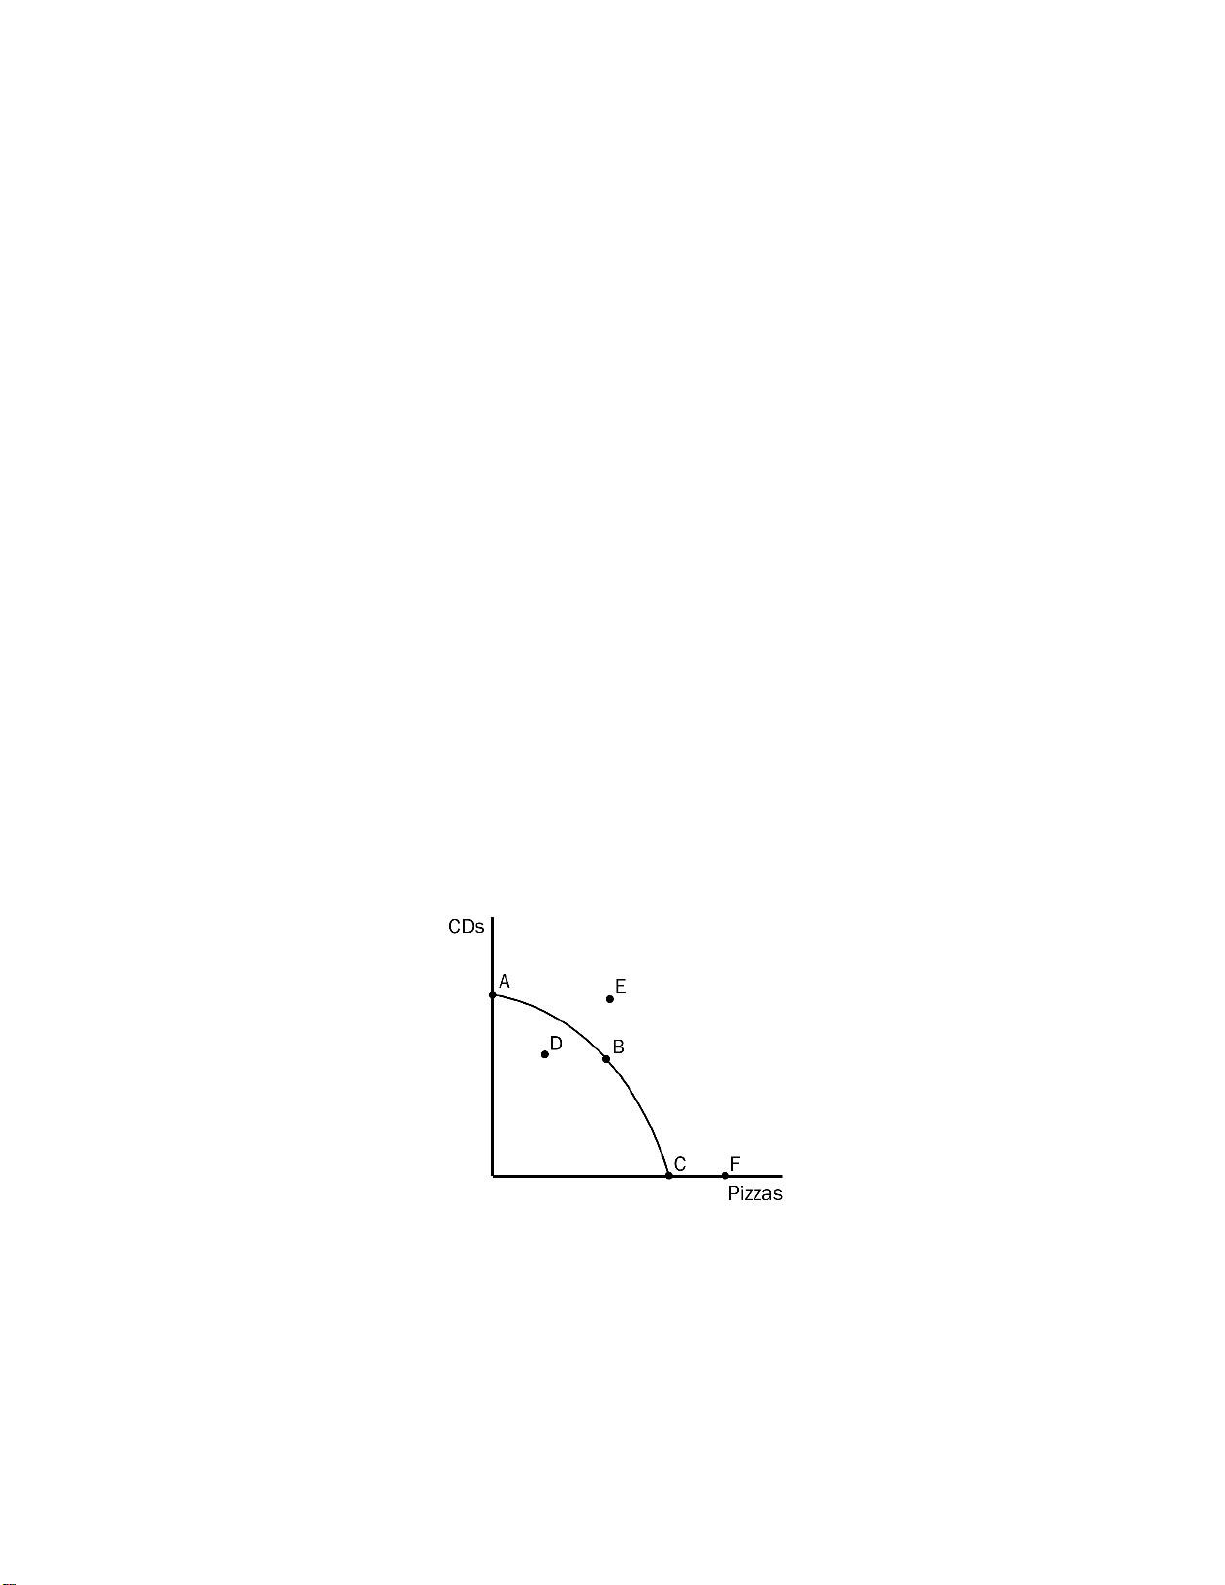
3. On the production possibilities frontier shown, which point or points are
possible for this economy to produce? a. A, B, C, D b. A, B, C, F c. A, B, C, D, E, F d. D
4. On the production possibilities frontier shown, which point or points are inefficient? a. A, B, C b. E, F c. B d. D
5. The opportunity cost of obtaining more of one good is shown on the production possibilities frontier as the
a. amount of the other good which must be given up.
b. market price of the additional amount produced.
c. amount of resources which must be devoted to its production.
d. number of dollars which must be spent to produce it.
6. A production possibilities frontier will be linear and not bowed out if a. no tradeoffs exist.
b. the tradeoff between the two goods is always at a constant rate.
c. the unemployment rate is zero.
d. resources are allocated efficiently. lOMoARcPSD| 40615597
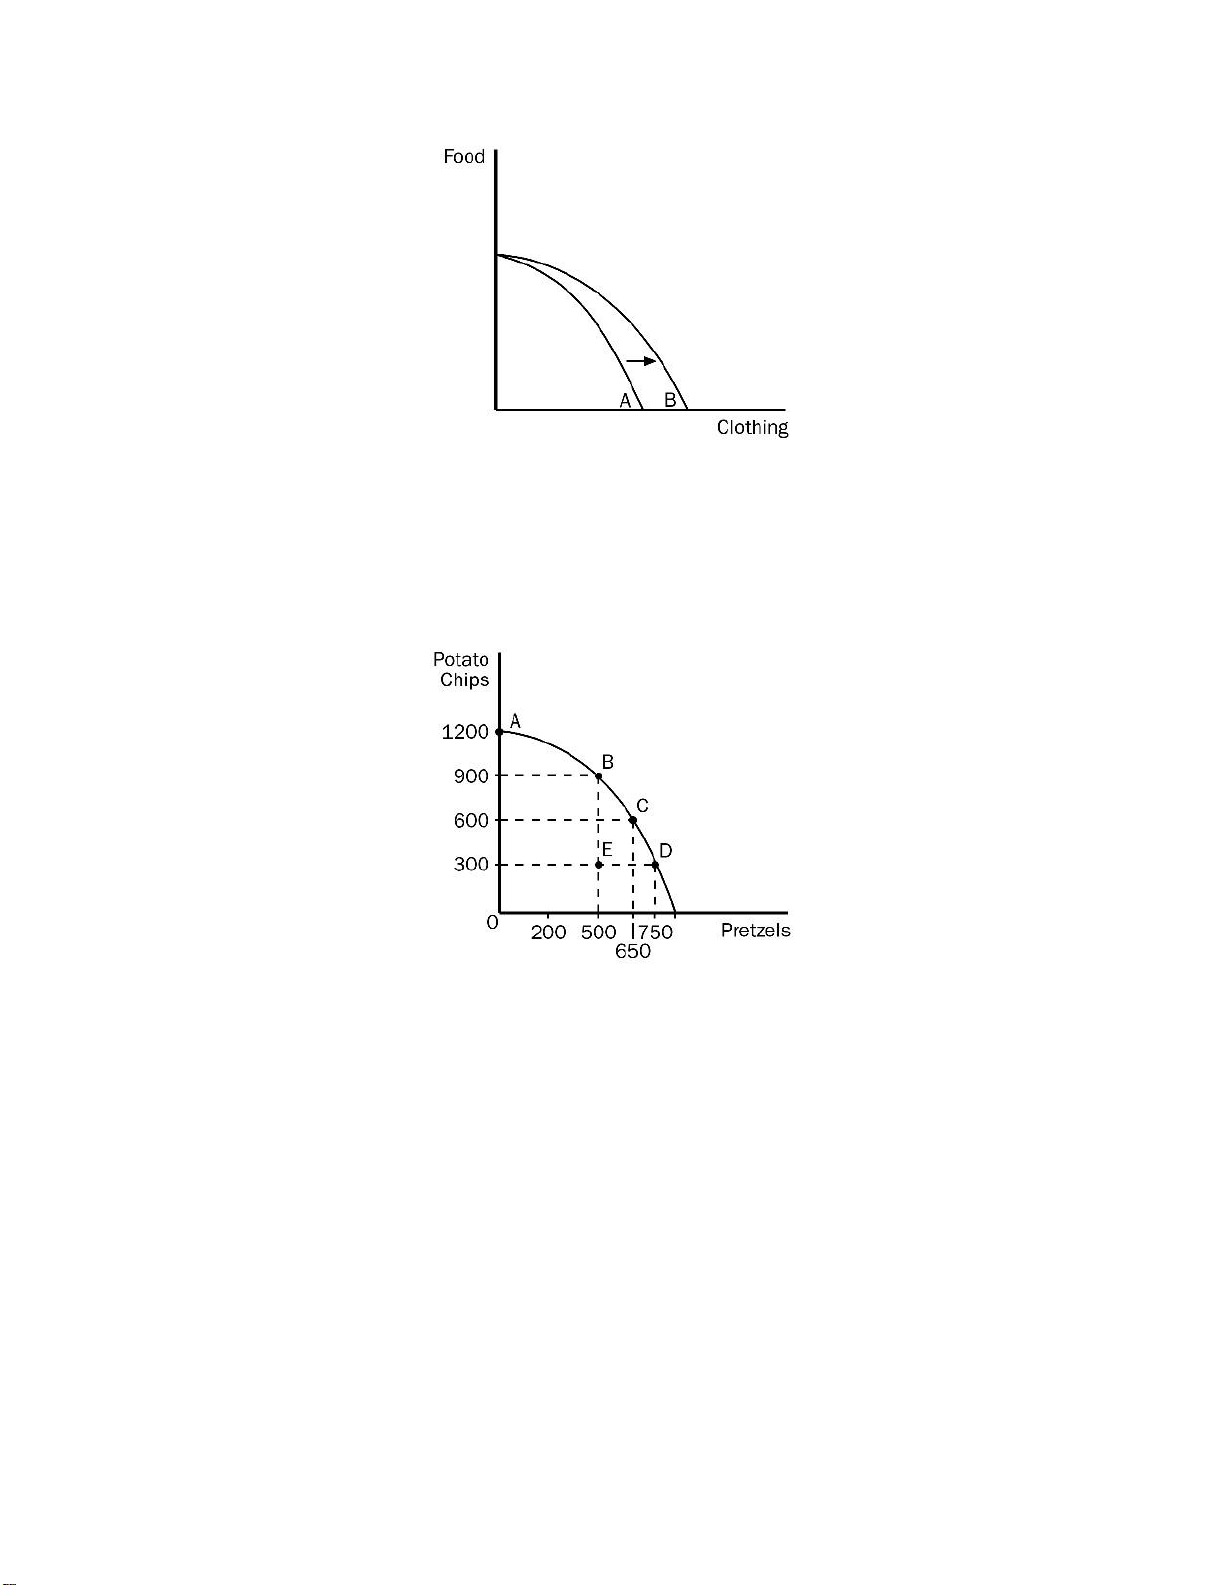
7. In the production possibilities frontier shown, the shift of the frontier from A to
B was most likely caused by which of the following?
a. more capital available in the economy
b. more labor available in the economy
c. a general technological breakthrough
d. technological improvement in the production of clothing
8. In the production possibilities frontier shown, what is the opportunity cost to
society of the movement from point D to point B? a. 600 pretzels b. 800 pretzels c. 250 pretzels d. 100 pretzels lOMoARcPSD| 40615597
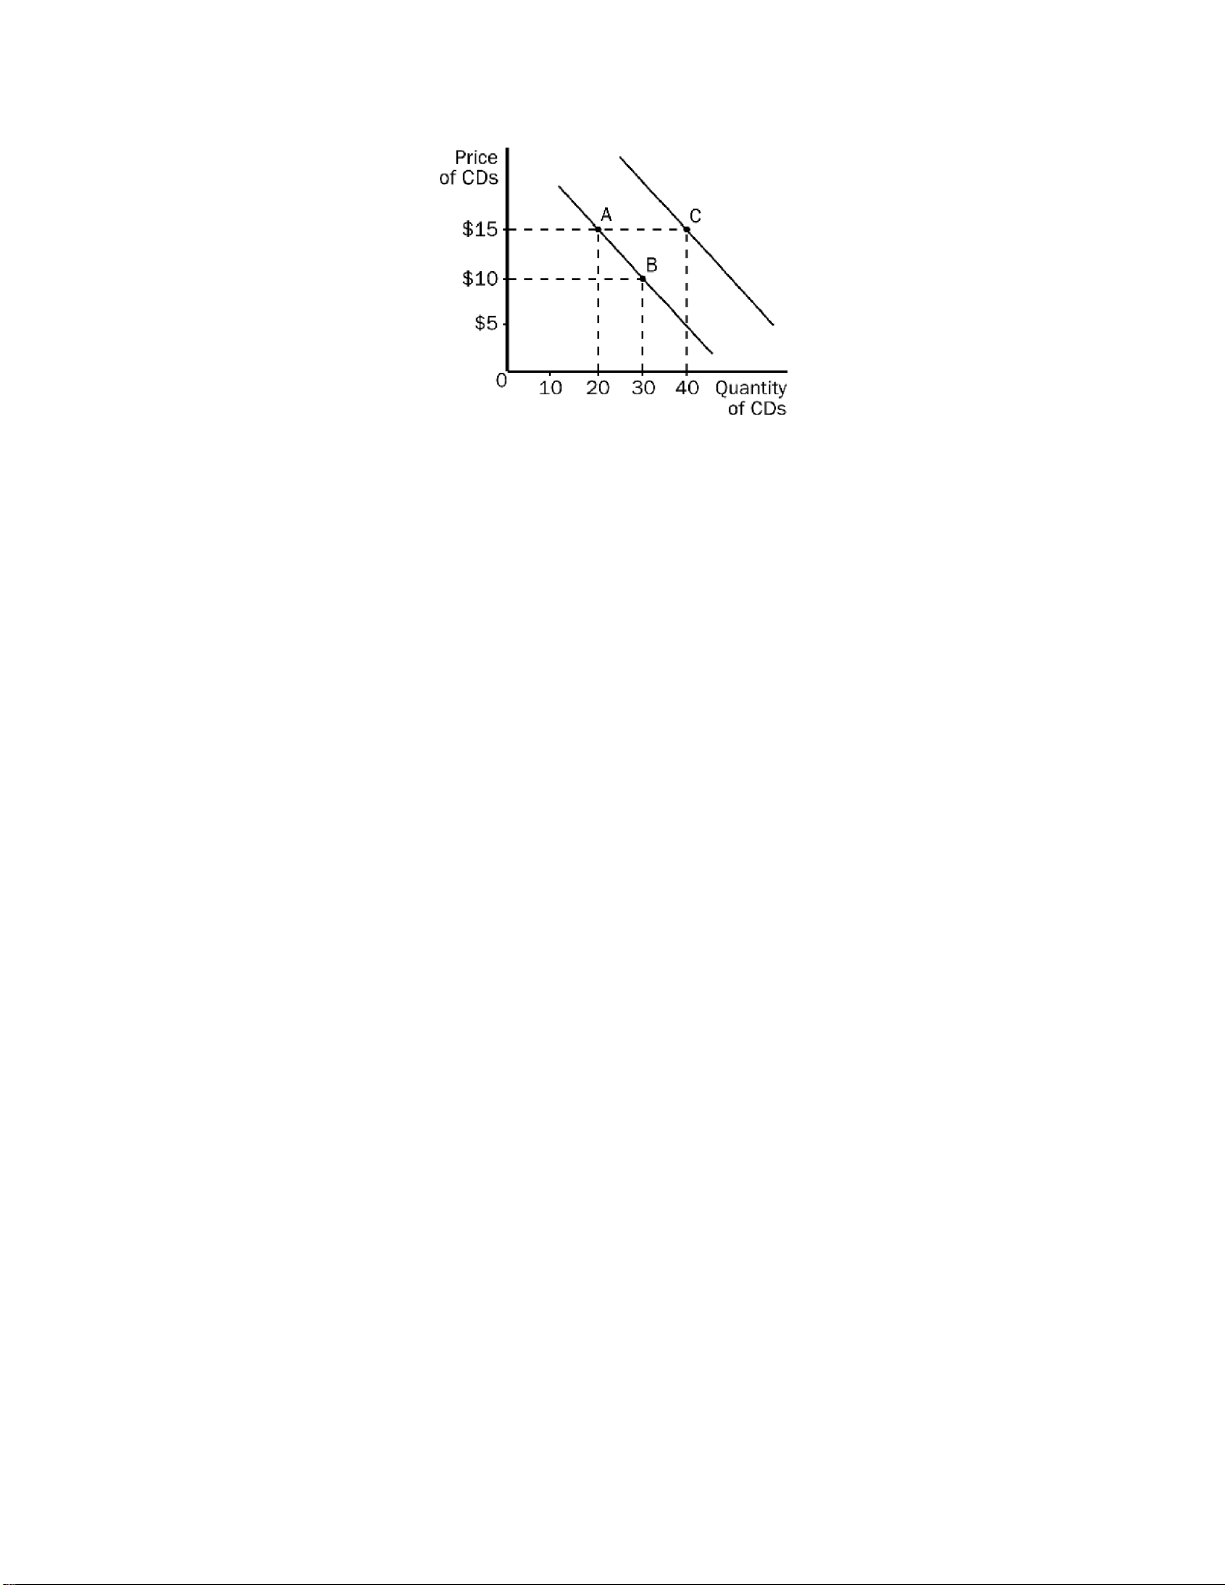
9. In the graph shown, the slope of the curve between points A and B is a. –2 b. –1/2 c. 1/2 d. 2