Tài liệu về ô nhiễm CO2 trên toàn thế giới môn Ô Nhiễm Môi Trường | Trường Đại học Khoa học, Đại học Thái Nguyên
Tài liệu về ô nhiễm CO2 trên toàn thế giới môn Ô Nhiễm Môi Trường | Trường Đại học Khoa học, Đại học Thái Nguyên. Tài liệu được sưu tầm giúp bạn tham khảo, ôn tập và đạt kết quả cao. Mời bạn đọc đón xem.
Môn: Ô nhiễm môi trường 3 tài liệu
Trường: Trường Đại học Khoa học - Đại học Thái Nguyên 85 tài liệu
Tác giả:


Preview text:
CO2 Emissions in 2023
A new record high, but is there light at the end of the tunnel? INTERNATIONAL ENERGY AGENCY The IEA examines the IEA member IEA association full spectrum countries: countries: of energy issues including oil, gas and Australia Argentina coal supply and Austria Brazil demand, renewable energy technologies, Belgium China electricity markets, Canada Egypt energy efficiency, Czech Republic India access to energy, Denmark Indonesia demand side Estonia Kenya management and Finland Morocco much more. Through France Senegal its work, the IEA Germany Singapore advocates policies that Greece South Africa will enhance the Hungary Thailand reliability, affordability Ireland Ukraine and sustainability of energy in its Italy 31 member countries, Japan 13 association Korea countries and beyond. Lithuania Luxembourg Mexico Netherlands New Zealand Norway Poland Portugal Slovak Republic Spain Sweden Switzerland Republic of Türkiye This publication and any United Kingdom map included herein are United States without prejudice to the status of or sovereignty over any territory, to the delimitation of international frontiers and boundaries and to the name of any territory, The European city or area. Commission also participates in the work of the IEA Source: IEA. International Energy Agency Website: www.iea.org CO2 Emissions in 2023 Executive Summary
• Global energy-related CO2 emissions grew by 1.1% in 2023, increasing
410 million tonnes (Mt) to reach a new record high of 37.4 billion tonnes
(Gt). This compares with an increase of 490 Mt in 2022 (1.3%). Emissions
from coal accounted for more than 65% of the increase in 2023.
• The global shortfall in hydropower generation due to droughts drove up
emissions by around 170 Mt. Without this effect, emissions from the global
electricity sector would have fallen in 2023.
• Between 2019 and 2023, total energy-related emissions increased around
900 Mt. Without the growing deployment of five key clean energy
technologies since 2019 - solar PV, wind, nuclear, heat pumps, and
electric cars - the emissions growth would have been three times larger.
• Thanks to growing clean energy deployment, emissions are seeing a
structural slowdown. In the decade to 2023, global emissions grew slightly
more than 0.5% per year, the slowest rate since the Great Depression.
• Advanced economy GDP grew 1.7% but emissions fell 4.5%, a record
decline outside of a recessionary period. Having fallen by 520 Mt in 2023,
emissions are now back to their level of fifty years ago. Advanced
economy coal demand, driven by evolutions in the G7, is back to the level
of around 1900. The 2023 decline in advanced economy emissions was
caused by a combination of structural and cyclical factors, including strong
renewables deployment, coal-to-gas switching in the US, but also weaker
industrial production in some countries, and milder weather.
• Emissions in China grew around 565 Mt in 2023, by far the largest
increase globally and a continuation of China’s emissions-intensive
economic growth in the post-pandemic period. However, China continued
to dominate global clean energy additions. Cyclical effects, notably a
historically bad hydro year, contributed about one-third of its emissions
growth in 2023. Per capita emissions in China are now 15% higher than in advanced economies.
• In India, strong GDP growth drove up emissions by around 190 Mt. But a
weak monsoon increased demand for electricity and cut hydro production,
contributing around one-quarter of the increase in its total emissions in
2023. Per capita emissions in India remain far below the world average. 0. Y 4. PAGE | 3 IEA. CC B CO2 Emissions in 2023
Emissions grew in 2023, but clean energy is limiting the growth
Emissions increased in 2023
Total energy-related CO2 emissions increased by 1.1% in 2023. Far from falling
rapidly - as is required to meet the global climate goals set out in the Paris
Agreement - CO2 emissions reached a new record high of 37.4 Gt in 2023.1 This
estimate is based on the IEA’s detailed, cutting-edge region-by-region and fuel-
by-fuel analysis of the latest official national energy data, supplemented by data
on economic and weather conditions.
Understanding the various drivers behind this emissions growth provides insights
into the progress and prospects for the energy transition. This report provides a
timely analysis of both the latest emissions trends and the underlying energy
sector drivers in 2023. It represents a companion piece to our first ever Clean
Energy Market Monitor, released in parallel.
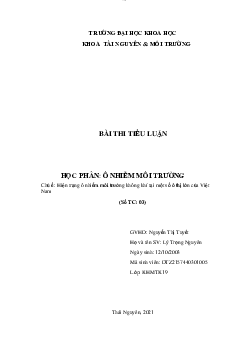
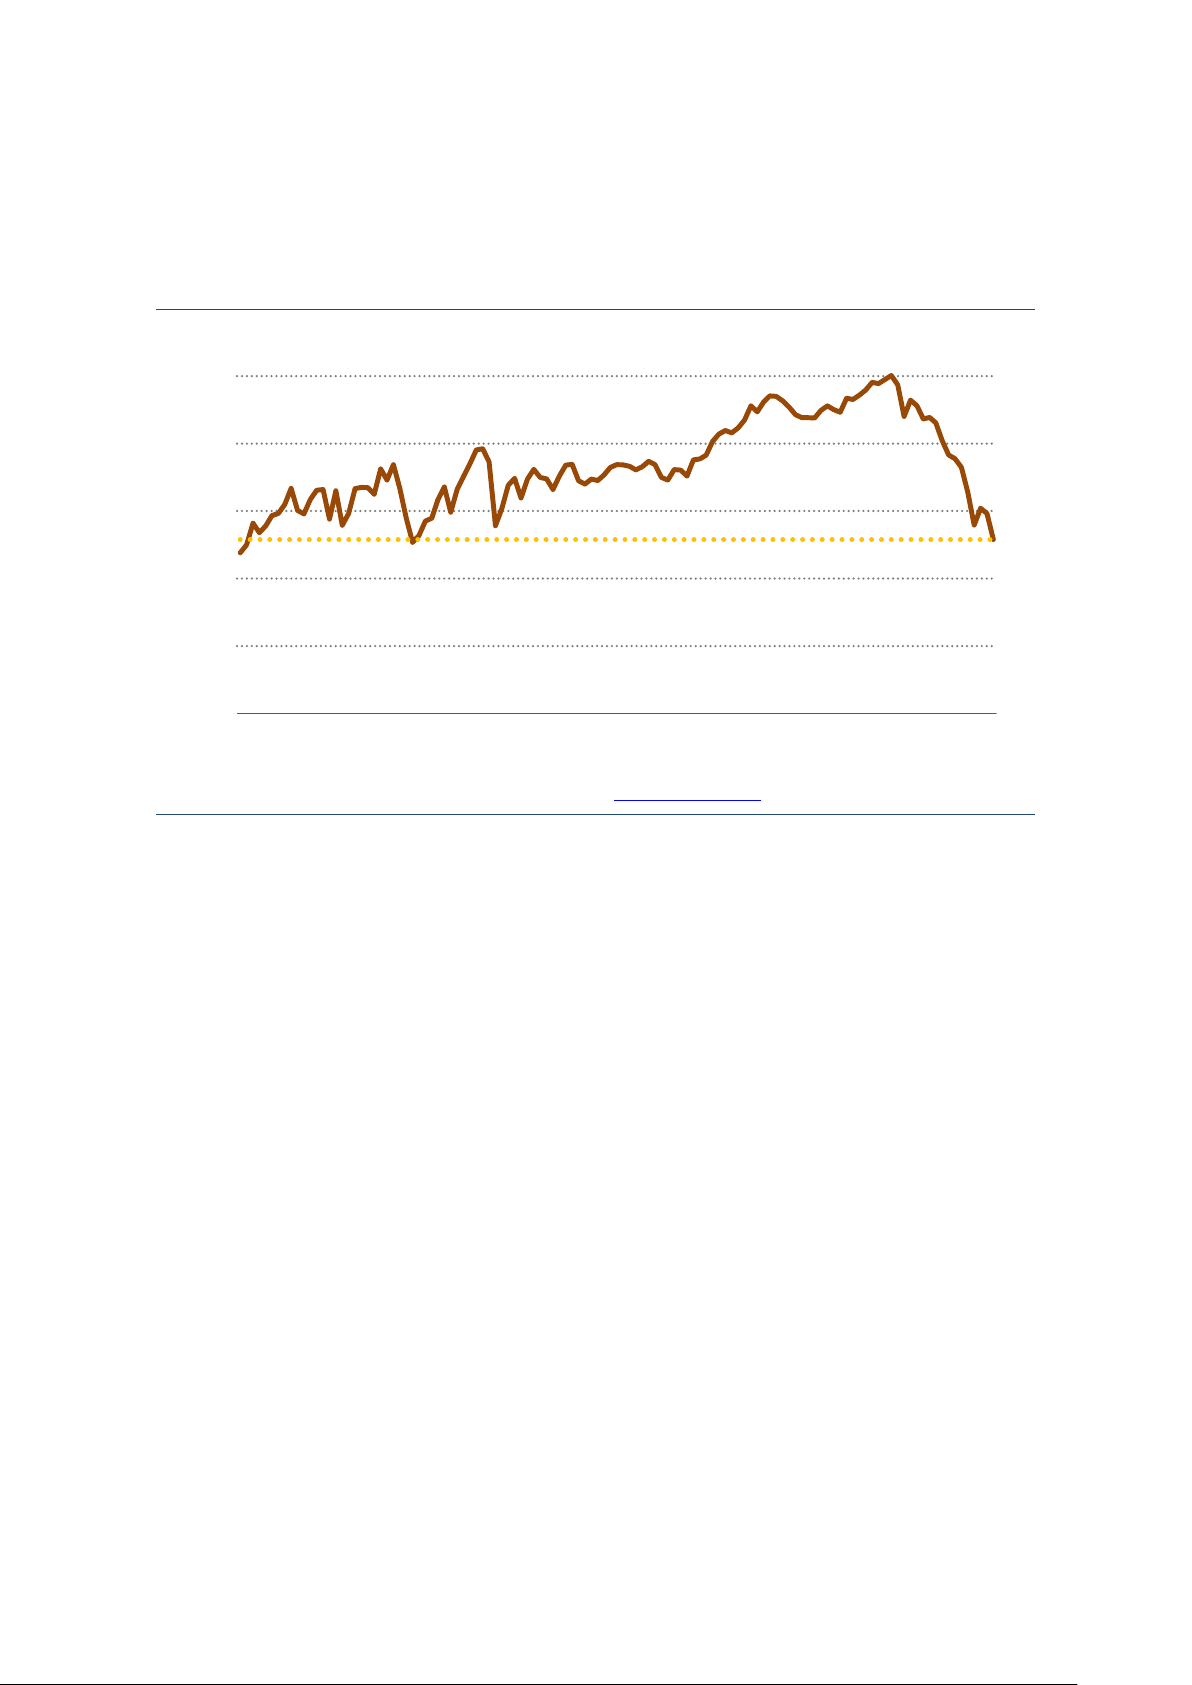
Figure 1: Global energy-related CO2 emissions and their annual change, 1900-2023 ₂ 40 O Gt C 30 20 10 1900 1920 1940 1960 1980 2000 2023 ₂ 2 O 1 Gt C 0 -1 -2 IEA. CC BY 4.0. 1 This includes CO
2 emissions from energy combustion, industrial processes, and flaring. Elsewhere in this report, unless 0.
explicitly mentioned, CO2 emissions refers to emissions from energy combustion and industrial processes excluding flaring. Y 4. PAGE | 4 IEA. CC B CO2 Emissions in 2023
… but clean energy is making a difference
The 1.1% increase in emissions in 2023 represented an increase of around
410 million tonnes (Mt CO2). The percentage growth of emissions was
substantially slower than global GDP growth, which was around 3% in 2023. Last
year therefore continued the recent trend of CO2 growing more slowly than global
economic activity. Over the ten years ending with 2023, global CO2 emissions
have grown by slightly more than 0.5% per year. This is not just due to the Covid-
19 pandemic: although emissions fell precipitously in 2020, by the following year
they had already rebounded to the pre-pandemic level. It was also not caused by
slow global GDP growth, which averaged a robust 3% per year across the course
of the previous decade, in line with the annual average over the last 50 years.
The rate of emissions growth seen over the last decade is slower than that seen
during the 1970s and 1980s, which saw major disruptions with the two energy
shocks of 1973-4 and 1979-80, and a macroeconomic shock of global significance
with the fall of the Soviet Union in 1989-90. When the last ten years are put in a
broader historical context, a comparably slow rate of CO2 emissions growth only
occurred in the extremely disruptive decades of World War I and the Great
Depression. Global CO2 emissions are therefore undergoing a structural
slowdown even as global prosperity grows.
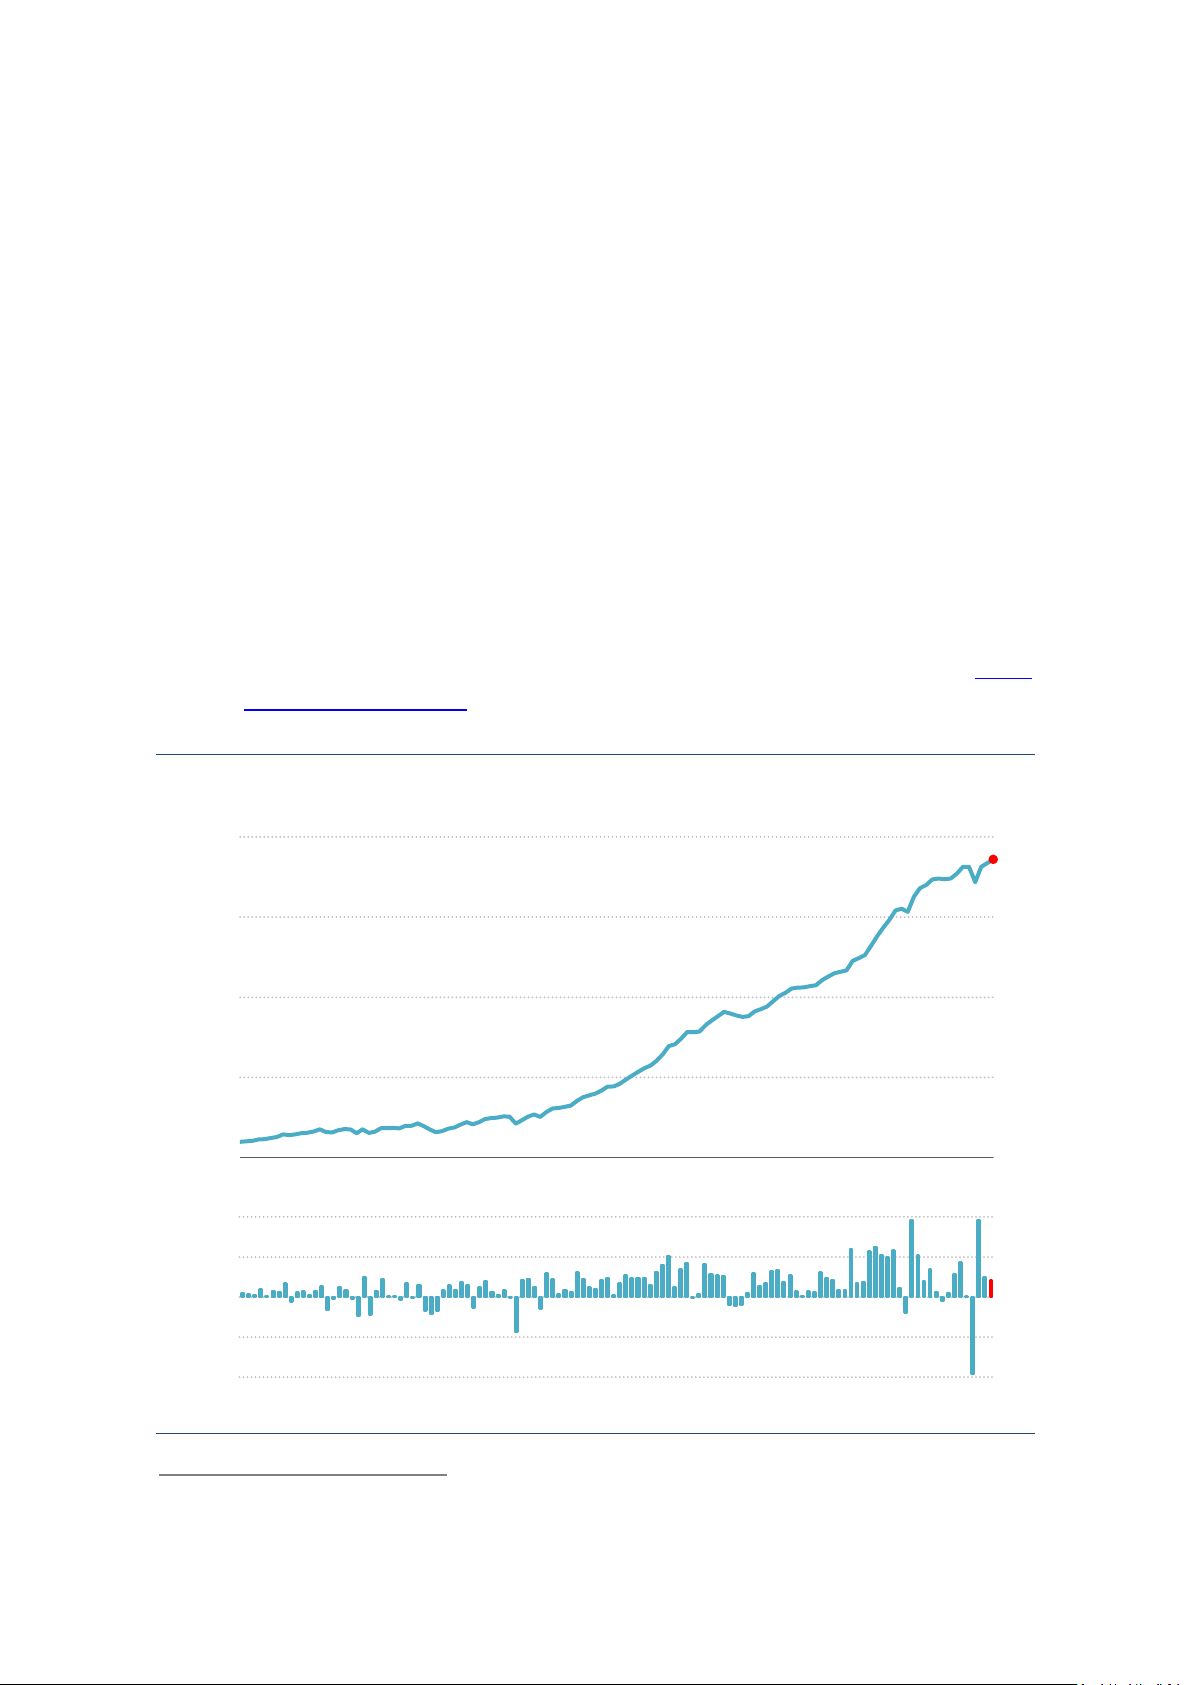
Figure 2: Annual average rate of global CO2 emissions and GDP growth by decade, 1903-2023 WWI and Great Energy shocks Rise of Clean energy Depression and fall of driven Soviet Union China slowdown 6% 4% 2% 0% -2%
1913 1923 1933 1943 1953 1963 1973 1983 1993 2003 2013 2023 Decade ending CO₂ emissions GDP IEA. CC BY 4.0. 0. Y 4. PAGE | 5 IEA. CC B CO2 Emissions in 2023
Clean energy is at the heart of this slowdown in emissions. Global capacity
additions of wind and solar PV reached a record almost 540 GW in 2023, up 75%
on the level of 2022. Global sales of electric cars climbed to around 14 mil ion, an
increase of 35% on the level of 2022. Clean energy is having a significant impact
on the trajectory of global CO2 emissions.
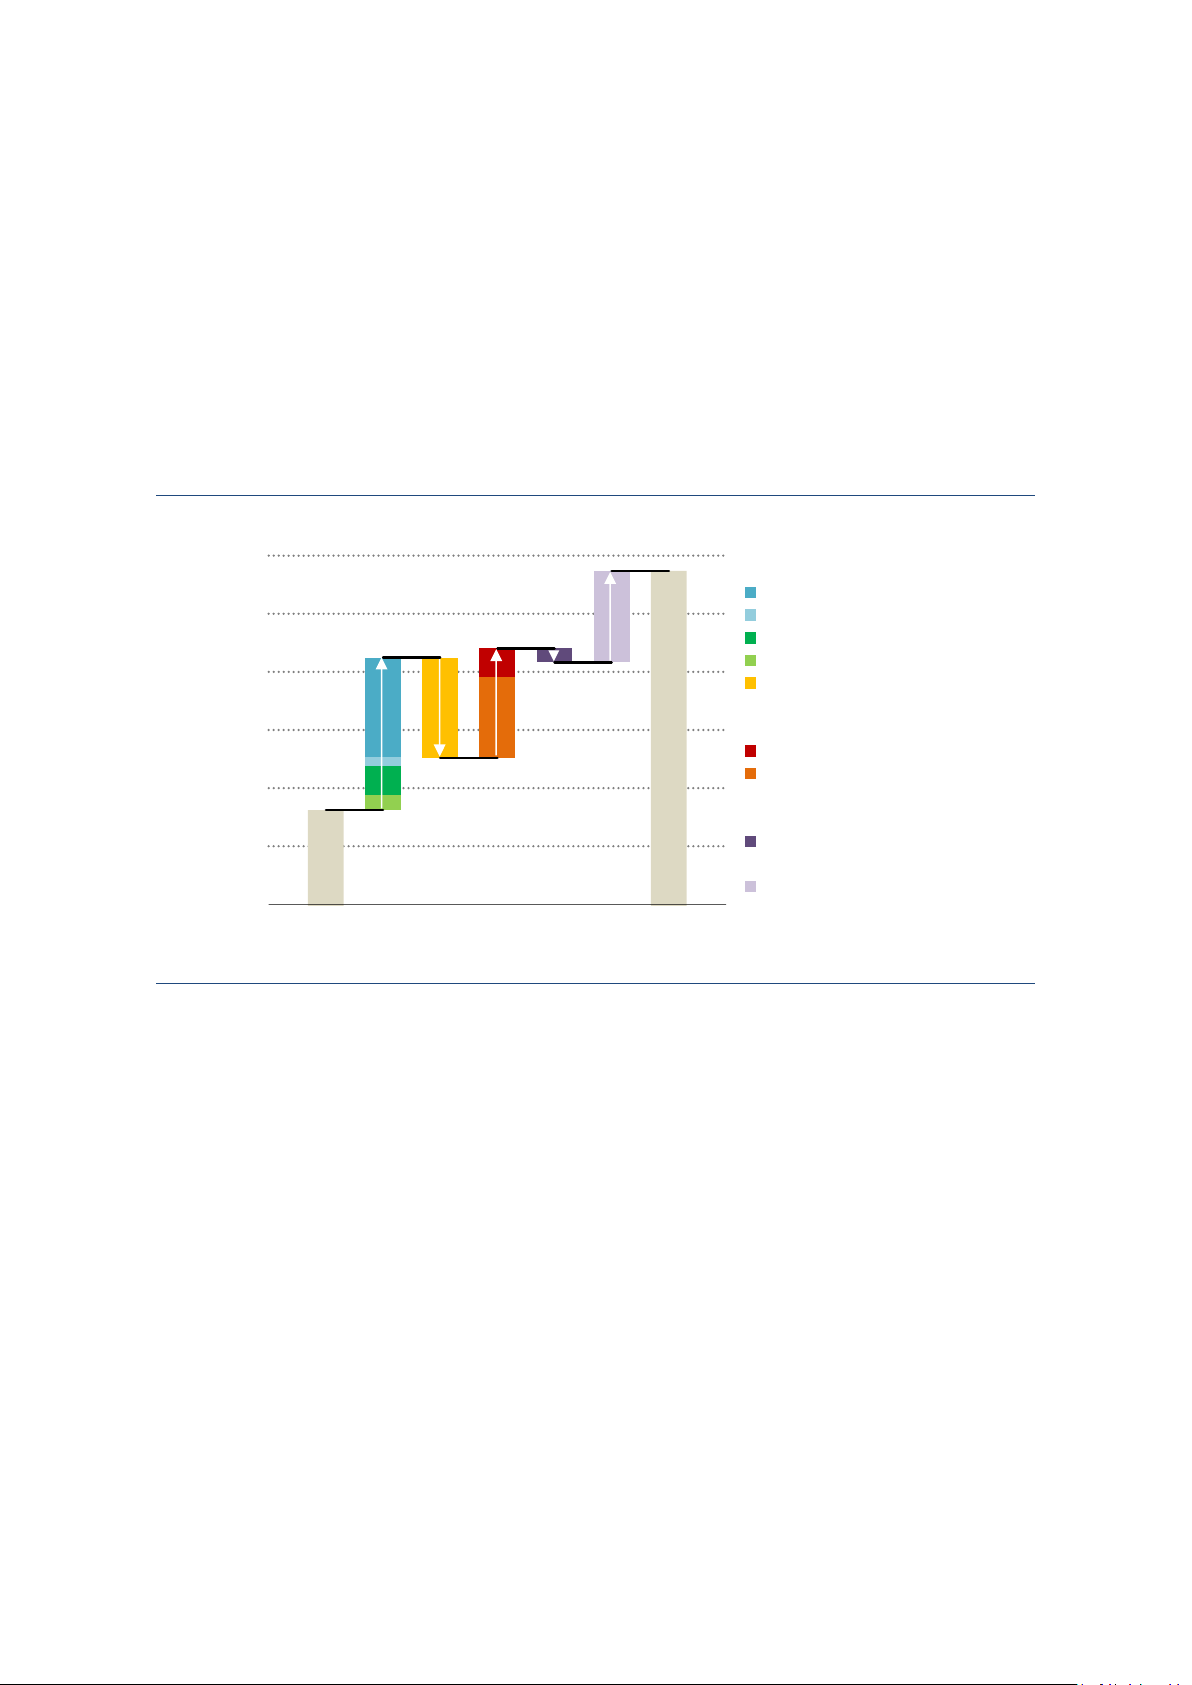
On the back of Covid-19 stimulus packages, there has been a significant
acceleration in clean energy deployment since 2019. Between 2019 and 2023,
total energy-related emissions increased around 900 Mt. Without the growing
deployment of five key clean energy technologies since 2019 - solar PV, wind
power, nuclear power, heat pumps, and electric cars - the emissions growth would have been three times larger.
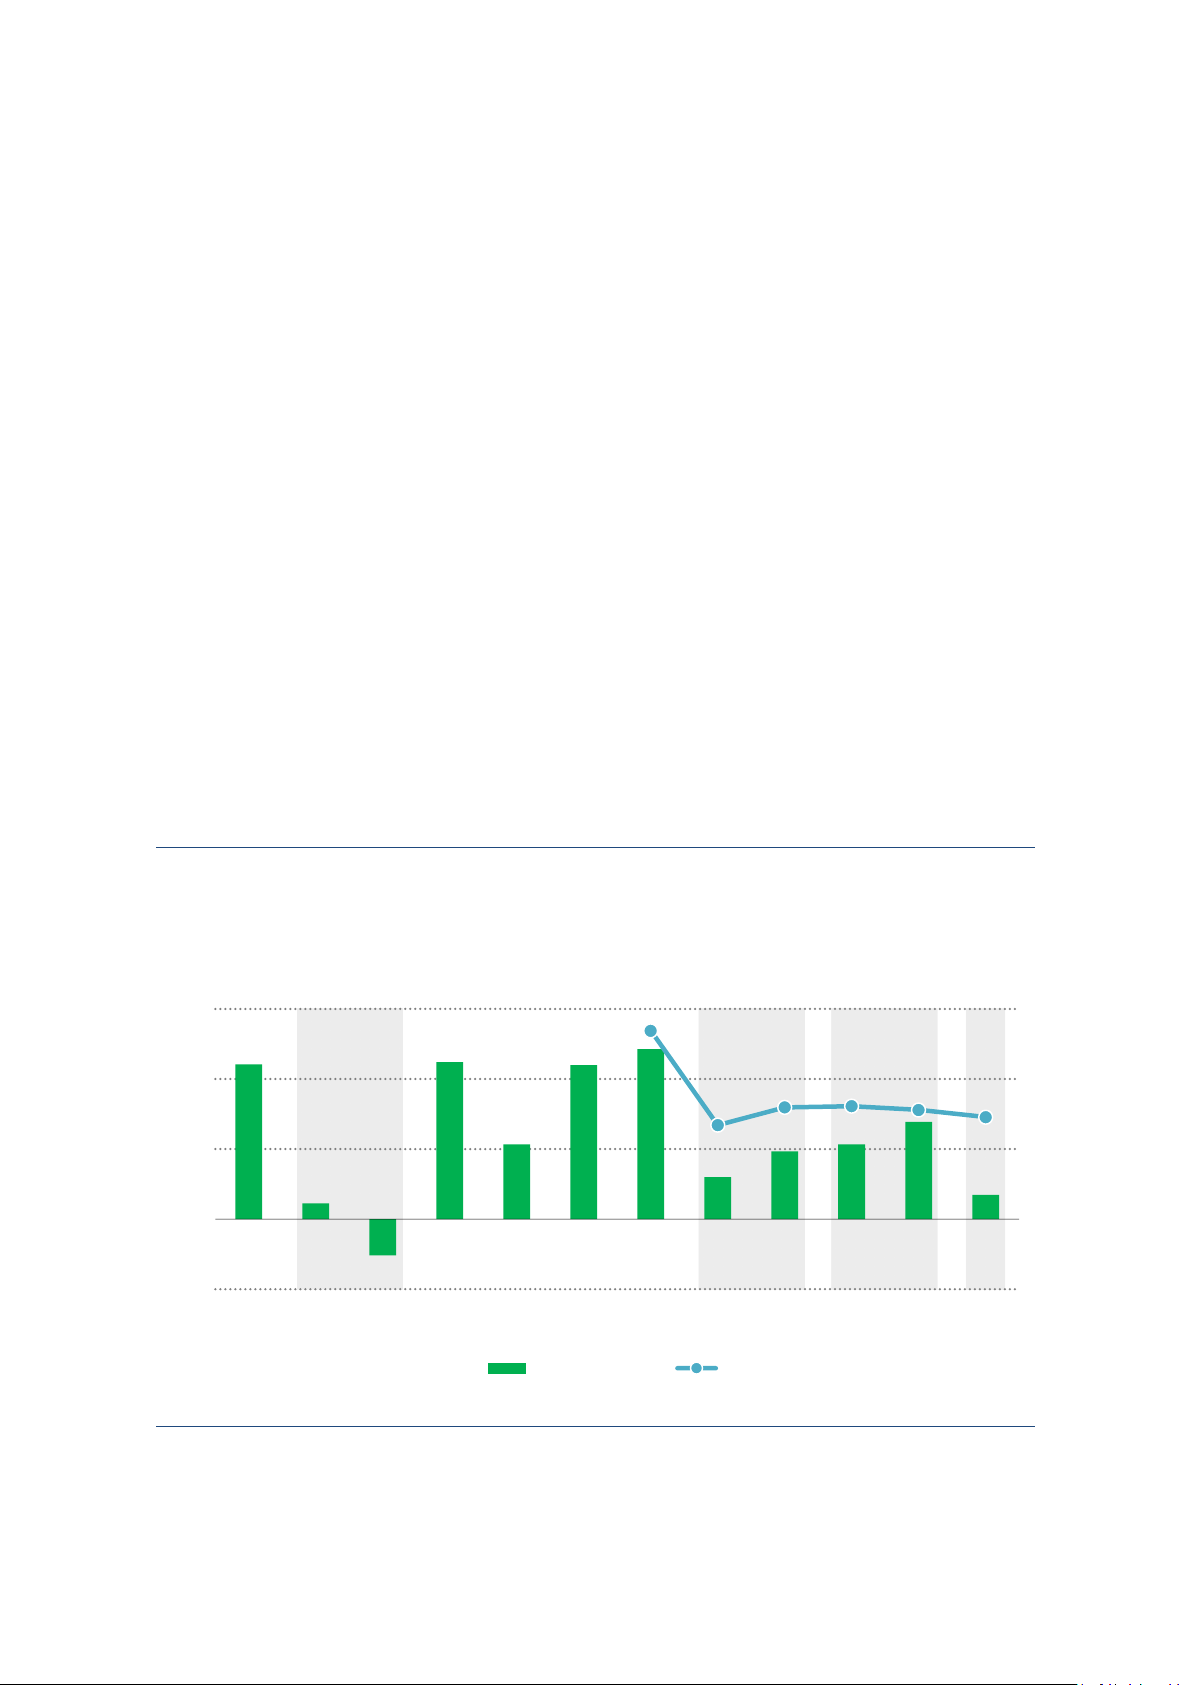
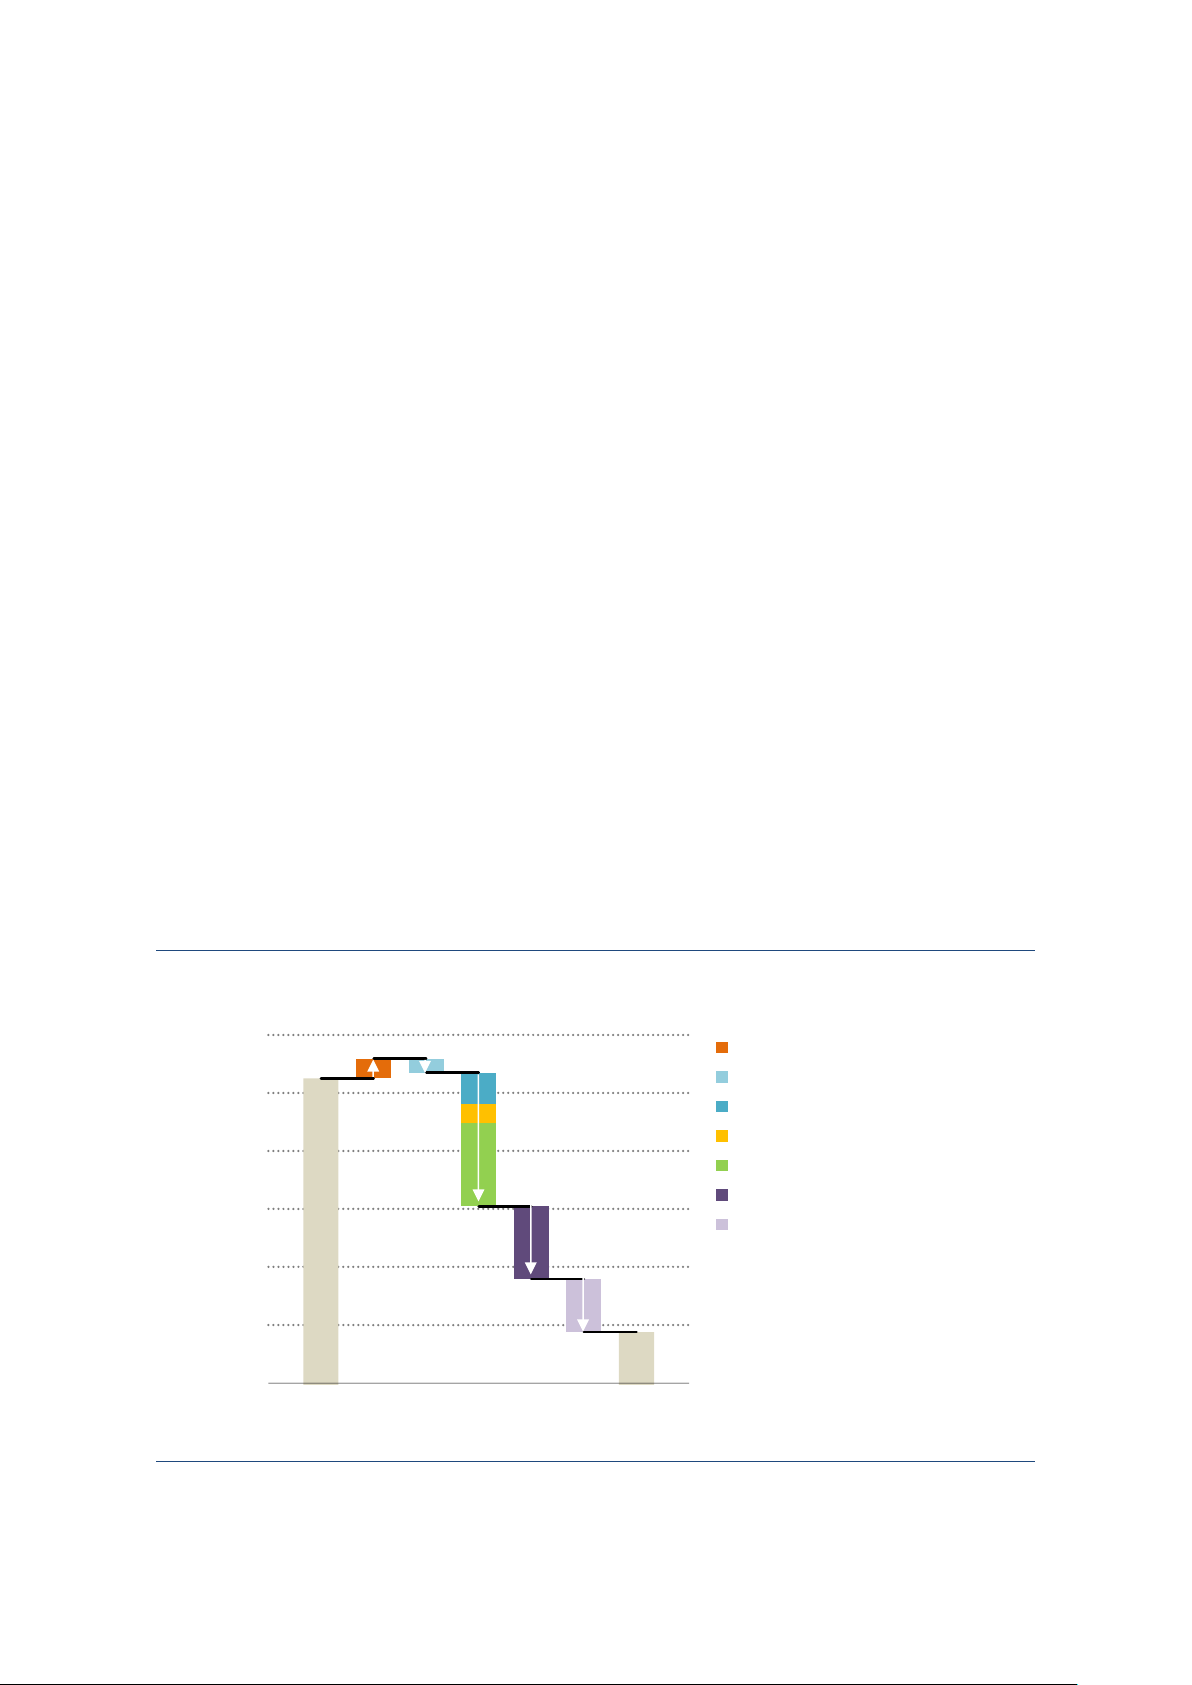
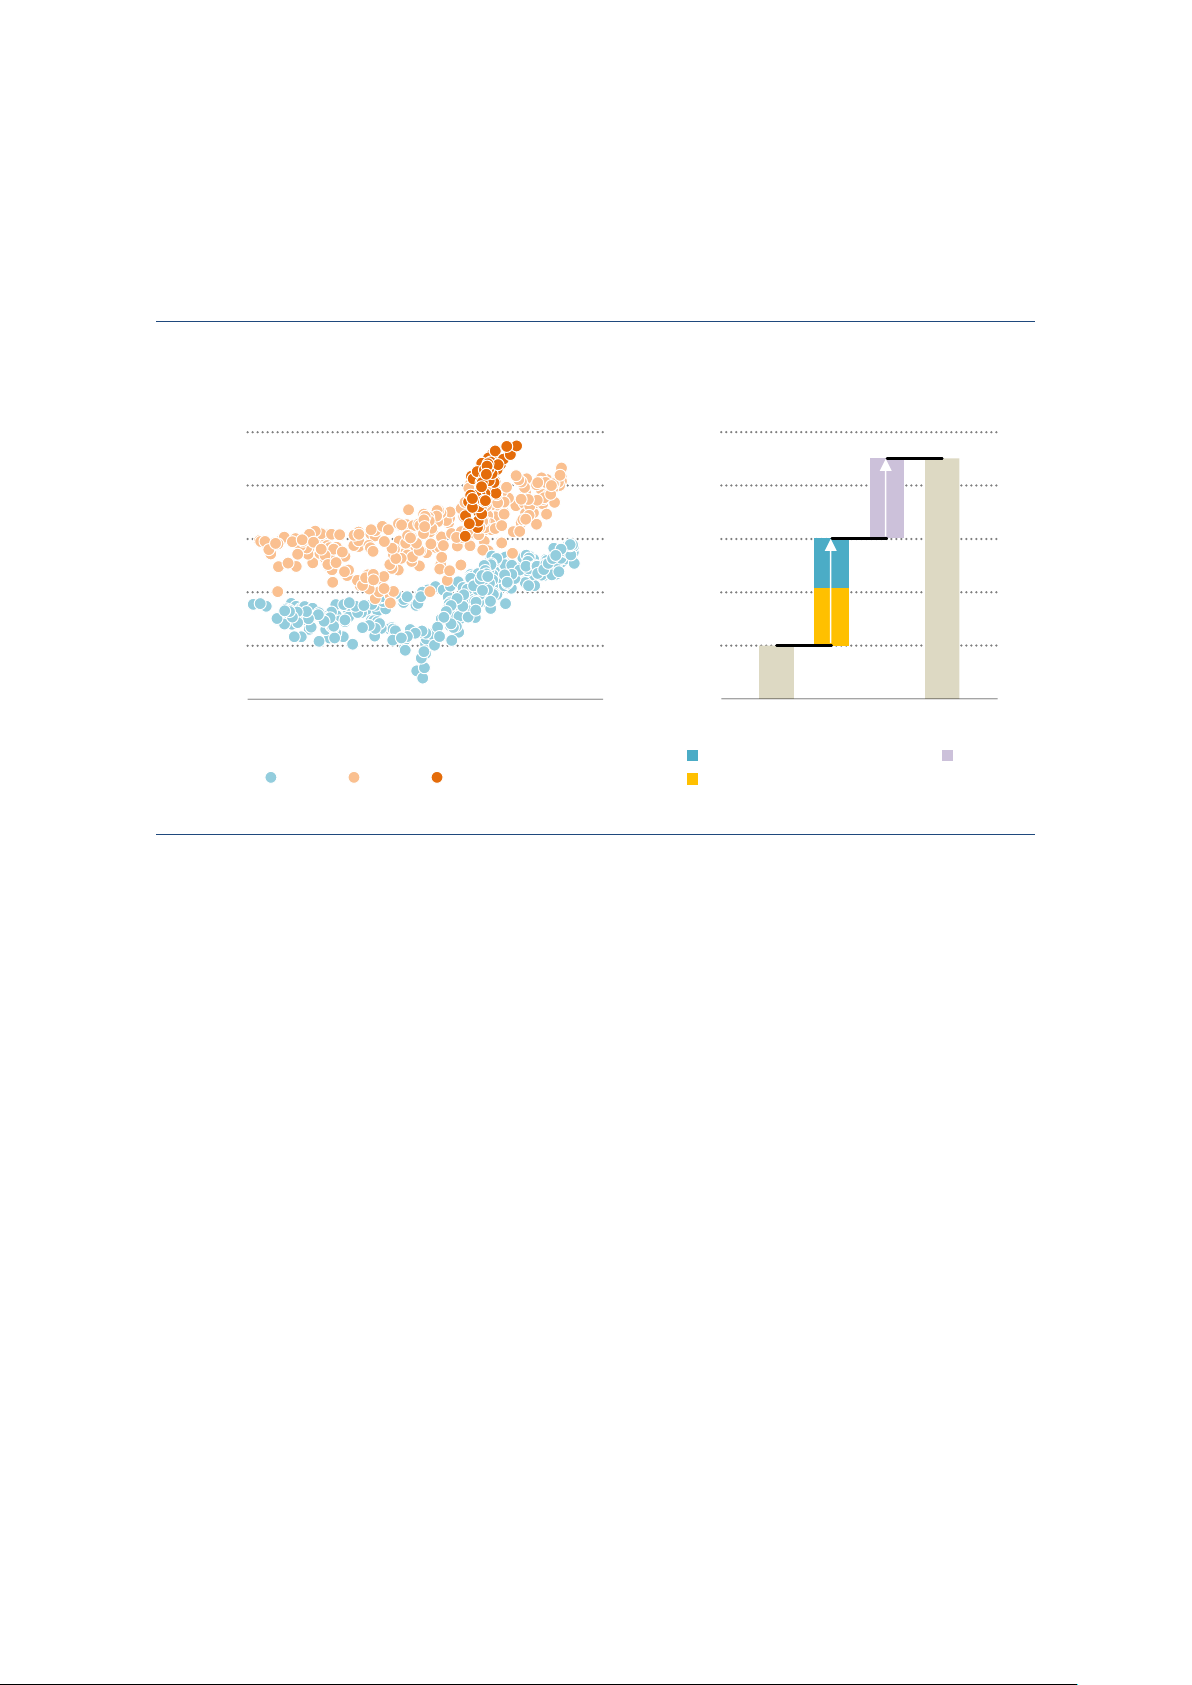
Figure 3: Change in CO2 emissions from energy combustion and avoided emissions
from deployment of major clean technologies, 2019-2023 38 O₂ Nuclear Gt C Wind 36 Solar PV 34 32 30 2019 Increase without Decrease from 2023 clean tech. clean tech. deployment deployment IEA. CC BY 4.0. 0. Y 4. PAGE | 6 IEA. CC B CO2 Emissions in 2023
Weather and continued Covid-19 reopening
effects played an important role in the emissions increase
The following sections outline a series of factors - both positive and negative - that
shaped the change in CO2 emissions between 2022 and 2023. In summary, the
cumulative net impact of these effects accounts for nearly two-thirds of the overall
increase in emissions, or around 255 Mt CO2 of the 410 Mt of observed increase.
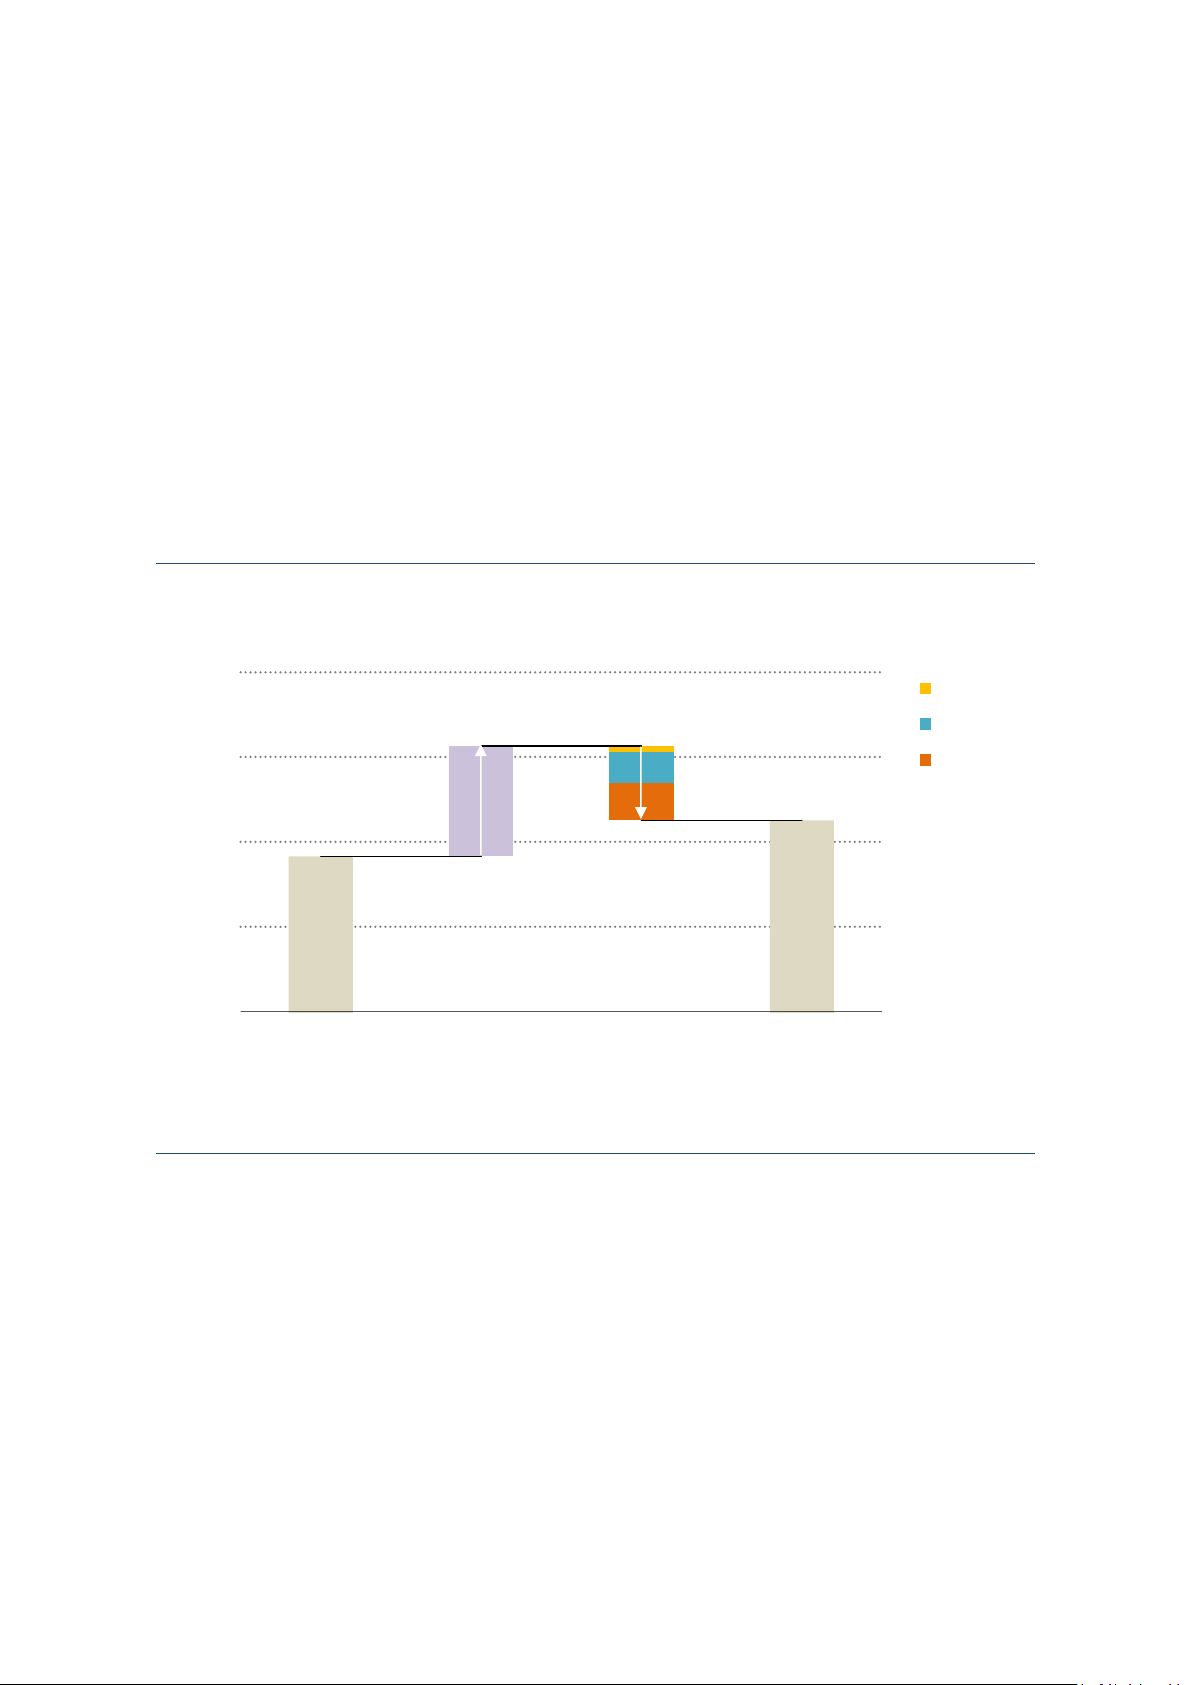
Figure 4: Change in global CO2 emissions by driver, 2022-2023 37 200 CO₂ Weather impact Hydro shortfal Mt 37 100 Wind shortfal Cooling degree days 37 000 Poor monsoon in India Heating degree days 36 900
Continued post-covid reopening Road transport in China Aviation 36 800
Industry in advanced economies 36 700 Weaker industrial output Other 36 600 2022 2023 IEA. CC BY 4.0. Temperature
Temperatures have significant impacts on energy sector emissions, by affecting
energy demand for heating and cooling. 2023 was the hottest year on record.
However, 2022 was also marked by extremely high temperatures in major regions
with high ownership rates of air conditioning. 2023 was hot globally, but 2022 was
hotter or just as hot in the regions accounting for a large share of global energy
demand for air conditioning. The increase in emissions from more cooling demand
globally in 2023 was therefore relatively small, at around 50 Mt CO2.
In contrast, 2023 saw much milder winter conditions compared to 2022 in
countries with large energy demand for heating, notably the United States and the
People’s Republic of China (hereinafter China). This significantly reduced energy
demand for heating, saving emissions equivalent to 170 Mt CO2. Globally,
considering the net effects of moderately higher energy demand for cooling and 0. Y 4. PAGE | 7 IEA. CC B CO2 Emissions in 2023
much lower energy demand for heating, temperatures reduced emissions by around 120 Mt CO2 in 2023.
Figure 5: Impact of temperature variations between 2022 and 2023 on CO2 emissions in selected regions 50 O₂ t C M 0 -50 -100 -150 -200 World United China Russia European Japan India C & S States Union and Korea America Cooling degree days Heating degree days Combined effect on emissions IEA. CC BY 4.0.
Note: C & S America refers to Central and South America. Precipitation
Global hydropower capacity increased by around 20 GW in 2023. Despite this
increase, the global generation of hydropower saw a record decline in 2023. This
was primarily driven by severe and prolonged droughts that impacted major
hydropower regions, exacerbated by the influence of El Niño.
Had the availability of the hydropower plant fleet in 2023 remained consistent with
2022 levels, an additional 200 TWh of electricity would have been generated
globally. This would have avoided the emission of around 170 million Mt CO2 from
fossil fuel-based power plants. It would also have meant that electricity sector
emissions would have fallen globally in 2023, instead of rising moderately.
China experienced a challenging period of 12 consecutive months of below-
average rainfall from the middle of 2022 to the middle of 2023; the deficit was
particularly severe during the second half of 2022. Even as rainfall gradually
recovered over the course of 2023, additional water inflow was primarily utilised
to refil hydro reservoirs rather than for electricity production. This meant that
although the worst of the precipitation deficit was seen in the second half of 2022,
the impact on hydropower output was only seen in 2023. In 2023, China’s
hydropower generation fell around 4.9%, the worst decline in the last twenty years. 0.
China’s hydropower generation would have been 125 TWh higher in 2023 if its Y 4. PAGE | 8 IEA. CC B CO2 Emissions in 2023
hydropower fleet availability had been the same as in 2022. China's hydropower
shortfall accounted for nearly two-thirds of the global deficit in hydropower generation in 2023.
Southeast Asia and India grappled with warm and dry conditions throughout 2023,
a probable consequence of the simultaneous occurrence of El Niño and the
positive phase of the Indian Ocean Dipole - the Indian Ocean's counterpart to El
Niño – in the second part of the year. India experienced a weakened monsoon
season, with August the driest in at least 45 years.
North America also faced significant drought conditions. The influence of El Niño
brought about warmer and drier conditions in Canada and the North-West of the
United States, where half of the national hydropower capacity is situated.
Additionally, unusually warm temperatures in spring accelerated snowmelt in
these regions, resulting in a considerable depletion of hydropower resources. As
a result, much of Canada grappled with drought conditions, with British Columbia,
the second-largest hydropower province in the country, particularly hard-hit by
severe drought. In Mexico, severe and prolonged droughts led to a hydro
generation shortfall of almost 50% compared to 2022.
In contrast to other regions, 2023 proved to be a robust year for hydropower
electricity generation in Europe. The hydropower sector recovered from the
drought experienced in 2022, with the water level of hydropower reservoirs back
to historical averages in key regions. This recovery enabled European hydropower
plants to produce around 45 TWh more electricity compared to 2022.
Figure 6: Change in hydropower output by major region in 2023 versus 2022 180 12% 60 12% h TW 120 8% 40 8% 60 4% 20 4% 0 0% 0 0% -60 -4% -20 -4% -120 -8% -40 -8% -180 -12% -60 -12% -240 -16% -80 -16% World China North India Southeast C & S Europe America Asia America
Change in hydro power output (left axis)
Percentage change in hydro power output (right axis) IEA. CC BY 4.0.
Notes: C & S America refers to Central and South America. Changes in hydropower outputs are calculated assuming that
the availability of the hydropower plant fleet in each region remained consistent with 2022 levels throughout 2023 and take
into account capacity additions in 2023. 0. Y 4. PAGE | 9 IEA. CC B CO2 Emissions in 2023
Reopening in China and continued reopening in global aviation
The effects of Covid-19 on the energy sector are stil unwinding, and this process
of cyclical recovery back to pre-pandemic levels of transport activity played an
important role in driving up emissions in 2023. This is evident in the global aviation
sector and in China’s road passenger transport sector.
Total global aviation traffic, measured in revenue passenger kilometres (RPKs),
soared by more than 35% in 2023 compared to 2022. Despite this increase, global
aviation traffic was still around 6% lower than the pre-pandemic level, due to the
persistence of lower levels of international travel. This continued cyclical recovery
of global aviation demand resulted in around 140 Mt of extra emissions in 2023.
China relaxed its stringent lockdowns at the beginning of 2023, which led to a
huge rebound in passenger transport demand. Highway passenger kilometres
surged by around 50% compared to 2022, although they remained substantially
below the 2019 level. Total gasoline consumption rose by around 10% in China in
2023 compared to 2022. In contrast to passenger transport, road freight transport
activity levels were never as affected by the Covid-19 lockdowns compared to
passenger transport. Considering therefore the cyclical recovery of road
passenger transport, the reopening in China accounted for around 50 Mt of additional emissions.
Weaker industrial output in advanced economies
In 2022, as the world reeled from the effects of the energy shock, the decrease in
energy-intensive industrial production contributed significantly to avoiding
emissions. In 2023, this effect was more muted. The output of key energy-
intensive goods declined modestly in advanced economies in the aggregate,
although there were dif erences depending on the industrial commodity and
regions. We estimate that this pushed down emissions by around 25 Mt. 0. Y 4. PAGE | 10 IEA. CC B CO2 Emissions in 2023
Emissions in advanced economies fel to
their level of 50 years ago
Advanced economies saw a record decline in their emissions …
After falling by around 4.5% in 2023, emissions in advanced economies were
lower than they were fifty years ago in 1973. Although emissions in this group of
countries have plumbed similar lows in 2020, 1974-75 and 1982-83, there are two
important differences. Firstly, in contrast with the previous temporary declines in
1974-75 and 1982-83, advanced economy emissions have been in a structural
decline since 2007. Secondly, advanced economy GDP expanded by around
1.7% in 2023, compared to stagnation or outright recession in these other periods.
The decline in 2023 therefore represents the largest percentage drop in advanced
economy emissions outside of a recessionary period.
Figure 7: CO₂ emissions from combustion in advanced economies, 1973-2023 14 O₂ Gt C 12 10 8 6 1973 1983 1993 2003 2013 2023 IEA. CC BY 4.0.
… with coal demand back to around its 1900 level…
Nearly two-thirds of the decline in emissions from advanced economies in 2023
occurred in the electricity sector. For the first time in history, electricity generation
from renewables and nuclear reached 50% of total generation in advanced
economies, with renewables alone accounting for an unprecedented 34% share.
Conversely, coal’s share plummeted to an historic low of 17%.
This transformation in the electricity sector has pushed advanced economy coal
demand back to a level that had not been seen – outside of briefly in the Great 0.
Depression – since around 1900. Since its peak in 2007, coal demand has nearly Y 4. PAGE | 11 IEA. CC B CO2 Emissions in 2023
halved. This reduction was driven by the remarkable increase in the share of
renewables, which more than doubled from 16% to 34% of electricity generation
during this period. Additionally, there has been significant coal-to-gas switching,
with the share of natural gas in electricity generation rising from 22% to 31%.
Figure 8: Energy supply from coal in advanced economies, 1905-2023 50 EJ 40 30 20 10 1905 1920 1935 1950 1965 1980 1995 2010 2023 IEA. CC BY 4.0.
Note: IEA analysis with data from 1900 to 1971 estimated using I ASA PFU database.
…on the back of a clean energy boom, but also mild
weather and somewhat weaker industrial production European Union
Total CO2 emissions from energy combustion in the European Union declined by
almost 9% in 2023 (-220 Mt). While this reduction is of similar magnitude to the
decline observed in 2020 during the Covid-19 pandemic, the context in 2023
differs significantly, with the European Union experiencing – admit edly weak –
economic growth of around 0.7%. Clean energy growth accounted for half of the
decline in emissions in 2023, and was the largest driver.
The primary driver behind this decline was the deployment of renewables in the
electricity sector. For the first time, wind power surpassed both natural gas and
coal in electricity generation, marking an historic milestone for the energy
transition in the region. Electricity production from coal dropped by 27% in 2023,
while natural gas-based electricity generation declined by 15%. The recovery of
hydroelectric power from the droughts of 2022 and a partial recovery in nuclear
power also played a role in reducing the reliance on fossil fuels in the power sector.
Nuclear power saw an historic fall in 2022 in the European Union, due to forced
maintenance outages. Several of the reactors taken offline in 2022 were gradually 0.Y 4. PAGE | 12 IEA. CC B CO2 Emissions in 2023
reconnected to the grid in the first part of 2023, and Covid-19 related maintenance
delays began to subside. However, the nuclear power fleet availability did not
recover back to its 2021 level. If the EU’s nuclear fleet availability had achieved
the 2021 level, an additional 70 TWh would have been generated, despite capacity
retirements in some countries. This would have resulted in a further reduction of 40 Mt CO2.
High energy prices, interest rates, weak domestic demand and strong international
competition pushed down industrial production in the European Union. Reductions
in the industry sector account for around 30 percent of the total annual decrease
in emissions. However, the percentage fall in industry CO2 was substantially larger
than the fall in value added, and larger than the decline in the output of heavy
industry goods. This indicates that beyond output declines, energy efficiency and
fuel-switching played a role in reducing emissions for the industry sector in the European Union.
A mild winter in 2023 lowered energy demand in the residential and services
sectors. However, the 2022 winter was already mild. Temperature variations
therefore played a marginal role in emissions reduction in the region.
Some of the tensions on European energy markets receded in 2023, resulting in
a decrease in wholesale energy prices from the record highs observed in 2022.
However, retail energy prices continued to rise in 2023 following the lifting of some
of the financial support mechanisms implemented in 2022; this ef ect likely
contributed to some of the decline in residential energy demand.
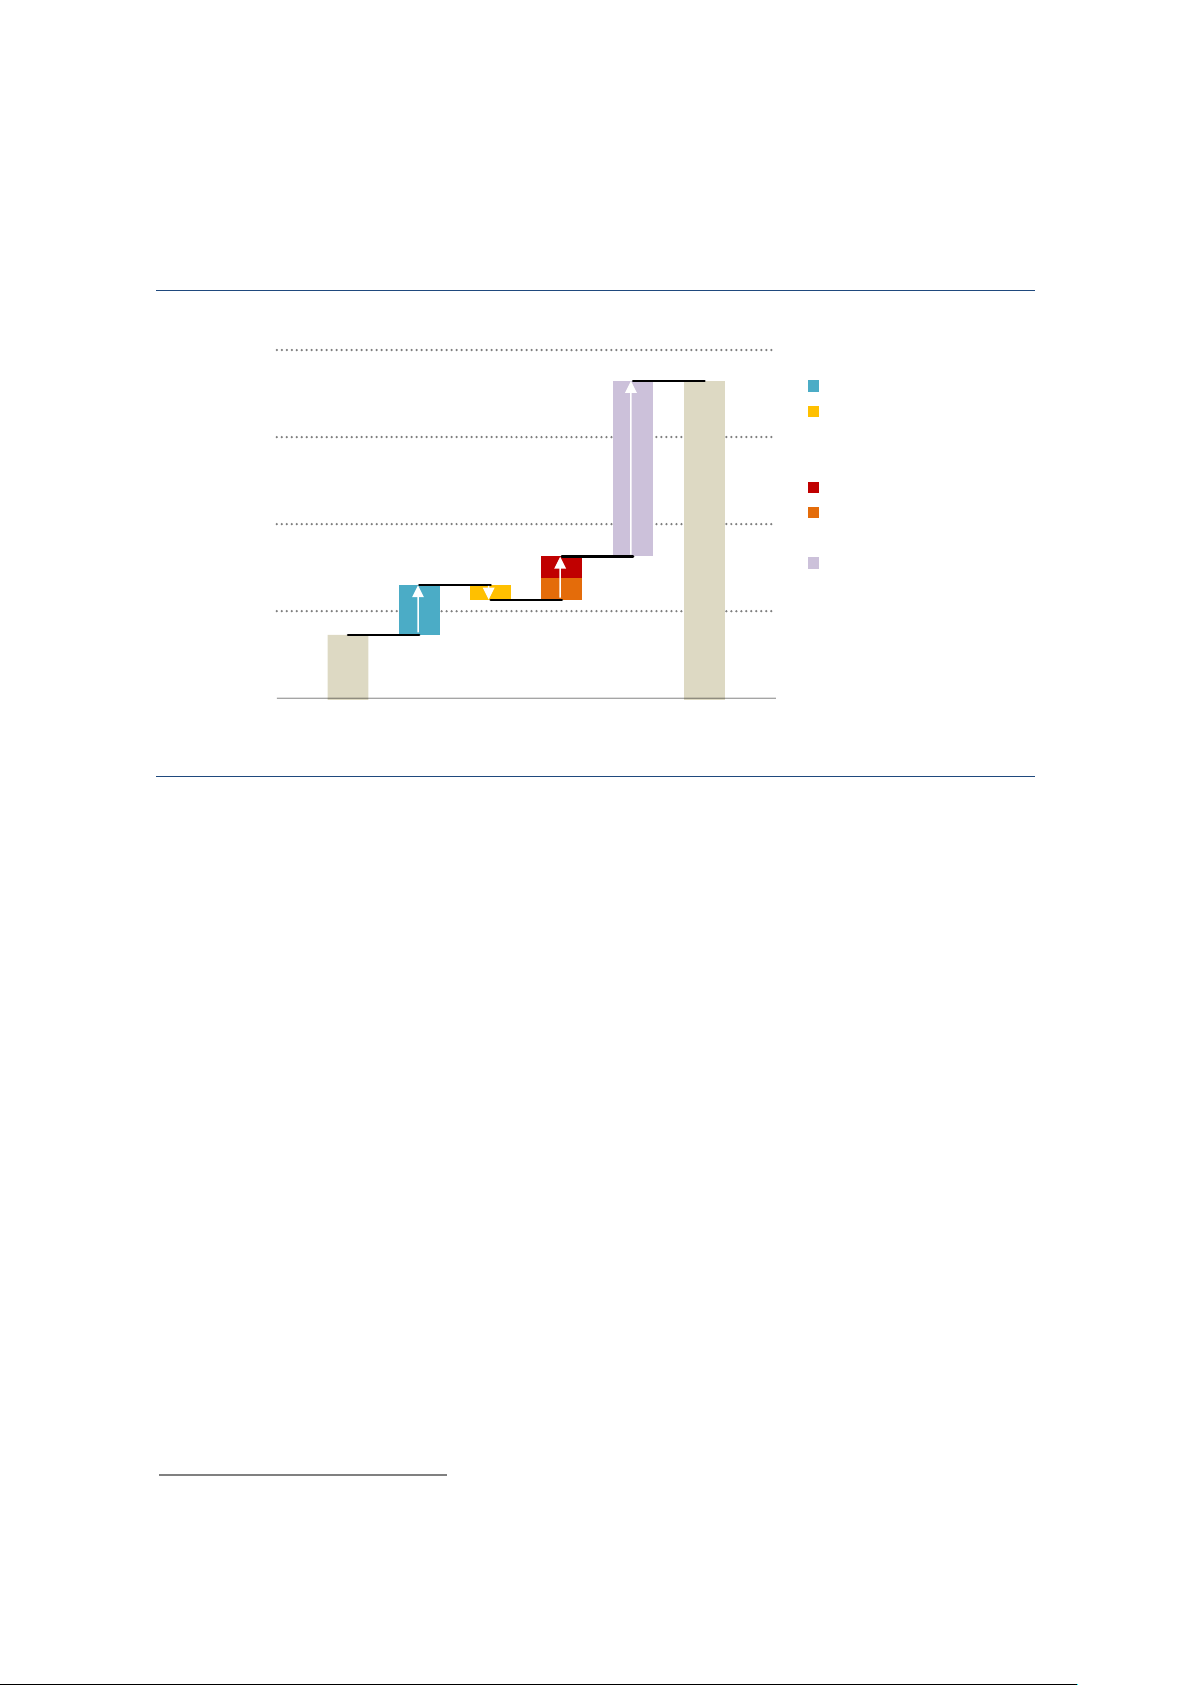
Figure 9: Change in total CO2 emissions from combustion in the European Union by driver, 2022-2023 2 550 GDP CO₂ Temperatures Mt 2 500 Hydro recovery Nuclear partial recovery 2 450
Renewable electricity deployment 2 400 Lower emissions in industry Other 2 350 2 300 2 250 2022 2023 IEA. CC BY 4.0. 0. Y 4. PAGE | 13 IEA. CC B CO2 Emissions in 2023 United States
Total CO2 emissions from energy combustion in the United States declined by
4.1% (-190 Mt), while the economy grew by 2.5%. Two-thirds of the emissions
reduction came from the electricity sector.
The United States experienced a substantial shortfall in hydropower generation in
2023, which fell around 6% or 15 TWh. The United States also experienced a
shortfall in wind power generation. In 2022, favourable wind conditions prevailed
in key regions for wind generation across the United States. However, in 2023,
partly due to El Niño, average daily wind speeds in these regions plummeted to
their lowest levels of the decade. If wind conditions had been the same as 2022,
16 Mt CO2 would have been avoided in the United States in 2023.
Despite the hydro and wind shortfalls that impacted the United States, renewables
in the electricity sector reduced emissions by around 20 Mt. If poor wind conditions
and poor hydro conditions had not occurred, the deployment of renewables would
have reduced emissions by around 40 Mt.
Coal-to-gas switching was the largest driver behind emissions reduction in the US
electricity sector. This shift was driven by advantageous gas prices compared to
coal since 2022, combined with the ongoing retirement of coal-fired power plants.
While electricity generated from coal decreased by almost 20% in 2023, electricity
generated from natural gas grew by 6%.
The mild winter experienced in the United States in 2023 was also a driver behind
emissions reduction in the country. Milder temperatures compared to 2022 led to
a notable decrease in electricity and fossil fuel demand in the residential and
services sectors, contributing to 35% of the total emissions reductions from the
energy sector in the United States.
Figure 10: Change in CO2 emissions from electricity generation in the United States by driver, 2022-2023 1 600 GDP CO₂ Temperatures Mt 1 550 Other demand effects Coal to gas switch Renewables development 1 500 Poor wind conditions Hydro shortfal 1 450 1 400 1 350 2022 2023 IEA. CC BY 4.0. 0. Y 4. PAGE | 14 IEA. CC B CO2 Emissions in 2023
Energy-intensive economic growth,
compounded by unfavourable weather,
pushed emissions up in China and India
The economic recovery has been energy-intensive, particularly in China
Both China and India have experienced robust economic growth in recent years,
considering the impacts of pandemic lockdowns in both countries and the property
sector disruption in China. From 2019 to 2023, GDP growth averaged 4.6% in
China and 4.1% in India. In 2023, the two countries registered 5.2% and 6.7% GDP growth respectively.
However, in both countries - but especially in China - the economic recovery
during the period impacted by the Covid-19 pandemic has been quite energy-
intensive. In the decade to 2019, China saw energy intensity improvements of
around 3.3% per year, while India achieved improvements of around 2.8% per
year. Both countries, however, experienced a slowdown in energy intensity
improvements after the pandemic, and China even saw a deterioration of its energy intensity in 2023.
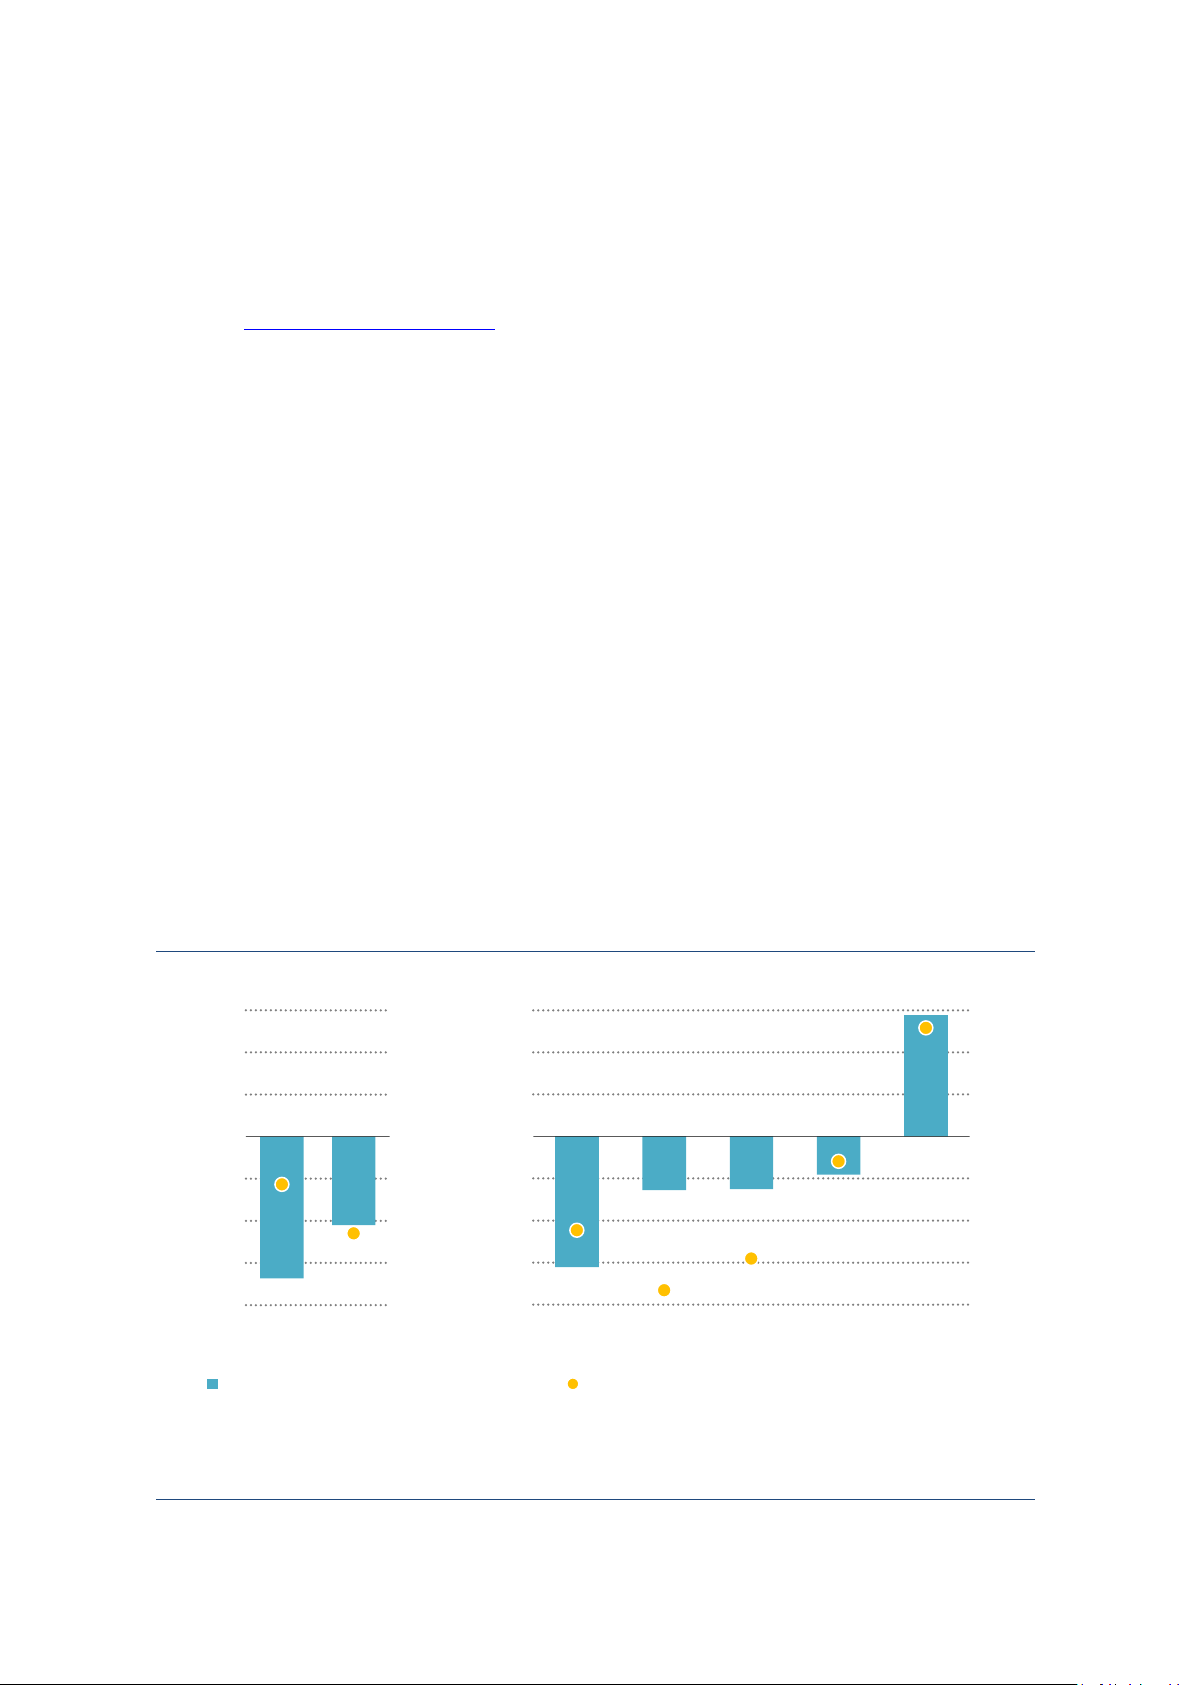
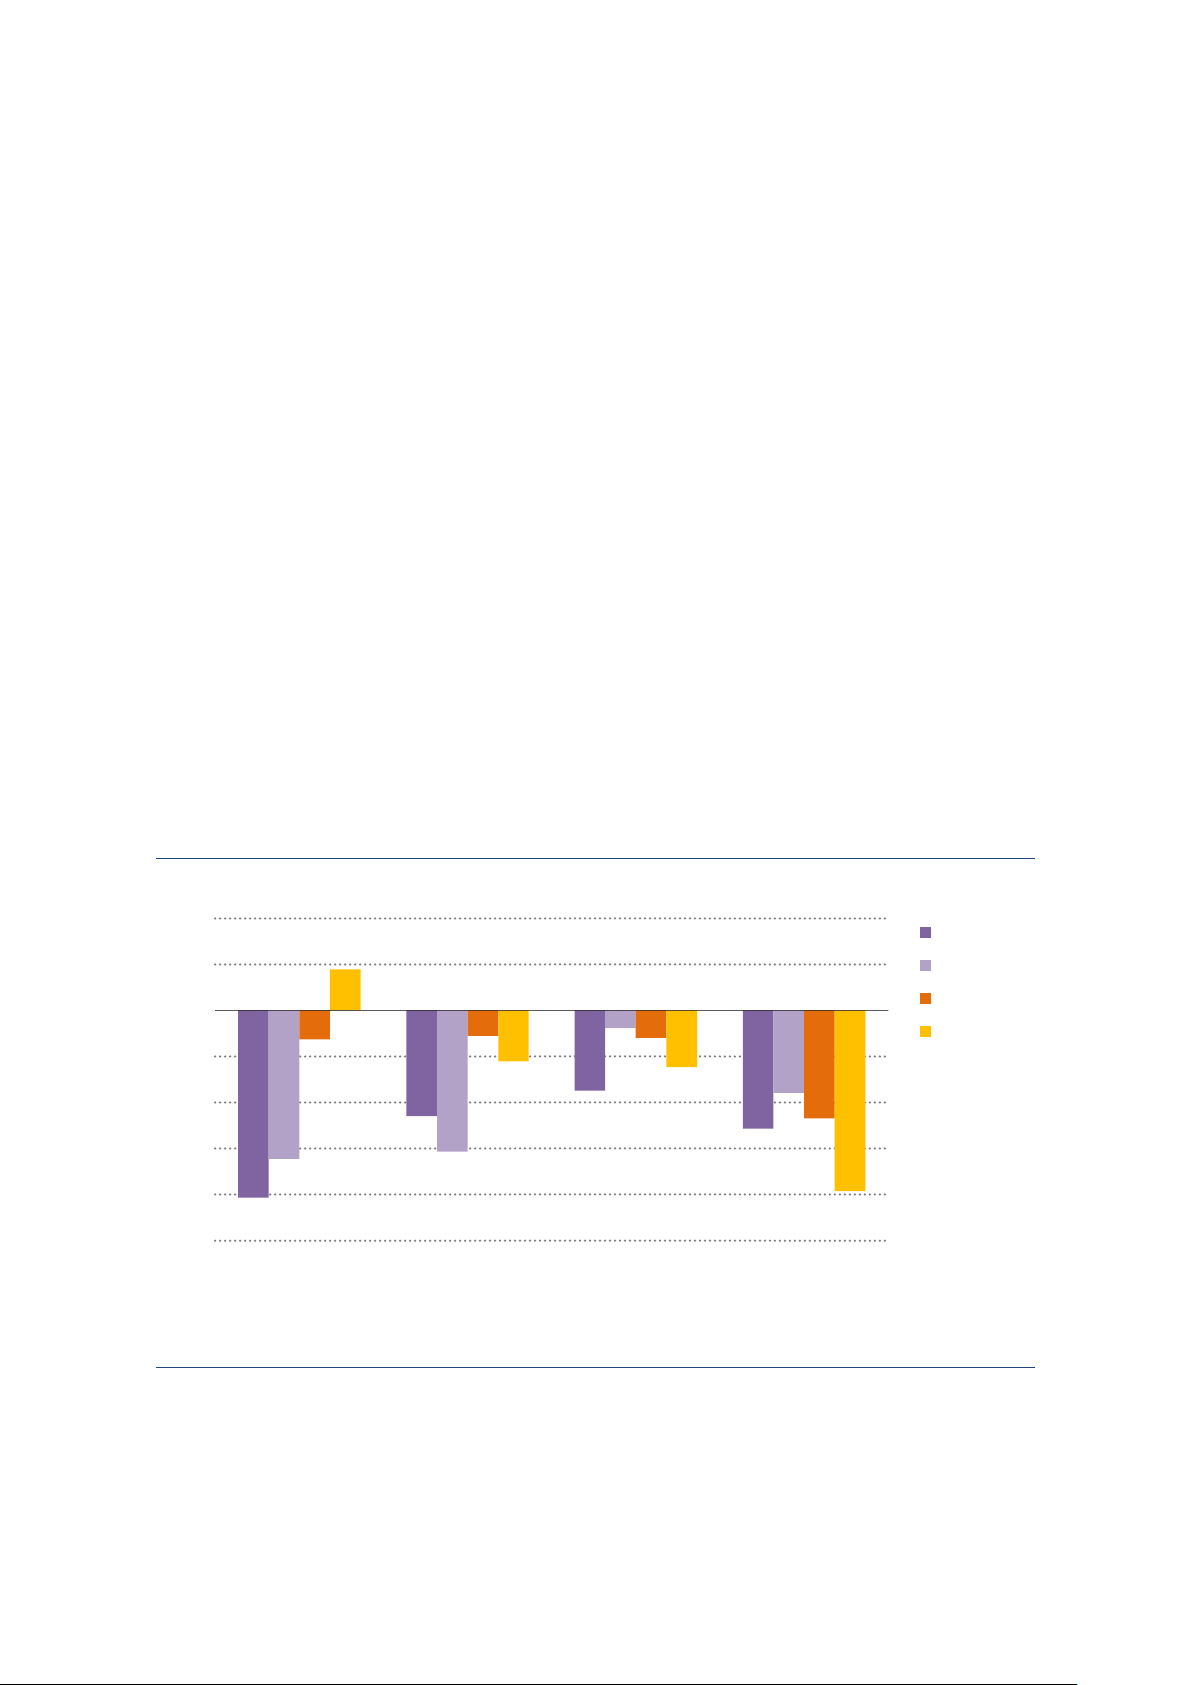
Figure 11: Average annual rate of energy intensity improvement by economic region 2% 2010-15 1% 2015-19 0% 2019-22 2022-23 -1% -2% -3% -4% -5% China India Other EMDE Advanced economies IEA. CC BY 4.0.
Notes: EMDE = emerging market and developing economies.
Yearly variations in energy intensity need to be analysed with caution, as one-off
effects, including weather, can play an important role. However, the broader,
multiyear slowdown in energy intensity improvements is clear. A key driver in this 0. Y 4. PAGE | 15 IEA. CC B CO2 Emissions in 2023
trend appears to be the structure of economic growth in both countries after the
pandemic. In China, the share of investment and net exports - both more energy-
intensive than household consumption - in GDP growth increased from slightly
more than 40% in the period 2015-19 to 45% in the period 2019-23. Continued
investment in infrastructure, manufacturing capacity and real-estate has been a
major driver of Chinese growth, pushing up energy intensity. In the case of India,
the share of investment in GDP growth increased from around 35% from 2015-19
to nearly 50% in the period 2019-23, as the government has pushed investment
in much-needed infrastructure to compensate for relatively weaker consumption growth.
Bad hydro and economic reopening pushed up the
increase in China’s emissions
China’s CO2 emissions grew 565 Mt in 2023 to reach 12.6 Gt. This represents an
increase of 4.7%, as emissions from energy combustion increased 5.2% while
those from industrial processes stayed broadly stable. This occurred despite
China’s overwhelming lead in the global clean energy economy. In 2023, China
contributed around 60% of the global additions of solar PV, wind power and
electric vehicles. From 4% in 2015, the share of solar PV and wind in total
electricity generation reached 15% in 2023, close to the level of advanced
economies (17%). China’s share of EVs in total car sales was more than double
the level of advanced economies in 2023.
However, the growth in clean energy was not sufficient to keep pace with surging
energy demand, which increased by around 6.1% - a percentage point more than
GDP. Since the pandemic, China’s GDP growth has been driven by energy-
intensive sectors: from 2015 to 2019, services value added accounted for
two‑thirds of GDP growth; from 2019 to 2023, that fell to around half. Fixed asset
investment in infrastructure and manufacturing capacity grew on average 7.1%
and 6.4% in 2023, above the rate of GDP growth; and although investment in new
real estate projects fell, 2023 construction activity was higher than in 2022 as
developers worked to clear a large backlog of already started projects. According
to data from China’s National Bureau of Statistics, total floorspace completed was
4% above the 2019 level in 2023, and 16% above the 2022 level, even as new
floorspace started was 30% below 2022 and 60% below 2019 levels.
Alongside these structural drivers, China’s emissions were also pushed up by
cyclical factors. After the reopening from Covid-19 lockdowns, highway passenger
kilometres increased nearly 50% and aviation passenger kilometres by more than
160% in 2023. However, they both remain below the 2019 level. This cyclical
recovery pushed up China’s emissions by around 100 Mt. The shortfall of
hydropower generation pushed up emissions by a further 115 Mt. Milder weather 0. Y 4. PAGE | 16 IEA. CC B CO2 Emissions in 2023
reduced both heating and cooling demand, pushing down emissions by around
35 Mt. Taken all together, clearly identifiable cyclical factors accounted for around
one-third of China’s emissions growth.2
Figure 12: Change in CO2 emissions in China by driver, 2022-2023 12 800 CO₂ Weather impact Hydro shortfal Mt Temperatures 12 600 Post Covid-19 reopening Road transport 12 400 Aviation Activity increase 12 200 12 000 2022 2023 IEA. CC BY 4.0.
A poor monsoon drives up India’s emissions
India’s economy saw rapid growth in 2023, expanding by 6.7%. The country’s
emissions grew faster than GDP, at slightly more than 7%, rising around 190 Mt
to reach 2.8 Gt. However, India’s per capita emissions remain very low, at around
2 tonnes, less than half the world average of 4.6 tonnes. The large increase in
India’s total emissions was driven by the continued rapid recovery in economic
activity from the lows of the Covid-19 pandemic. Steel and cement output both
soared – in both cases faster than GDP. Electricity demand also grew rapidly.
However, closer examination of the data reveals some important cyclical drivers.
The Indian summer monsoon occurs between the months of June to September,
and sometimes into October. In 2023, electricity demand in the monsoon months
grew at four times the rate of electricity demand in the non-monsoon months, when
compared to 2022 (12% versus 3% year-on-year). The monsoon affects electricity
demand by driving up demand for agricultural pumping, with the agricultural sector
accounting for nearly one-fifth of electricity consumption. Due to a poor monsoon
in 2023, India also lost a substantial amount of hydropower output, which fell
nearly 15%, an absolute decline of around 25 TWh. Considering the impacts of a
poor monsoon on both electricity demand and hydropower supply, we estimate
2 This may somewhat understate the importance of cyclical factors, as it is dif icult with available data to disentangle the 0.
impact of the reopening on the services sector. Y 4. PAGE | 17 IEA. CC B CO2 Emissions in 2023
that it contributed nearly 60% of the increase in India’s electricity sector emissions
in 2023. In turn, the electricity sector accounted for more than half of the increase
in India’s total emissions, implying that cyclical weather-related events accounted
for around one-quarter of the total emissions increase.
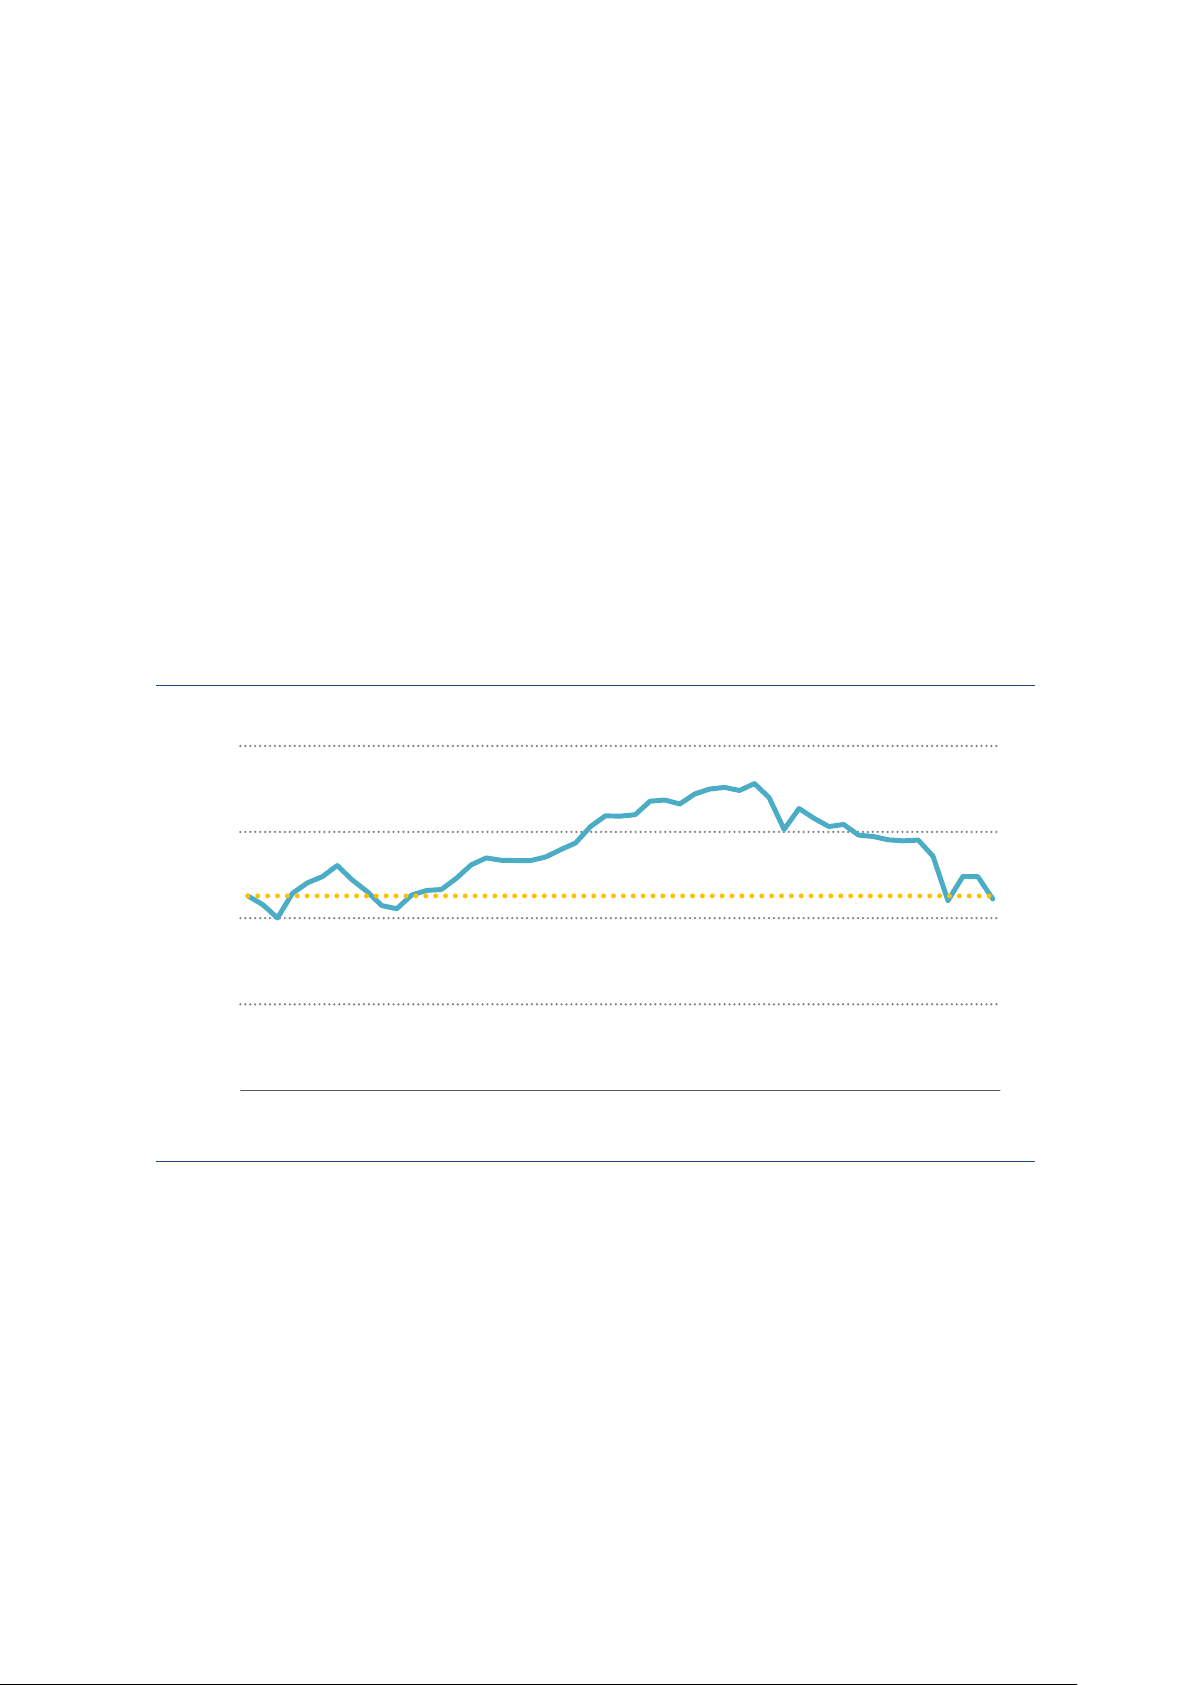
Figure 13: Impact of weak monsoon on Indian electricity demand and associated emissions, 2023
Electricity load against temperatures
Electricity generation emissions ) 225 1 325 (GW CO₂ 200 ad Mt 1 300 lo 175 1 275 e daily 150 1 250 Averag 125 1 225 100 1 200 15 20 25 30 35 2022 2023
Average daily temperature (°C) Hydro generation shortfal Other 2019 2023 2023 Aug.-Sept. Monsoon demand impact IEA. CC BY 4.0.
Coal demand in emerging market and
developing economies was the biggest driver
in global emissions growth
Coal has contributed by far the most to the increase of global CO2 emissions in
the post-pandemic era. Global emissions from energy combustion have increased
by around 850 Mt since 2019; those from coal have grown by 900 Mt, gas
emissions have increased moderately, and oil emissions are stil slightly below their 2019 level.
Coal accounted for around 70% of the increase in global emissions from energy
combustion in 2023 (+270 Mt). China and India saw substantial increases in
emissions from coal combustion, only partially offset by declines in advanced
economies. Oil emissions were pushed up by the reopening in China and in global
aviation, increasing by around 95 Mt globally. Natural gas emissions increased
only marginally at the global level. 0. Y 4. PAGE | 18 IEA. CC B CO2 Emissions in 2023
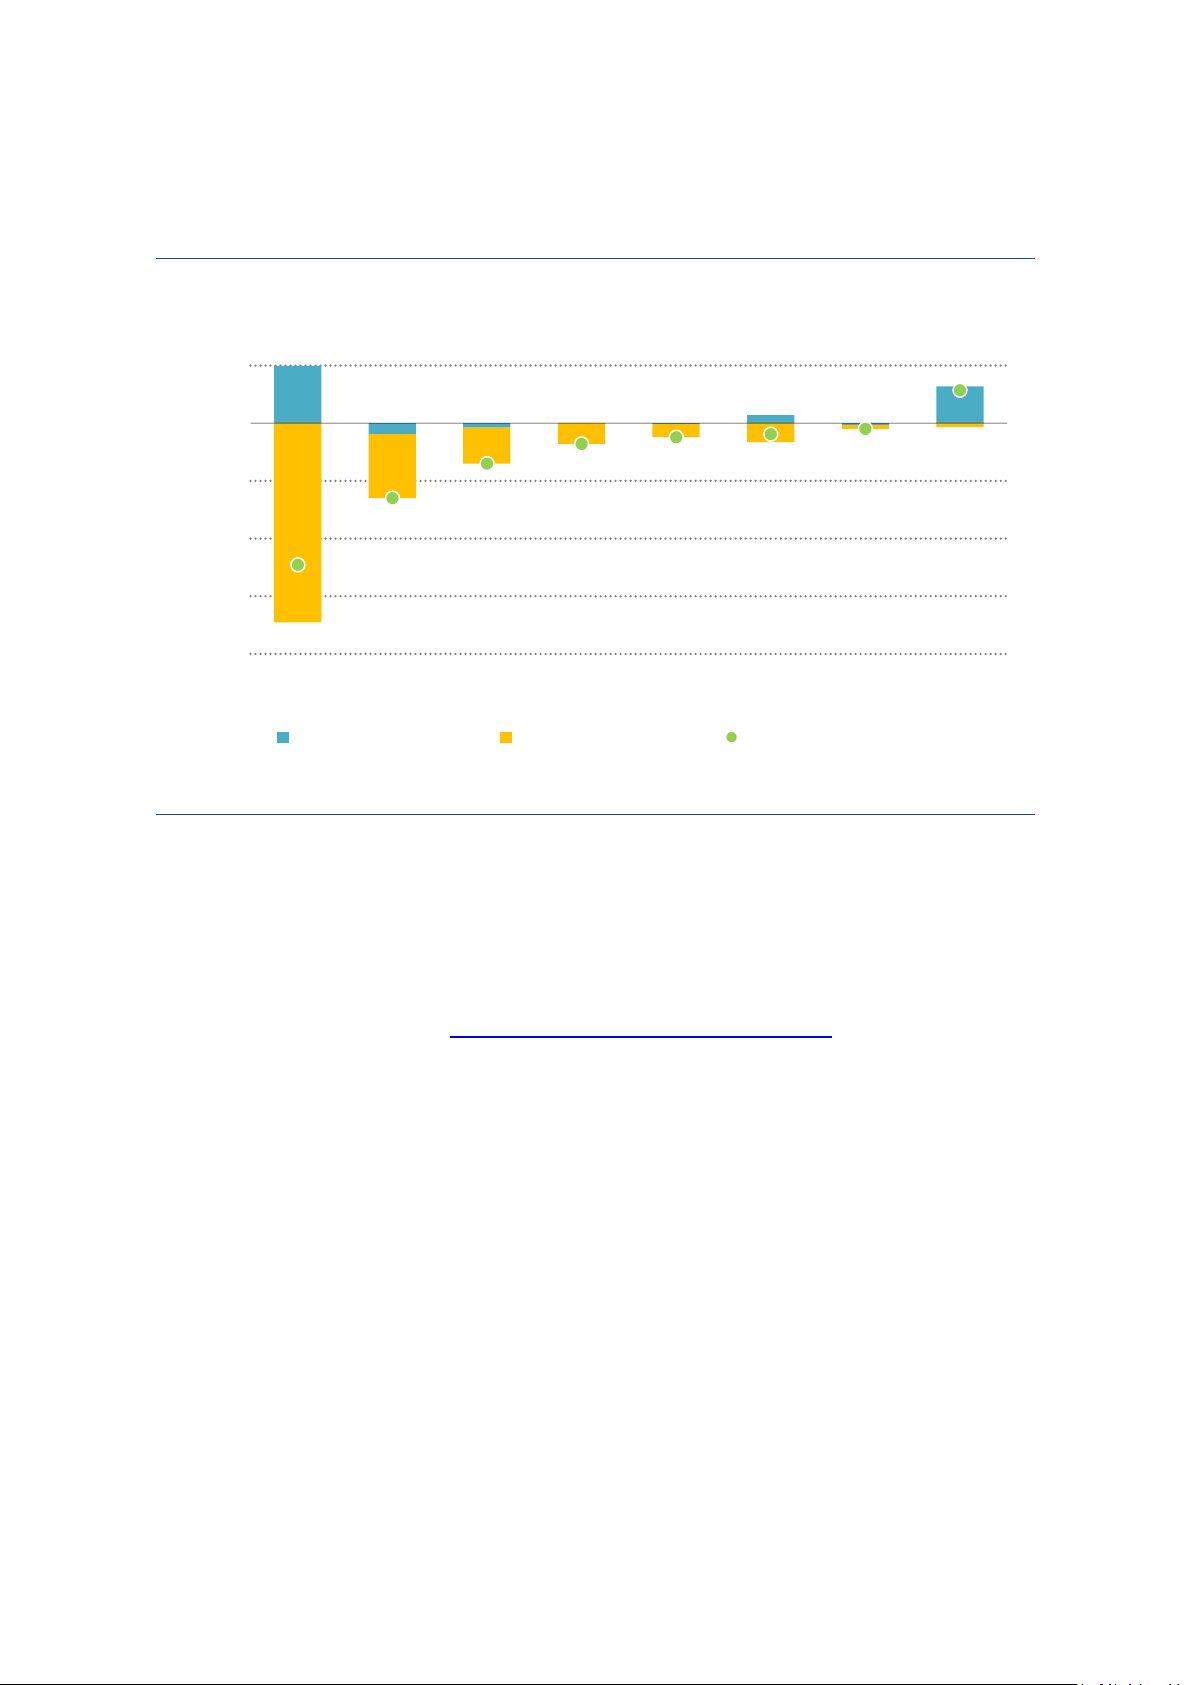
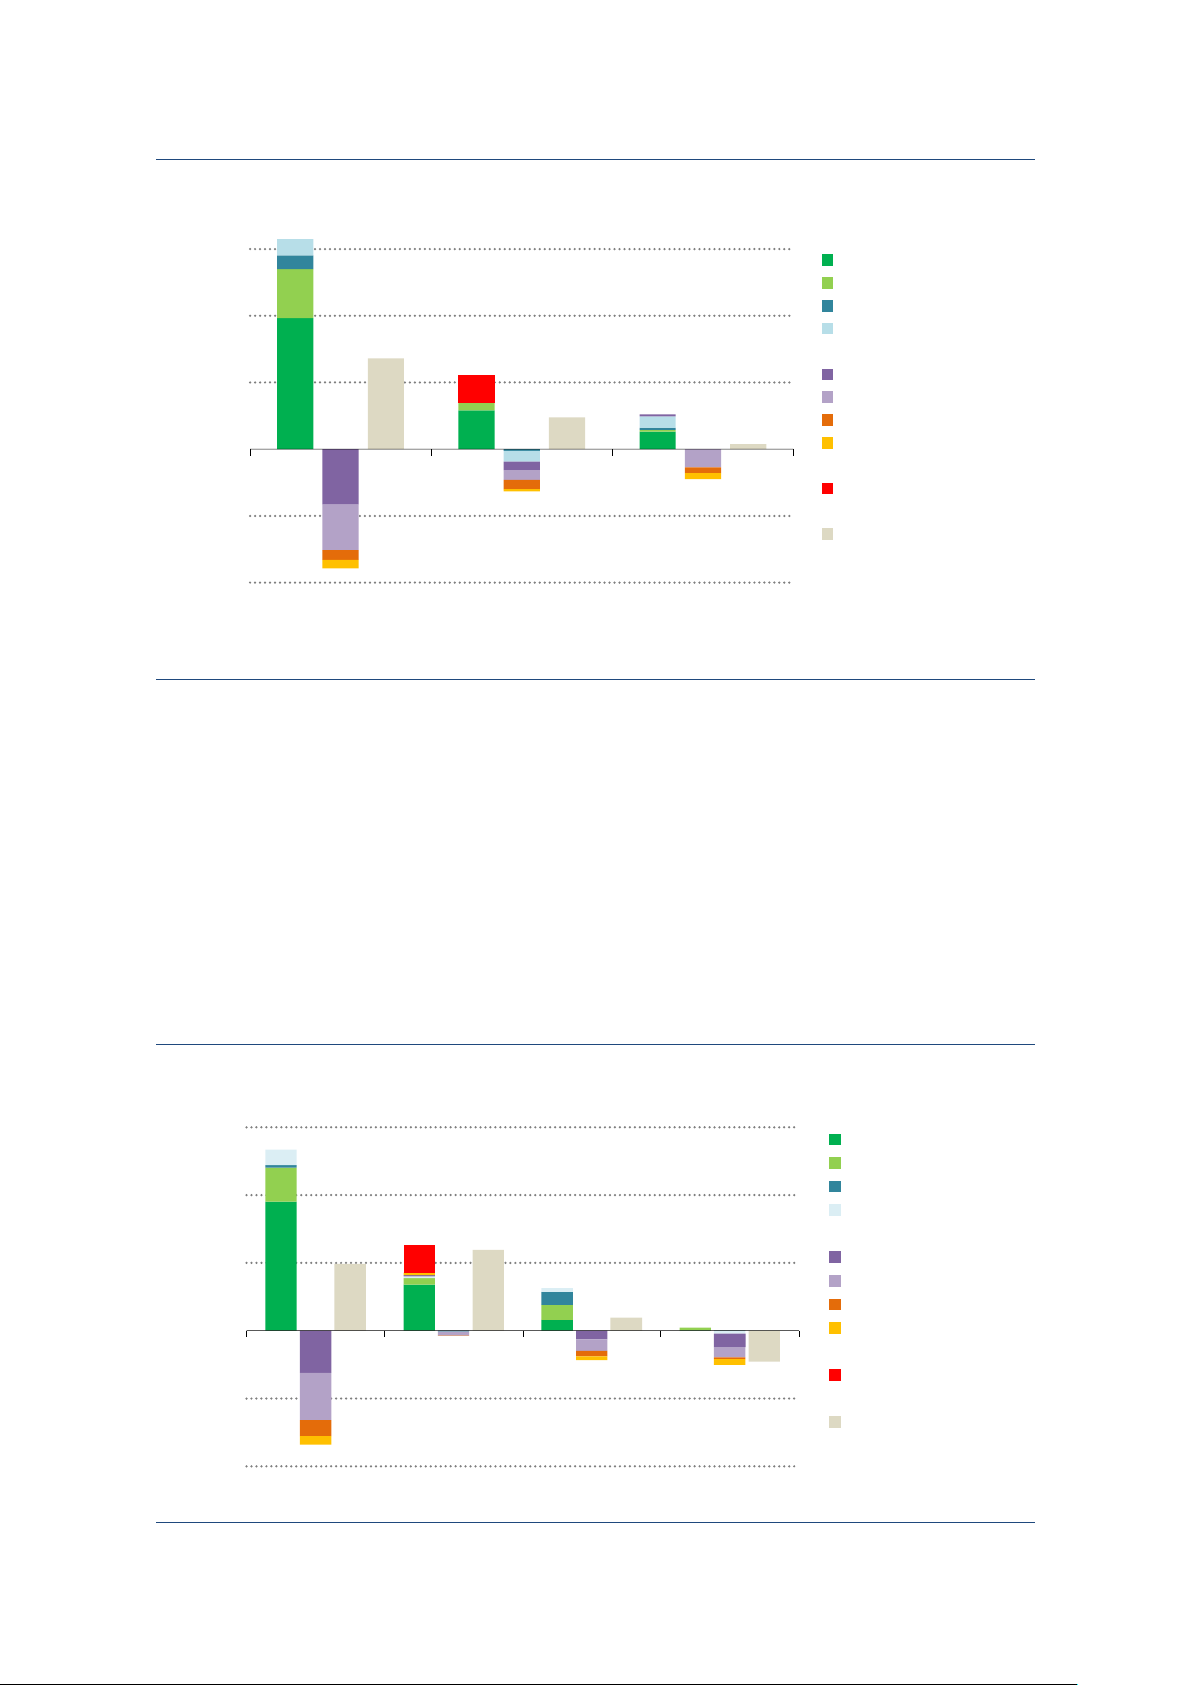
Figure 14: Change in CO2 emissions from combustion by fuel and region, 2022-2023 Coal Oil Natural gas 600 China CO₂ India Mt 400 Indonesia Rest of EMDE 200 United States European Union Japan 0 Rest of AE International bunkers -200 World -400 IEA. CC BY 4.0.
Notes: AE = advanced economies; EMDE = emerging market and developing economies. International bunkers include the
demand for fuels for international aviation and international maritime transport.
At the sector level, transport experienced the most pronounced growth in
emissions, surging by nearly 240 Mt globally. The power sector contributed the
second largest increase and shows the highest level of regional disparity, as
emissions in advanced economies collapsed while those in emerging market and
developing economies soared. Industrial emissions saw a slight uptick, as the
combination of moderately weaker industrial output, ef iciency gains, and fuel
switching in advanced economies was insufficient to counterbalance the
emissions increase from industrial development in emerging market and
developing economies. Buildings was the only sector to see emissions fall at the
global level, largely attributable to milder temperatures experienced in 2023.
Figure 15: Change in CO2 emissions from combustion by sector and region, 2022-2023 Power sector Transport Industry Buildings 600 China CO₂ India Mt 400 Indonesia Rest of EMDE 200 United States European Union Japan 0 Rest of AE International bunkers -200 World -400 IEA. CC BY 4.0. 0. Y 4. PAGE | 19 IEA. CC B CO2 Emissions in 2023
The changing landscape of global emissions
The landscape of emissions continues to change. China’s total CO2 emissions
exceeded those of the advanced economies combined in 2020, and in 2023 were
15% higher. India surpassed the European Union to become the third largest
source of global emissions in 2023. Countries in developing Asia now account for
around half of global emissions, up from around two-fifths in 2015 and around
one‑quarter in 2000. China alone accounts for 35% of global CO2 emissions.
Advanced economies continue to have relatively high per capita emissions, at
about 70% higher than the global average in 2023. India’s per capita emissions
remain less than half of the global average, at around 2 tonnes. Per capita
emissions in the European Union have fallen strongly and are now only around
15% higher than the global average and around 40% below those of China.
China’s per capita emissions exceeded those of the advanced economies as a
group in 2020 and are now 15% higher; 2023 represented the first time that they
surpassed those of Japan, although they remain one-third lower than those of the United States.
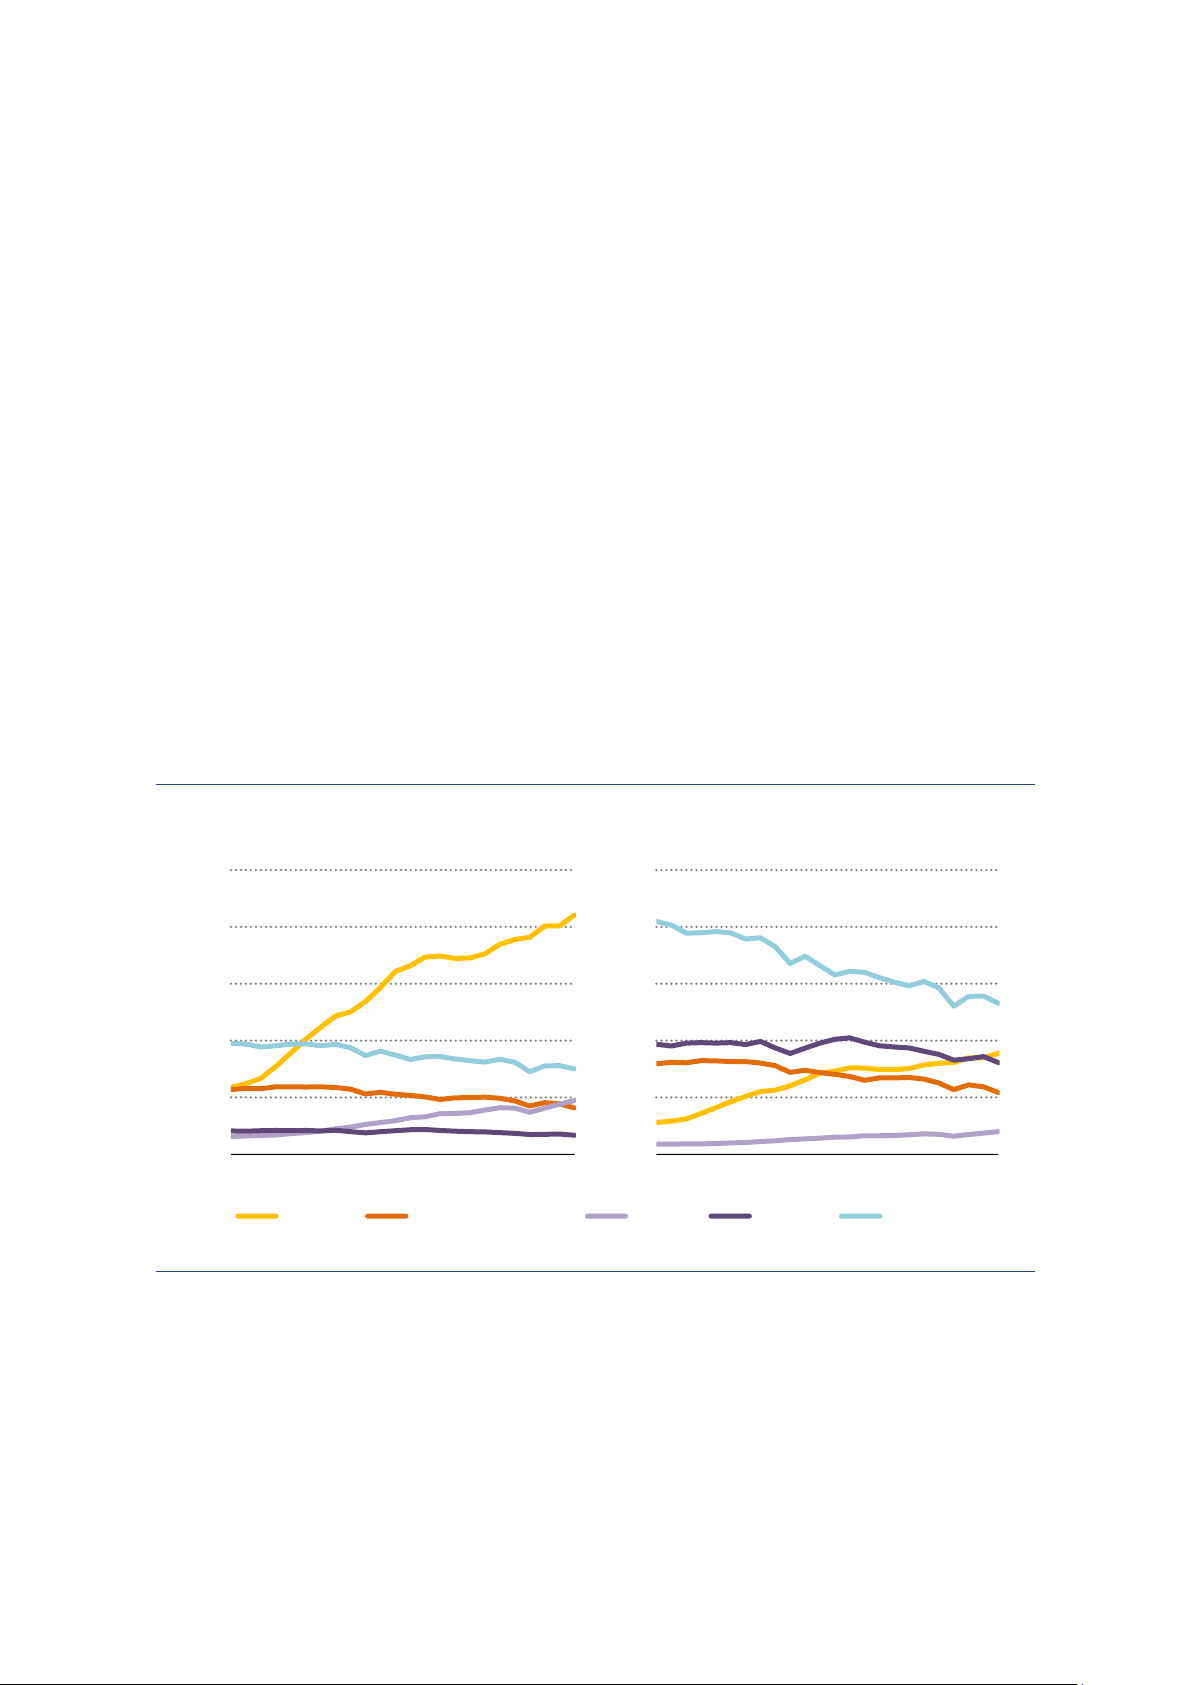
Figure 16: CO2 total and CO2 per capita by region CO₂ emissions
CO₂ emissions per capita 15 25 O₂ pita Gt C 12 20 per ca 9 15 tCO₂ 6 10 3 5 2000 2010 2023 2000 2010 2023 China European Union India Japan United States IEA. CC BY 4.0. 0. Y 4. PAGE | 20 IEA. CC B