Tài liệu về Tối ưu hóa mạng lưới nhiệt môn Vật liệu học kỹ thuật | Trường Đại học Sư phạm Kỹ thuật Vĩnh Long
Tài liệu về Tối ưu hóa mạng lưới nhiệt môn Vật liệu học kỹ thuật | Trường Đại học Sư phạm Kỹ thuật Vĩnh Long. Tài liệu được sưu tầm giúp bạn tham khảo, ôn tập và đạt kết quả cao. Mời bạn đọc đón xem.
Môn: Vật liệu học kỹ thuật 8 tài liệu
Trường: Trường Đại học Sư phạm Kỹ thuật Vĩnh Long 65 tài liệu
Tác giả:


Preview text:
IOP Conference Series: Materials Science and Engineering PAPER • OPEN ACCESS You may also like
Heat Integration and Heat Exchanger Network
- Quantum versus classical generative modelling in finance
Brian Coyle, Maxwell Henderson, Justin
Design with Aspen Energy Analyze Chan Jin Le et al.
- Accelerating the variational quantum eigensolver using parallelism
To cite this article: K R Pethe et al 2022 IOP Conf. Ser.: Mater. Sci. Eng. 1259 012006
Lana Mineh and Ashley Montanaro
- Aspen HYSYS simulation of biomass
pyrolysis for the production of methanol
M Arul, M Dinesh Kumar and Anand Ramanathan
View the article online for updates and enhancements.
This content was downloaded from IP address 192.133.28.4 on 04/10/2024 at 16:15
International Conference on Advances in Mechanical Engineering-2022 (ICAME-2022) IOP Publishing
IOP Conf. Series: Materials Science and Engineering 1259 (2022) 012006
doi:10.1088/1757-899X/1259/1/012006
Heat Integration and Heat Exchanger Network Design with Aspen Energy Analyze
K R PETHE1; P M DABHADE1; V J KOLEKAR1; M D SARDARE*
School of chemical engineering, MIT Academy of Engineering, Alandi, Pune, India
Email Id: mamtasardare@gmail.com; mdsardare@mitaoe.ac.in;
https://orcid.org/0000-0003-0205-841X
Abstract. The considerable amount of energy used in industrial processes is typically used for
heating and cooling. The synthesis of heat ex-changer networks (HEN) is a critical topic in this
industry in order to reduce energy and capital costs in chemical plants. Heating and cooling
systems in industry must be designed efficiently, which can be done using technologies like
pinch analysis to create an optimal heat recovery network. Heat pinch analysis is a systematic
method for designing thermally efficient systems. A designer can determine the minimum
heating and cooling requirements as well as the maximum heat recovery (MHR) potential by
locating a thermodynamic bottleneck, or the pinch point for heat recovery. This Paper uses Aspen
Energy Analyzer for HEN Design.
Heat integration network design is a cost-effective strategy that helps industries to cut costs by
reducing the number of external utilities needed and increase profitability by lowering energy
consumption. The HENs' composite curves, grand composite curves, grid representation, and
target reports were created using the Aspen Energy Analyzer. The software suggested ten
designs, which were then optimized based on total annualized cost. By comparing it to other
optimized designs, the best design is determined.
Key Words: Pinch technology, heat integration, HEN, pinch point, Aspen Energy Analyzer, Hint 1.Introduction
The products which are getting produced in industry or the processes which are required for crude oil to
produce fuel, requires an amount of energy and the cost of this production depends on this amount of
consumed energy in the plant. The more the amount of energy consumed in the process plant, higher the
cost for the production will be required and vice versa. So from this we got to know that the energy
consumption is important factor in any process plant. This energy consumption factor should always be
considered in any process to reduce the cost and to increase the profit of the industry. So minimization
of the energy consumption is highly important in any process plant. If we see then it is difficult to
determine the minimum amount of energy required by a process plant by using old method which do
not include pinch technology. Pinch Technology is a methodology which is used to reduce energy
consumption by establishing thermodynamically feasible energy targets (or lowest energy consumption)
and realizing them through the optimization of heat recovery systems, energy supply sources, and
process operating conditions. Process integration, heat-integration, energy-integration, and pinch
analysis are other terms for the same thing. Since pinch technology was discovered in the 1970s and
Content from this work may be used under the terms of the Creative Commons Attribution 3.0 licence. Any further distribution
of this work must maintain attribution to the author(s) and the title of the work, journal citation and DOI.
Published under licence by IOP Publishing Ltd 1
International Conference on Advances in Mechanical Engineering-2022 (ICAME-2022) IOP Publishing
IOP Conf. Series: Materials Science and Engineering 1259 (2022) 012006
doi:10.1088/1757-899X/1259/1/012006
was first used by industries in the 1980s, it is safe to assume that process plants built and designed prior
to 1980 were not subjected to pinch analysis. As a result, we can conclude that the amount of energy
required in such facilities was likely greater than the amount required.
The majority of petroleum refineries and petrochemical firms used a lot of energy. In most chemical
processing industries, this has been a major source of worry. Because the plants were developed in an
era when energy was cheap, employing traditional design energy (TDE) approaches such as mass and
energy balances, laws of thumb, sound engineering judgment, and the designers' creative talent, which
are not cost effective. Pinch analysis was not used in the construction of some refineries and
petrochemical industries prior to the 1980s. As a result, a significant amount of fuel is consumed, CO2
is released into the atmosphere, and operational costs are high. This raises severe concerns about the
need for a better process design, which is referred to as Process Integration.
1.1 Overview of the kaduna refinery and petrochemical company's crude distillation unit :
Crude oil is extracted from the earth, which contains a wide range of chemicals such as gases, water,
and dirt (Minerals). If crude oil is to be processed without fouling or corrosion in process equipment, it
must first be pretreated. Crude desalting and Field separation are two methods for pretreatment of
petroleum. The Crude Distillation Unit is part of the Kaduna Refining and Petrochemical Company’s
[3] (KRPC) Fuels department, where local crude is distilled into naphtha, gasoline, kerosene, diesel, and
bottom residue. Raw crude oil is pumped to the CDU after settling and dewatering at the tank farm. It
passes through a heat exchanger train, the desalter (for removal of salt and sediments), the pre-flash
column (for removal of lighter ends) and the crude furnace where it is heated up, then to the fractionating
column where the crude is separated into its components. The vapours are removed from the top,
condensed and sent to saturated gas concentration unit (SGCU) for further separation and production of
LPG or cooking gas while the liquids are withdrawn from the sides, based on the boiling point range. 2. Materials and Methods: 2.1 Materials:
The materials used include Pinch analysis software (Aspen Energy Analyzer), Stream data of the crude
distillation unit of Kaduna refinery and petrochemical company and Computer set. 2.2 Method:
The Aspen Energy Analyzer version 8.6 process tool was employed to perform a detailed and accurate
pinch analysis of the heat exchanger networks on the Crude distillation unit in Kaduna refinery. To do
this, the thermal data obtained from [3] the data extraction were fed as input to the software to construct
the composite curve, balanced composite curve, grand composite curve and grid representation of all
networks. The following pinch rules were employed in order to achieve the minimum energy targets for the crude preheating process.
(1) Heat must not be transferred across the pinch
(2) There must be no external cooling above the pinch and no external heating below the pinch (heaters
must be placed above and coolers below the pinch).
Violating any of these rules will lead to cross-pinch heat transfer resulting in an increase in the energy
requirement beyond the target. Any heat transfer across the pinch is excess heat which is wasted, and expressed as a pinch penalty.
2.2.1 Steps in Pinch Analysis
The pinch analysis of the industrial ammonia plant was achieved through the following steps: a) Data Extraction
This involves extraction of the data from the process flow diagram to form thermal problem table. The
data to be extracted is stated in the materials required for the work.
b) The Generation of a Thermal Data Table
The data table was formed from the extracted data by Aspen energy analyzer.
c) The application of Aspen Energy Analyzer Software Version 8.6
The extracted data were fed as input into Aspen energy analyzer [2] to complete the thermal data table. 2
International Conference on Advances in Mechanical Engineering-2022 (ICAME-2022) IOP Publishing
IOP Conf. Series: Materials Science and Engineering 1259 (2022) 012006
doi:10.1088/1757-899X/1259/1/012006
d) Analysis of the Composite Curves and Grid Diagrams to meet the Objective of the Work is
to formulate and complete the thermal data table, equation (1) was used:
𝑄 = 𝑀 ∗ 𝐶𝑝 ∗ ∆𝑇 … (1)
Where: M - mass flow rate of the stream (kg/hr)
Cp - specific heat capacity of the process streams (kJ/kg 0C)
ΔT - temperature difference between inlet temperatures and the outlet temperature of each stream (0C)
𝐶𝑃 = 𝑀 ∗ 𝐶𝑝 … (2)
Where 𝐶𝑃 is the heat capacity flow-rate and measured as enthalpy change per unit temperature difference (kJ/C-h). 3.Results and Discussions
The results of the crude distillation unit of the Kaduna refinery and petrochemical firm in Kaduna,
Nigeria, are presented in this section. Table 1 shows the stream specification and data collection for
cold and hot steams from the crude distillation unit of the Kaduna refinery and petrochemical firm in Kaduna, Nigeria.
Table 1: Stream Data of CDU unit of Kaduna Refinery Stream Mass Flow Specific Heat Supply Target Temperature HTC M.Cp (Kg/s) (KJ/kg. oC) Temperature (oC) (oC) (W/m2.0C) (KJ/oC.s) H1 48.67 2.81 319 244 45 136.7627 H2 20.13 2.2 73 40 680 44.286 H3 32.41 2.83 347 45 643 91.7203 H4 144.57 2.74 264 180 648 396.1218 H5 22.47 2.78 297 110 652 62.4666 H6 22.56 2.8 248 50 596 63.168 H7 26.41 2.2 73 40 589 58.102 H8 22.39 2.77 232 120 646 62.0203 H9 146.24 2.69 167 70 700 393.3856 H10 128.54 2.68 147 73 420 344.4872 C1 178 2.1 30 232 740 373.8 C2 170 2.79 232 343 752 474.3 C3 158.24 2.7 226 232 784 427.248 C4 170 2.82 343 398 810 479.4
3.1 Outcome of Aspen Energy Analyzer
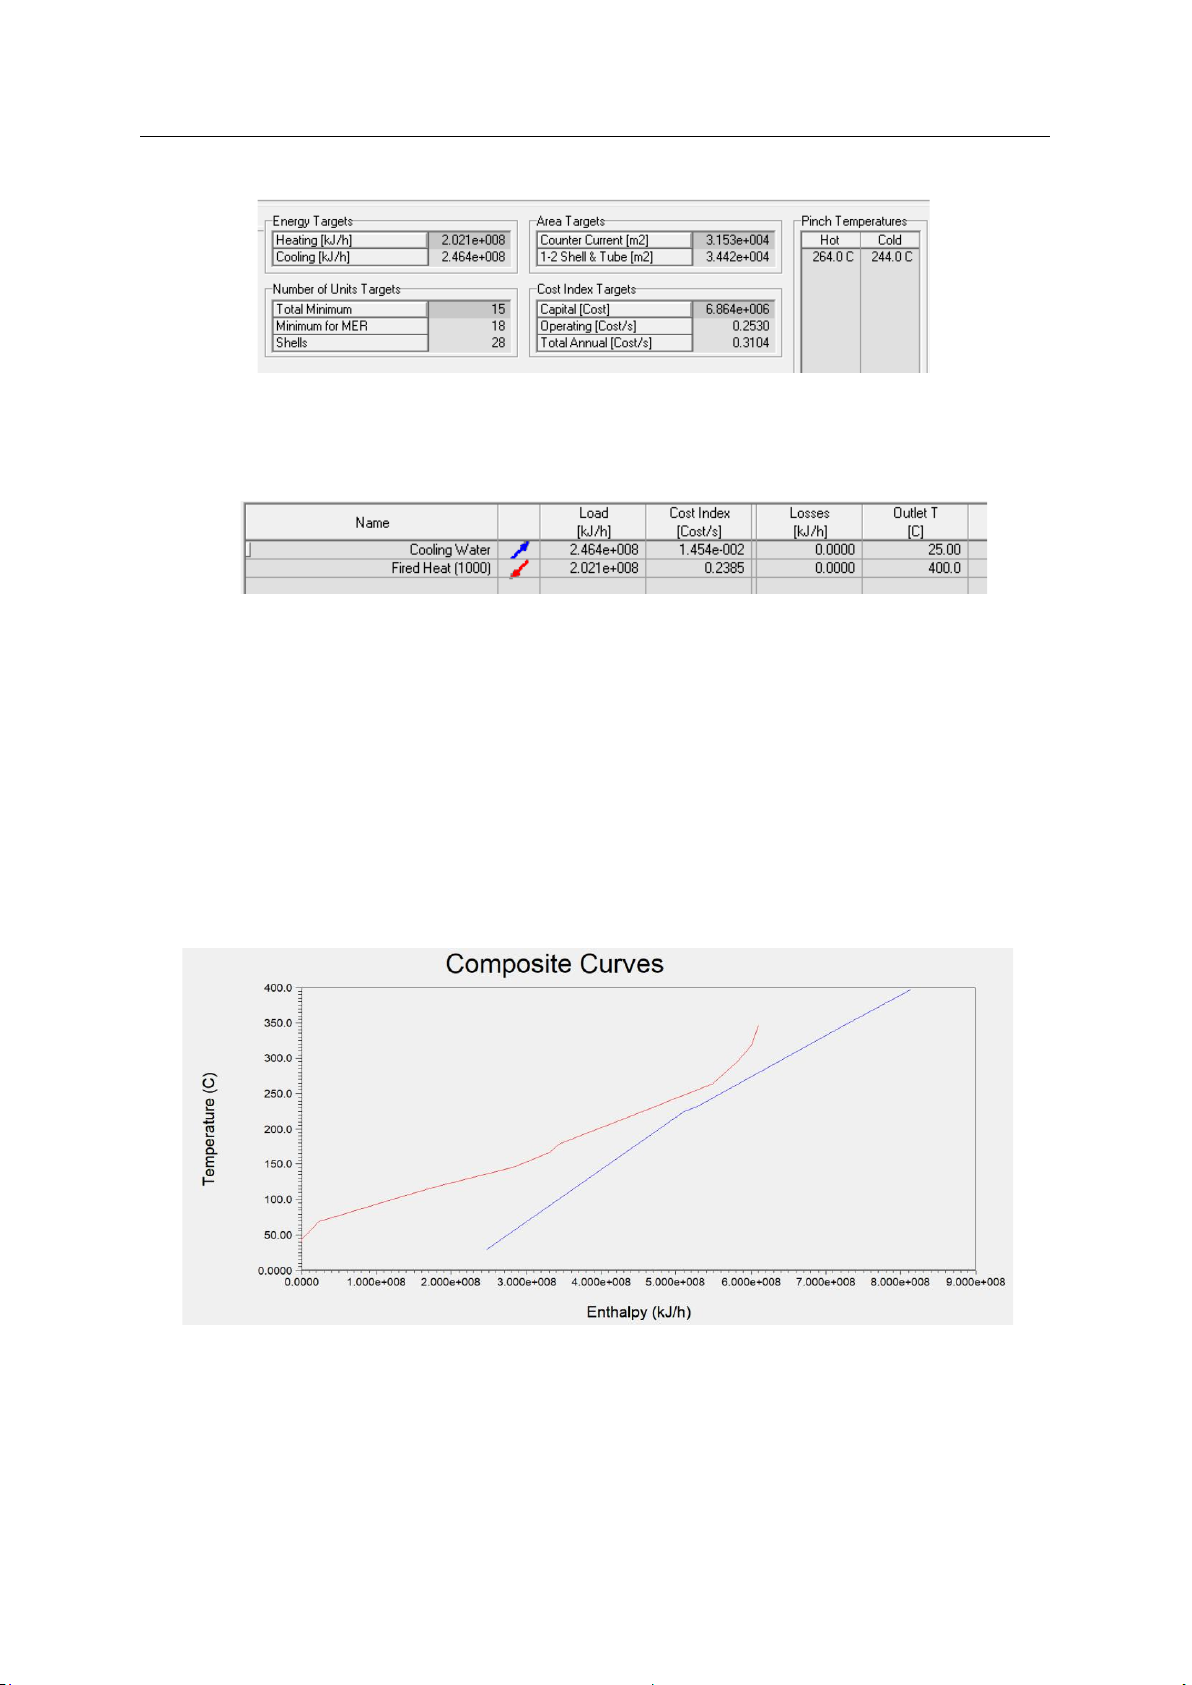
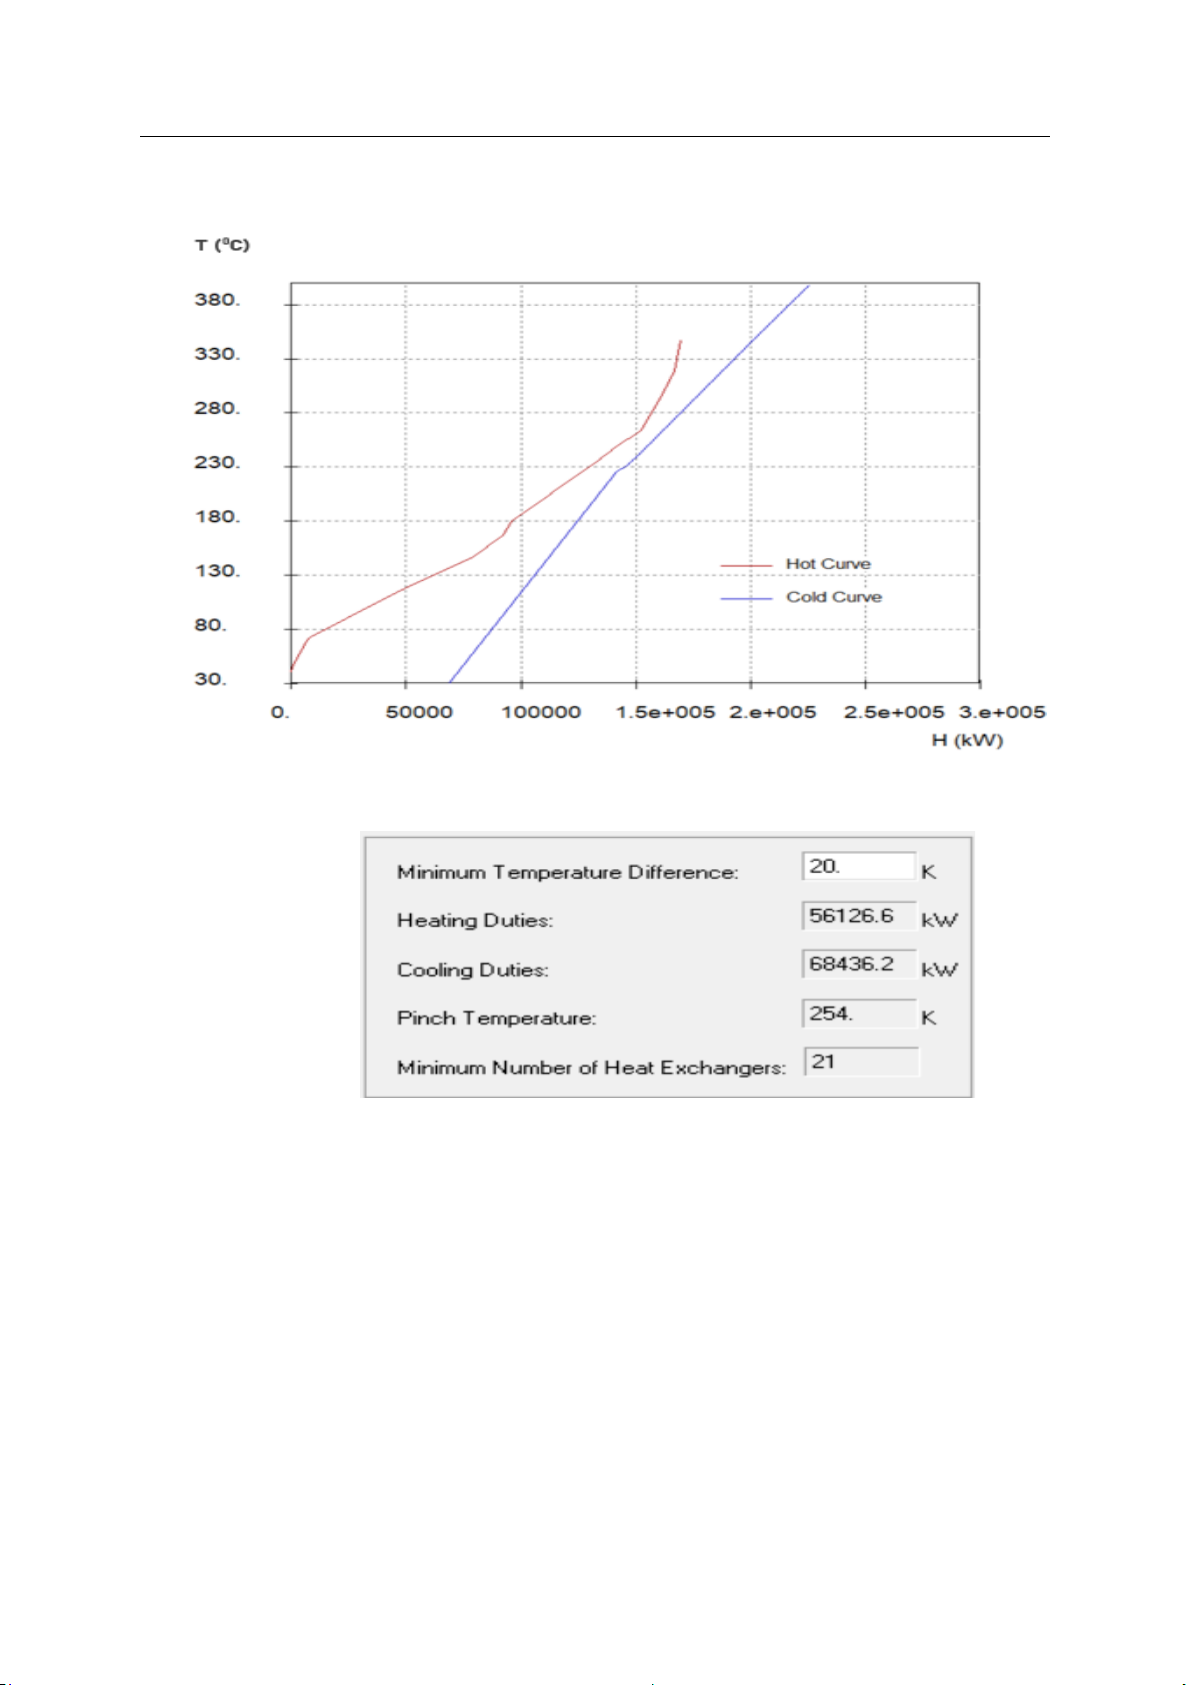
Figure 1 shows the minimum cooling and heating duty requirement, pinch temperature and area targets
for given data at ΔTmin of 20 oC. 3
International Conference on Advances in Mechanical Engineering-2022 (ICAME-2022) IOP Publishing
IOP Conf. Series: Materials Science and Engineering 1259 (2022) 012006
doi:10.1088/1757-899X/1259/1/012006
Figure 1: Results Extracted from AEA for ΔTmin=20oC
Based on the requirement utilities were added to meet heating and cooling duty; shown in Figure
Figure 2: Utility requirements 3.2 Composite curve
Figure 3 shows the composite diagram for given data the upper curve represents the hot streams (Red)
composite-curve while the lower curve represents the cold streams (Blue) composite-curve. The part of
the hot stream in composite-curve that is extended beyond the start of the cold stream, cannot be cooled
by process to process heat transfer. Therefore the minimum cooling utility of 246369976.2 kJ/h is
required. The part of the cold stream composite-curve that is extended beyond the start of the hot stream
cannot be heated by process-to-process heat transfer. Therefore the minimum hot utility of
202055718.960 kJ/h is required. The point where the two curves are closest is the pinch point and the
corresponding temperature is the pinch temperature (254 0C). Also from Figure 3 the hot pinch
temperature was found to be 264 0C and the cold pinch temperature was found to be 244 0C.
Figure 3: Composite curves at initial at ΔTmin=20oC 4
International Conference on Advances in Mechanical Engineering-2022 (ICAME-2022) IOP Publishing
IOP Conf. Series: Materials Science and Engineering 1259 (2022) 012006
doi:10.1088/1757-899X/1259/1/012006
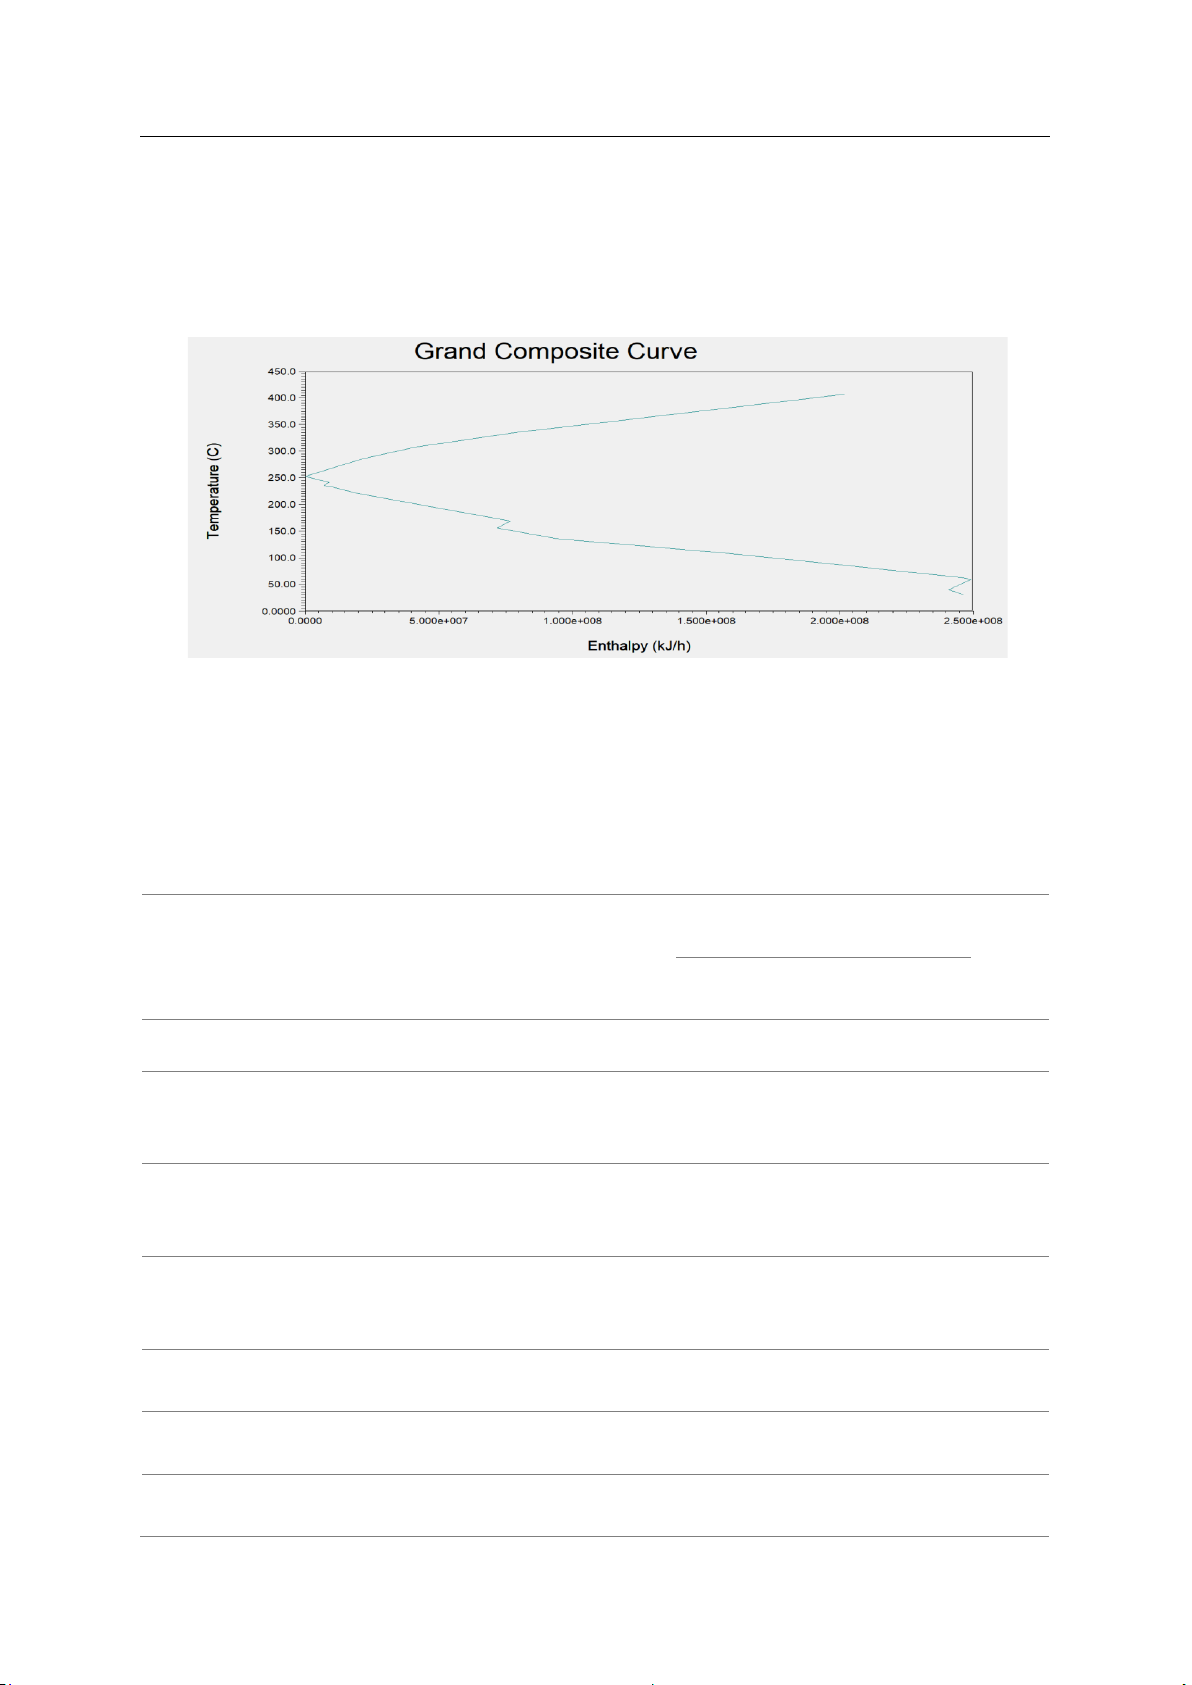
The Grand-Composite Curve (GCC) in Figure 4 depicts the heat accessible at various temperature
intervals as well as the process's net heat flow (which is zero at the pinch). ΔTmin is 20 degrees Celsius.
GCC tells us how much net heating and cooling is needed, as well as the temperatures at which it is necessary.
Figure 4: Grand-Composite curve at initial at ΔTmin=20oC
3.3 Heat Exchanger Network Analysis
In Aspen Energy Analyzer Heat, exchanger can be done manually and automatically by recommend
design. For given data, software had generated 10 designs. These designs were optimized and the best
design was proposed. The table 2 shows 10 recommended designs and table 3 shows optimized designs.
Table 2: Initial designs on the basis of total annualized cost Design Total Area(m2 Unit Shel Capital Heating(KJ/ Cooling(KJ/ Op. Cost ) s l Cost h) h) cost index index index *108 *108 A_Design1 0.333 34540.1 26 111 893273 1.94 2.38 0.242 7 6 3 4 A_Design2 0.339 36955.1 30 116 954527 1.94 2.3 0.242 9 8 9 4 A_Design3 0.332 33459.5 27 103 858836 1.95 2.4 0.244 2 4 4 5 A_Design8 0.325 31098.1 26 86 783279 1.96 2.4 0.245 4 5 A_Design5 0.337 35962.2 33 115 927453 1.94 2.38 0.242 1 7 5 4 A_Design6 0.325 30916.6 29 92 789766 1.9 2.4 0.244 1 3 4 5 A_Design7 0.325 31334.8 27 102 811908 1.93 2.38 0.242 3 1 8 3 5
International Conference on Advances in Mechanical Engineering-2022 (ICAME-2022) IOP Publishing
IOP Conf. Series: Materials Science and Engineering 1259 (2022) 012006
doi:10.1088/1757-899X/1259/1/012006 A_Design8 0.325 31098.1 26 86 783279 1.96 2.4 0.245 4 5 A_Design9 0.327 32509.8 25 92 818641 1.95 2.39 0.244 7 5 5 1 A_Design1 0.331 33881.9 28 103 868180 1.94 2.38 0.242 0 1 9 2 4
Table 3: Optimized design on the basis of total annualized cost Optimized Designs Design Total Area(m2 Unit Shel Capital Heating(KJ/ Cooling(KJ/ Op. cost Cost ) s l h) h) index index Cost *108 *108 index A_ Design 0.309 21647.1 26 70 5655604 2.01 2.46 0.2519 1- O 7 8 A_ Design 0.306 21444.0 30 65 5573383 1.99 2.43 0.2491 2- O 2 A_ Design 0.309 23983.4 27 72 6149838 1.97 2.42 0.247 3-O 8 A_Design4 0.31 24618.5 28 69 6251974 1.97 2.41 0.2462 -O 6 A_Design5 0.311 21136.2 33 68 5540424 2.03 2.48 0.2544 -O 3 A_Design6 0.309 22677.7 29 70 5874039 1.99 2.44 0.2496 -O 6 7 A_Design7 0.31 22711.9 27 73 5881098 2 2.44 0.2499 -O A_ Design 0.253 8493.02 26 29 6637165 1.48 1.92 0.186 8-O 4 A_Design9 0.312 22455.5 25 62 5661801 2.04 2.48 0.2551 -O 9 A_Design1 0.308 21671.2 28 66 5605156 2 2.44 0.2511 0-O 4 4
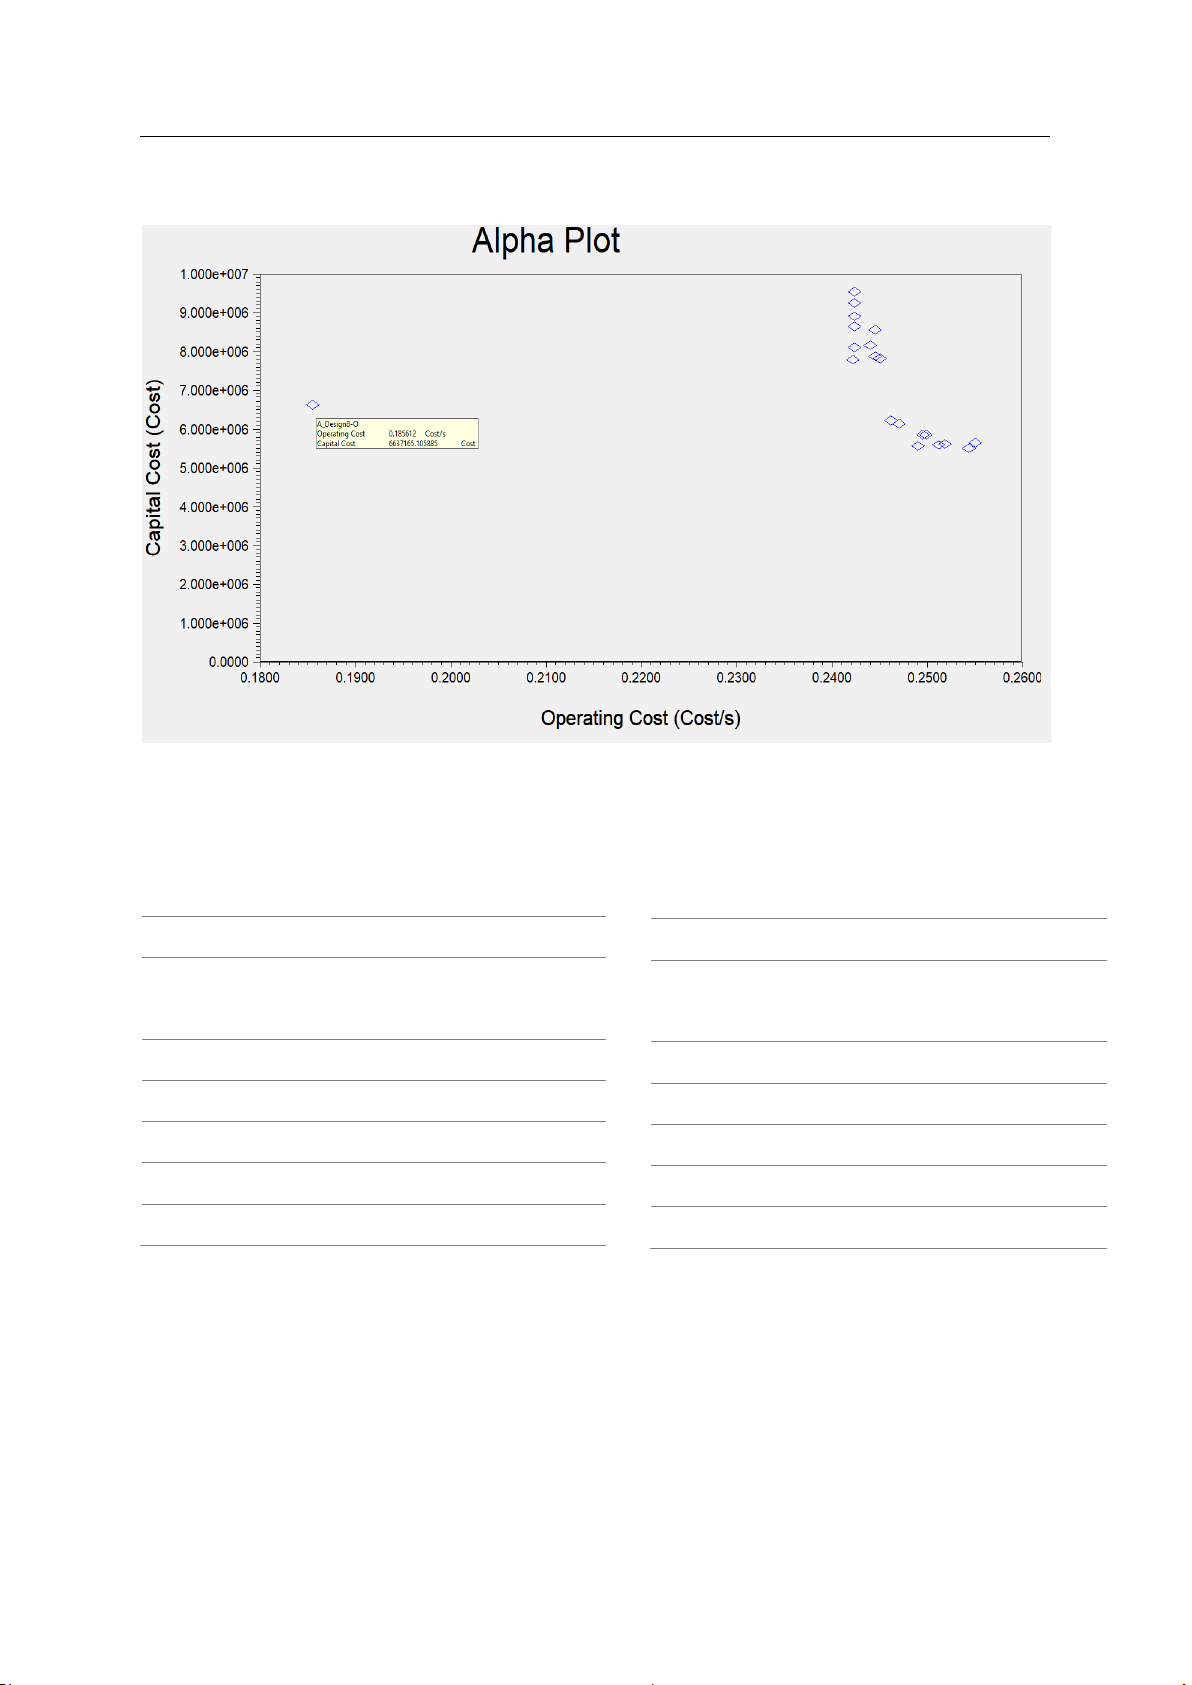
Out of 10 optimized designs design 8 is most efficient on because less area and utility requirements.
Also from alpha plot (Figure 5) which is a plot of operating cost vs capital cost for all designs it can be
seen that design 8 is most economical. However, it has overshooted the no. of targeted units which also
increased the capital cost 6
International Conference on Advances in Mechanical Engineering-2022 (ICAME-2022) IOP Publishing
IOP Conf. Series: Materials Science and Engineering 1259 (2022) 012006
doi:10.1088/1757-899X/1259/1/012006
Figure 5: Alpha Plot
Table 4 and 5 shows the performance of design 8 which is relative to the targets. It can be seen Number
of units has overshooted by 44.44% whereas capital cost has overshooted by 38.0641%.
Table 4: Network cost Indexes relative to target Table 5: Network Performance relative to target
Network Cost Indexes (design 8)
Network Performance (design 8) Cost Index % of HEN % of Target Target Heating(Cost/s) 0.174282195 73.0780 Heating(KJ/h) 147658192.3 73.0780 Cooling(Cost/s) 1.13E-02 77.9205 Cooling(KJ/h) 191973081.4 77.9205 Operating(Cost/s) 0.185611593 73.3563 Number of Units 26 144.4444 Capital(Cost) 6637165.106 138.0641 Number of Shells 29 93.5484 Total Cost(Cost/s) 0.253402186 86.4145 Total Area (m2) 8493.022322 41.6728
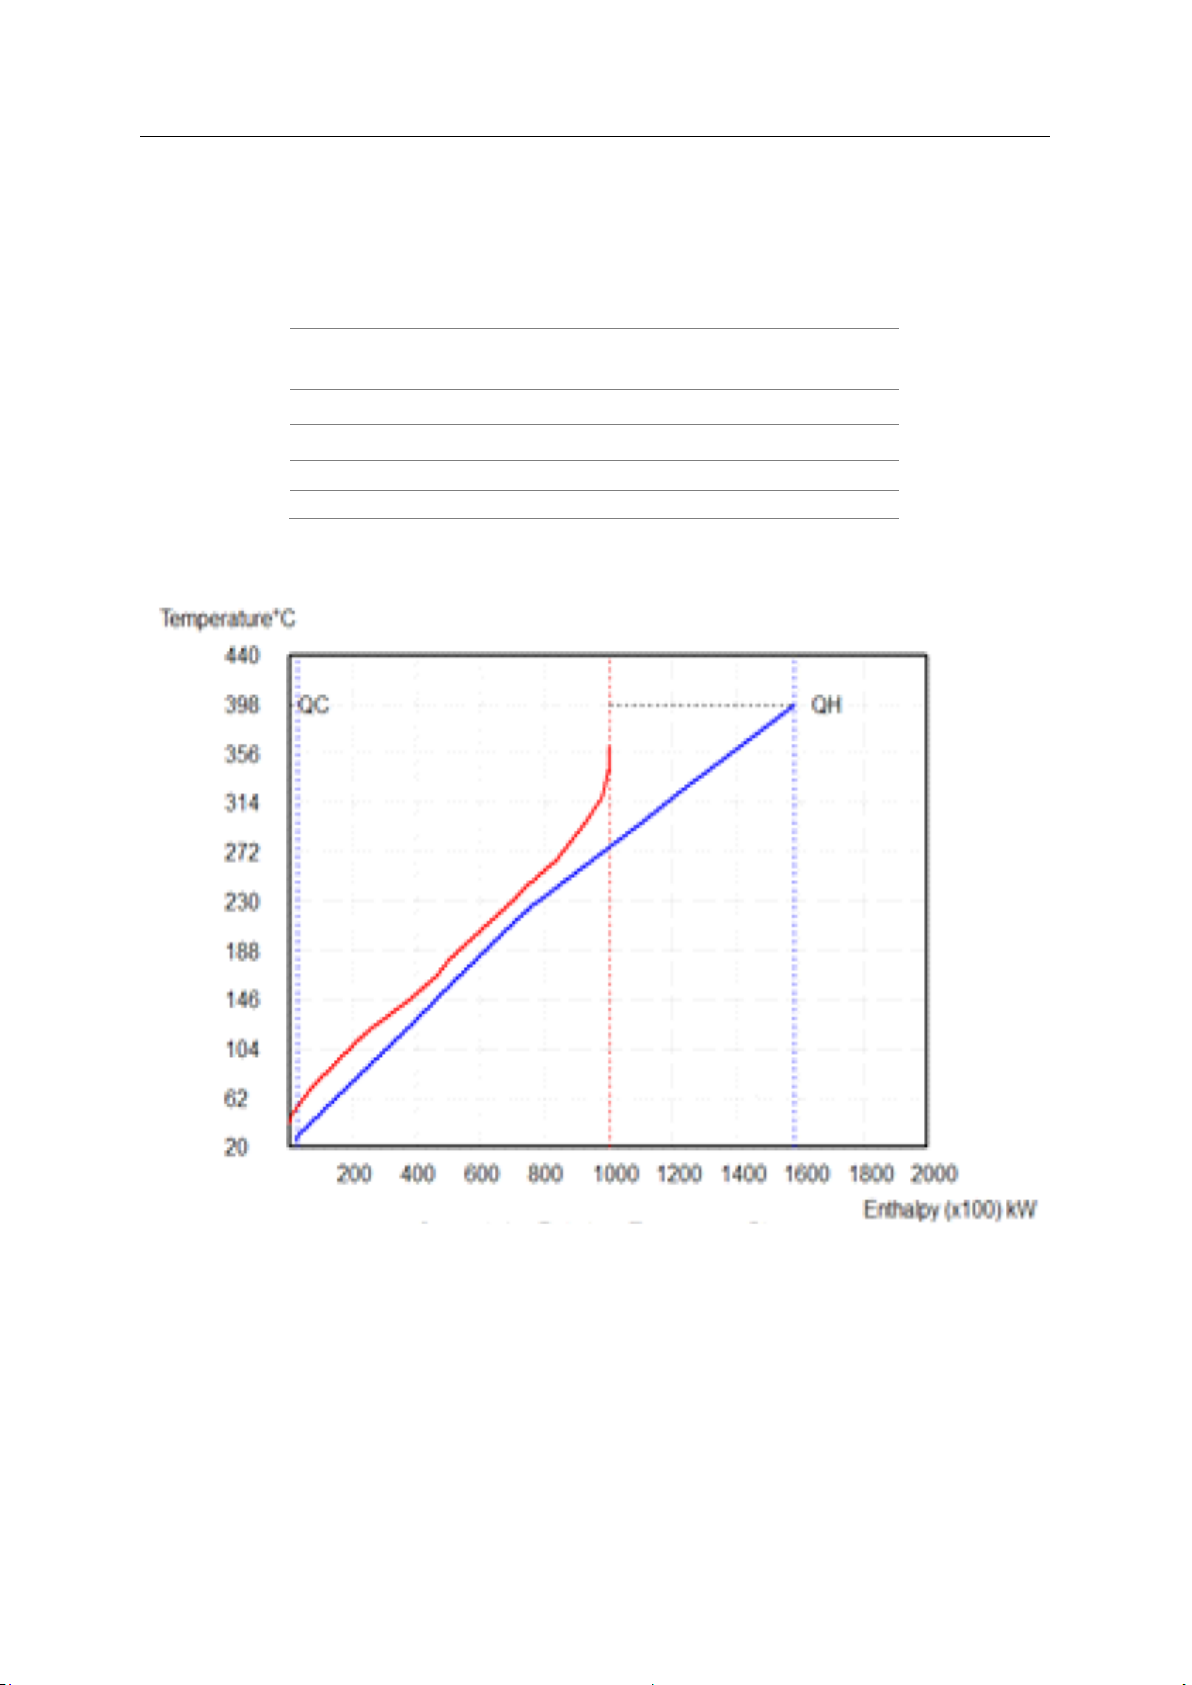
Table 6 shows the comparison of a various parameter of previous work [3] on the same data of Kaduna
refinery. It can be seen that the pinch temperature is different for same ΔTmin. Although the heating duty is
almost same but there is a vast difference in cooling duty this can also be justified by the composite diagrams
of present study (Fig.3) and Barambu Nafiu Umar et al. (Fig.6). There is a difference in the lower part of the
Composite diagram which explains the difference in cooling duties of two studies. Moreover, same results
to present study were obtained when an open source software HINT was used to generate composite curves
and target report (Fig.7a and 7b).
Heat recovery of 4.1784*108 KJ/h occurs in the suggested design. The hot utility reduction is approximately
26.9% of the overall target heat load, whereas the cold utility reduction is approximately 22.8% of the initial 7
International Conference on Advances in Mechanical Engineering-2022 (ICAME-2022) IOP Publishing
IOP Conf. Series: Materials Science and Engineering 1259 (2022) 012006
doi:10.1088/1757-899X/1259/1/012006
target load. The minimum number of units for heat transfers, such as heaters, coolers, and heat exchangers,
increases, resulting in a 38.1 % increase in capital cost.
Table 6: Comparison with past work Parameter Units Barambu Nafiu Umar Present study et al. (2017) ΔTmin 0C 20 20 Pinch point 0C 222 254 Heating utility MW 57.65 56.1266 Cooling utility MW 2.638 68.4361
Figure 6: Composite curves of Barambu Nafiu Umar et al. (2017) 8
International Conference on Advances in Mechanical Engineering-2022 (ICAME-2022) IOP Publishing
IOP Conf. Series: Materials Science and Engineering 1259 (2022) 012006
doi:10.1088/1757-899X/1259/1/012006
Figure 7a: Composite curves obtained from HINT
Figure 7b: Target report obtained from HINT 4. Conclusion:
The pinch temperatures are found to be 2640C (hot pinch) and 2440C (cold pinch). The cold utility
requirement is 2.464*108 [kJ/h] (Cooling Water) and hot utility requirement is 2.021*108 [kJ/h] (Fired Heat).
The Crude Distillation Unit of the Kaduna Refinery [3] was subjected to a pinch analysis utilizing Aspen
Energy Analyzer. Heat recovery of 4.1784*108 KJ/h occurs in the suggested design. The hot utility
reduction is approximately 26.9% of the overall target heat load, whereas the cold utility reduction is
approximately 22.8% of the initial target load. The minimum number of units for heat transfers, such as
heaters, coolers, and heat exchangers, increases, resulting in a 38.1 % increase in capital cost above the
initial goal capital cost, since capital cost investment is a one-time investment, it will be helpful in the long run. 9
International Conference on Advances in Mechanical Engineering-2022 (ICAME-2022) IOP Publishing
IOP Conf. Series: Materials Science and Engineering 1259 (2022) 012006
doi:10.1088/1757-899X/1259/1/012006
The difference in the pinch point and cooling utility between present study and Barambu Nafiu Umar et
al. can be because of difference in software’s. HINT and Aspen Energy Analyser are giving similar
results whereas HENSAD is showing variation in some parameters. 5. References:
[1] Robin Smith, Chemical Process Design, McGraw-Hill, New York (1995)
[2] Iregbu, Precious O. Yiga, Francis, Tijani, Olamilekan E. ,Pinch Analysis of Heat Exchanger
Networks of an Industrial Ammonia Plant for Fertilizer Production; International Research Journal of
Advanced Engineering and Science,(2020)
[3] Barambu Nafiu Umar , El-Nafaty Usman Aliyu, Saeed Isa Ahmed; Energy Integration Of Crude
Distillation Plant Using Pinch Analysis (A Case Study Of Kaduna Refinery And Petrochemical
Company, Nigeria); International Journal of Innovative Research and Advanced Studies (IJIRAS), (2017)
[4] Mohammed Nasiru Bello, Sadiq Ali Zangeri, Pinch Analysis of Vacuum Distillation Unit of Kaduna
Refinery and Petrochemical Company, IOSR Journal of Engineering, (2021)
[5] Padole Manjusha, Sapkal Pradyumna2, Dawande S.D. , Nitin Kanse, Heat Integration of Crude
Organic Distillation Unit, Research Journal of Engineering Sciences (2013)
[6] Ian C Kemp, Pinch Analysis and process integration, a user guide on process integration for effective
use of energy, IChemE, Elsevier Limited, (2007)
[7] Bodo Linnhoff and John R. Flower, Synthesis of Heat Exchanger Networks, AIChe Journal, (1978)
[8] Bodo Linnhoff and E. Hindmarsh, the Pinch Design Method for Heat Exchanger Networks,
Chemical Engineering Science, (1982)
[9] André L.H. Costa, Eduardo M. Queiroz; An extension of the problem table algorithm for multiple
utilities targeting, Energy Conversion and Management, (2009)
[10] W.D Seider, J.D Seader, D.R Lewin, Product and Process Design Principles, (2003)
[11] Shoaib, A. M., Emam, E. A., Osman, W. S.; Industrial Application of Plant Crude Oil through
Comparison of Heat Exchanger Network Synthesis Techniques; Journal of Petroleum and Mining Engineering ;( 2021)
[12] Luqman Buchori 1 and Farah Marda Yesica Putri; Pinch Analysis for Styrene Production With
Lummus/UOP Smart SM Technology; International Conference on Chemical and Material Engineering (ICCME 2021)
[13] Keivan Nemati-Amirkolaii, Hedi Romdhana and Marie-Laure Lameloise; Pinch Methods for
Efficient Use of Water in Food Industry: A Survey Review; Sustainability 2019
[14] Nikhil M Gadave, Pramod P Kothmire; Thermo hydraulic evaluation performance of shell
and tube heat exchanger with different tube geometries, International Journal of Engineering and Technology (2019)
[15] Renu K.ShastriabChinmaya P.Mohantyc; Machinability investigation on Nimonic C263 alloy in
electric discharge machine, Material today : proceeding, 2020
[16] Deore H., Sardare M., Nemade P. Experimental Modeling and Evacuation of Cr(VI) from
Wastewater by Using Nanostructured Ceria.Advances in Civil Engineering and Infrastructural
Development. Lecture Notes in Civil Engineering, vol 87. Springer, Singapore. (2021) 10
Tài liệu liên quan:
-
Hướng dẫn thực hành Bài 1: Đo độ cứng kim loại môn Vật liệu học | Trường Đại học Sư phạm Kỹ thuật Vĩnh Long
22 11 -

Giáo trình môn Vật liệu học kỹ thuật | Trường Đại học Sư phạm Kỹ thuật Vĩnh Long
32 16 -
Giáo trình môn Vật liệu học kỹ thuật | Đại học Sư phạm Kỹ thuật Vĩnh Long
33 17 -

Tập hợp câu hỏi ôn tập Môn Vật liệu học kỹ thuật | Đại học Sư phạm Kỹ thuật Vĩnh Long
85 43