The impact of studying in coffee shops on academic performance môn Xác suất thống kê| Trường Đại học Ngoại Thương
At Foreign Trade University - Campus II (FTUHCMC), thelimited area compared to the number of students has made study and group discussion spaces scarce. Tài liệu giúp bạn tham khảo, ôn tập và đạt kết quả cao. Mời đọc đón xem!
Môn: Xác suất thống kê (FTU) 355 tài liệu
Trường: Trường Đại học Ngoại Thương 1.1 K tài liệu
Tác giả:


Preview text:
Page 1 of 31 - Cover Page
Submission ID trn:oid:::10015:113696040 reports-chưa-check Turnitin Document Details Submission ID trn:oid:::10015:113696040 29 Pages Submission Date 6,202 Words Sep 22, 2025, 8:46 PM GMT+5 36,565 Characters Download Date Sep 22, 2025, 8:47 PM GMT+5 File Name reports-chưa-check.docx File Size 297.5 KB Page 1 of 31 - Cover Page
Submission ID trn:oid:::10015:113696040
Page 2 of 31 - AI Writing Overview
Submission ID trn:oid:::10015:113696040 0% detected as AI Caution: Review required.
The percentage indicates the combined amount of likely AI-generated text as
It is essential to understand the limitations of AI detection before making decisions
well as likely AI-generated text that was also likely AI-paraphrased.
about a student’s work. We encourage you to learn more about Turnitin’s AI detection
capabilities before using the tool. Detection Groups 0AI-generated only 0%
Likely AI-generated text from a large-language model.
0AI-generated text that was AI-paraphrased 0%
Likely AI-generated text that was likely revised using an AI-paraphrase tool or word spinner. Disclaimer
Our AI writing assessment is designed to help educators identify text that might be prepared by a generative AI tool. Our AI writing assessment may not always be accurate (it may misidentify
writing that is likely AI generated as AI generated and AI paraphrased or likely AI generated and AI paraphrased writing as only AI generated) so it should not be used as the sole basis for
adverse actions against a student. It takes further scrutiny and human judgment in conjunction with an organization's application of its specific academic policies to determine whether any
academic misconduct has occurred. Frequently Asked Questions
How should I interpret Turnitin's AI writing percentage and false positives?
The percentage shown in the AI writing report is the amount of qualifying text within the submission that Turnitin’s AI writing
detection model determines was either likely AI-generated text from a large-language model or likely AI-generated text that was
likely revised using an AI paraphrase tool or word spinner.
False positives (incorrectly flagging human-written text as AI-generated) are a possibility in AI models.
AI detection scores under 20%, which we do not surface in new reports, have a higher likelihood of false positives. To reduce the
likelihood of misinterpretation, no score or highlights are attributed and are indicated with an asterisk in the report (*%).
The AI writing percentage should not be the sole basis to determine whether misconduct has occurred. The reviewer/instructor
should use the percentage as a means to start a formative conversation with their student and/or use it to examine the submitted
assignment in accordance with their school's policies.
What does 'qualifying text' mean?
Our model only processes qualifying text in the form of long-form writing. Long-form writing means individual sentences contained in paragraphs that make up a
longer piece of written work, such as an essay, a dissertation, or an article, etc. Qualifying text that has been determined to be likely AI-generated will be
highlighted in cyan in the submission, and likely AI-generated and then likely AI-paraphrased will be highlighted purple.
Non-qualifying text, such as bullet points, annotated bibliographies, etc., will not be processed and can create disparity between the submission highlights and the percentage shown.
Page 2 of 31 - AI Writing Overview
Submission ID trn:oid:::10015:113696040
Page 3 of 31 - AI Writing Submission
Submission ID trn:oid:::10015:113696040
FOREIGN TRADE UNIVERSITY HCMC CAMPUS
DEPARTMENT OF ECONOMICS AND LAW ---------o0o--------- GROUP 18
THE IMPACT OF STUDYING IN COFFEE SHOPS ON
ACADEMIC PERFORMANCE: EVIDENCE FROM
FOREIGN TRADE UNIVERSITY HO CHI MINH CITY STUDENTS
Final Assignment – Research Methodology for Economics and Business Academic year: 2024-2025 Grade (in number) Grade (in words) Examiner 1’s signature Examiner 2’s signature Invigilator 1’s signature Invigilator 2’s signature Course code: KTEE206 - ML47
Lecturer: Dr. Le Hang My Hanh
Student 1: Nguyen Ngoc Minh Thao (Tổ thi/Số TT) – 2411115172
Student 1: Le Phuoc Tan (1/12) – 2412155241
Student 2: Trinh Ngoc Minh Thu (2/13) – 2411115185
HO CHI MINH CITY, JUNE 22, 2025
Page 3 of 31 - AI Writing Submission
Submission ID trn:oid:::10015:113696040
Page 4 of 31 - AI Writing Submission
Submission ID trn:oid:::10015:113696040 Table of Contents
1. Introduction ............................................................................................................................... 4
1.1. Rationale.............................................................................................................................. 4
1.2. Research Purpose ................................................................................................................ 4
1.3. Research Subjects and Scope ............................................................................................. 4
1.4. Research Methodology ........................................................................................................ 5
1.5. Novelty of the Study ............................................................................................................ 5
1.6. Research Questions ............................................................................................................. 5
2. Literature Review ..................................................................................................................... 6
2.1. Theoretical Foundation ...................................................................................................... 6
2.2. Previous Research on the Topic ......................................................................................... 6
2.2.1. Related Studies .............................................................................................................. 6
2.2.2. General Assessment of Existing Studies ....................................................................... 6
2.3. Overall Conclusion from the Literature Review ................................................................ 7
2.4. Research Questions and Hypotheses .................................................................................. 7
3. Methodology and Data ............................................................................................................. 9
3.1. Research Model .................................................................................................................. 9
3.1.1. Theoretical Basis for Variable Selection ....................................................................... 9
3.1.2. Definition and Measurement of Variables .................................................................. 10
3.1.3. Regression Model ........................................................................................................ 12
3.2. Data Collection ................................................................................................................. 12
3.2.1. Survey Participants ..................................................................................................... 12
3.2.2. Scale Development ...................................................................................................... 12
3.2.3. Selection of Measurement Level ................................................................................. 13
3.2.3. Design the Questionaire .............................................................................................. 13
3.3 Estimation Method ............................................................................................................. 15
3.4. Descriptive Statistics and Variable Correlations .............................................................. 16
3.4.1. Descriptive Statistics of Variables .............................................................................. 16
3.4.2. Correlation Analysis ................................................................................................... 17
Page 4 of 31 - AI Writing Submission
Submission ID trn:oid:::10015:113696040
Page 5 of 31 - AI Writing Submission
Submission ID trn:oid:::10015:113696040
4. Estimated Results and Statistical Inferences ........................................................................ 18
4.1. Research Results and Discussion ..................................................................................... 18
4.1.1. Regression Model Results ........................................................................................... 18
4.1.2. Confidence Interval Estimation .................................................................................. 20
4.2. Model Diagnostics ............................................................................................................. 22
4.3. Interpretation of Findings ................................................................................................ 23
4.4. Limitations & Future Research ........................................................................................ 24
REFERENCE .............................................................................................................................. 25
APPENDIX .................................................................................................................................. 27
Page 5 of 31 - AI Writing Submission
Submission ID trn:oid:::10015:113696040
Page 6 of 31 - AI Writing Submission
Submission ID trn:oid:::10015:113696040 1. Introduction 1.1. Rationale
At Foreign Trade University - Campus II (FTUHCMC), the limited area compared
to the number of students has made study and group discussion spaces scarce. It has
become more common for students in FTUHCMC to choose cafés as alternative spaces
for studying and group-working. However, there has been little research specifically
assessing whether studying at cafés has positive or negative effects on students' academic
performance. Therefore, research about the influence of cafés’ environment to study
effectiveness is necessary, as it can help students understand more about how to choose a
suitable study environment and optimize their study results. 1.2. Research Purpose
This study aims to help FTUHCMC students optimize learning effectiveness when
studying at cafés by evaluating the impact of environmental factors, including: Frequency
Study Environment (lighting quality, Wi-Fi stability, seating comfort, and overall cleanliness) Autonomy Noise Social Presence Cost
This study will analyze the relationship between studying in cafés and academic
results and examine whether cafés’ environments enhance the concentration ability,
improve studying effectiveness and contribute to academic outcomes (GPA).
1.3. Research Subjects and Scope
The research subjects of this study are students of Foreign Trade University -
Campus II. This group has a relatively high frequency of using cafés to study and group
work. This transparently reflects the trend of replacing traditional study spaces.
The scope of this study focuses on cafés surrounding FTUHCMC, which our
research subjects frequently visit for learning. In terms of timeframe, the research is
conducted for one week in September, with data collected through online surveys.
Page 6 of 31 - AI Writing Submission
Submission ID trn:oid:::10015:113696040
Page 7 of 31 - AI Writing Submission
Submission ID trn:oid:::10015:113696040 1.4. Research Methodology
This study mainly uses a quantitative research approach, combined with
questionnaire surveys to collect primary data from FTUHCMC students. The variables
are constructed based on environmental factors in cafés (lighting quality, Wi-Fi stability,
seating comfort, and overall cleanliness).
After data collection, the research team processes and analyzes the data using
econometric software. The Ordinary Least Squares (OLS) regression method is applied to
estimate the relationship between the mentioned factors and academic performance
(GPA). In addition, model diagnostic tests (heteroskedasticity, multicollinearity,
normality) are conducted to ensure the reliability of the results. 1.5. Novelty of the Study
This study contributes to the existing research treasure in three ways.
While prior research has examined the productivity and preferences in coffee shop
learning environments, few have directly assessed their relationship with
measurable academic outcomes such as GPA.
Most existing research is conducted in Western contexts, whereas this study
provides evidence from Vietnamese university students, especially in Foreign Trade University - Campus II.
The research focuses on students of Foreign Trade University Ho Chi Minh City,
where limited study spaces create a unique context that has not been studied before. 1.6. Research Questions
To reach the research purpose, this study concentrates on answering these questions:
Does studying in cafés affect the academic performance of FTU2 students?
Which factor in the café environment (điền mấy cái biến dô) has the strongest
impact on learning effectiveness?
How are the frequency and duration of studying in cafés related to students’ academic performance (GPA)?
Page 7 of 31 - AI Writing Submission
Submission ID trn:oid:::10015:113696040
Page 8 of 31 - AI Writing Submission
Submission ID trn:oid:::10015:113696040 2. Literature Review 2.1. Theoretical Foundation
Multiple theories exist to explain how study environments influence academic
achievement. Environmental psychology demonstrates how outside factors impact
student attention and motivation and their cognitive performance. The three
environmental factors of noise levels and lighting conditions and social interaction
density between people determine both productivity and learning results (Mehrabian &
Russell, 1974). According to the self-determination theory (Deci & Ryan, 1985) students
who choose their study spaces and work independently will experience higher internal
motivation which leads to better academic results. The cognitive load theory (Sweller,
1988) demonstrates that academic performance improves when students study in
environments with suitable stimulation levels that avoid both excessive distractions and
dullness. The distinctive combination of noise levels and social atmosphere and physical
setting in coffee shops makes them an ideal setting to study the mentioned theoretical concepts.
2.2. Previous Research on the Topic 2.2.1. Related Studies
Academic performance research shows how various educational settings affect
student learning outcomes. The research by Mehta et al. (2012) illustrates that students
working in coffee shops with controlled noise levels achieve better creative outcomes by
enhancing abstract thinking abilities. The research by Kim (2015) shows that students
who study in cafés performed better and completed their work successfully than some
students who studied in libraries or dormitories. Additionally, ldenburg (1999) examined
third places to prove that public areas outside homes and workplaces develop spaces
which enhance social interaction and boost work creativity as well as productivity.
The research by Wu & Chang (2017) established that environmental aspects
including background sounds and seating arrangements determine student study duration
and academic achievement. The research conducted by Nguyen & Le (2021) discovered
that Vietnamese university students choose coffee shops as their main study location
because these places provide better Wi-Fi connection, cool temperature and comfortable
seating and reduced home unwanted disruptions.
2.2.2. General Assessment of Existing Studies
The current research provides useful findings but many research gaps continue to
exist. The majority of existing studies investigate general productivity and preference but
Page 8 of 31 - AI Writing Submission
Submission ID trn:oid:::10015:113696040
Page 9 of 31 - AI Writing Submission
Submission ID trn:oid:::10015:113696040
fail to measure academic performance through GPA scores and exam results. The
research fails to consider cultural backgrounds and institutional environments because
methods that succeed in Western education systems do not necessarily work in Asian
educational environments. The majority of previous studies depend on self-reported
survey data which could produce biased results instead of using both academic
performance records and survey responses. The connection between coffee shop
environments and academic achievement remains understudied even though evidence
showing these environments affect student learning behaviors.
2.3. Overall Conclusion from the Literature Review
The research shows that coffee shops serve as successful study spaces because
they help students maintain focus and improve their theoretical knowledge base. The
research shows that learning outcomes depend on environmental factors which include
noise levels and autonomy and social settings. The study investigates the relationship
between coffee shop study environments and academic performance of Foreign Trade
University Ho Chi Minh City students to generate academic value and improve student learning methods.
2.4. Research Questions and Hypotheses
Environmental Factors: How do noise levels, lighting and social presence in
coffee shops influence the academic performance of FTU HCMC students?
Autonomy and Motivation: Does having the ability to select study spaces (e.g.,
coffee shops instead of libraries) enhance intrinsic motivation and therefore improve academic performance?
Cognitive Load: Is there an optimal level of environmental stimulation (e.g.,
moderate surrounding noise) that maximizes learning outcomes as well as academic performance?
Heterogeneity: Do the effects of studying in coffee shops vary by gender, year of
study, or students’ levels of intrinsic motivation?
Page 9 of 31 - AI Writing Submission
Submission ID trn:oid:::10015:113696040
Page 10 of 31 - AI Writing Submission
Submission ID trn:oid:::10015:113696040
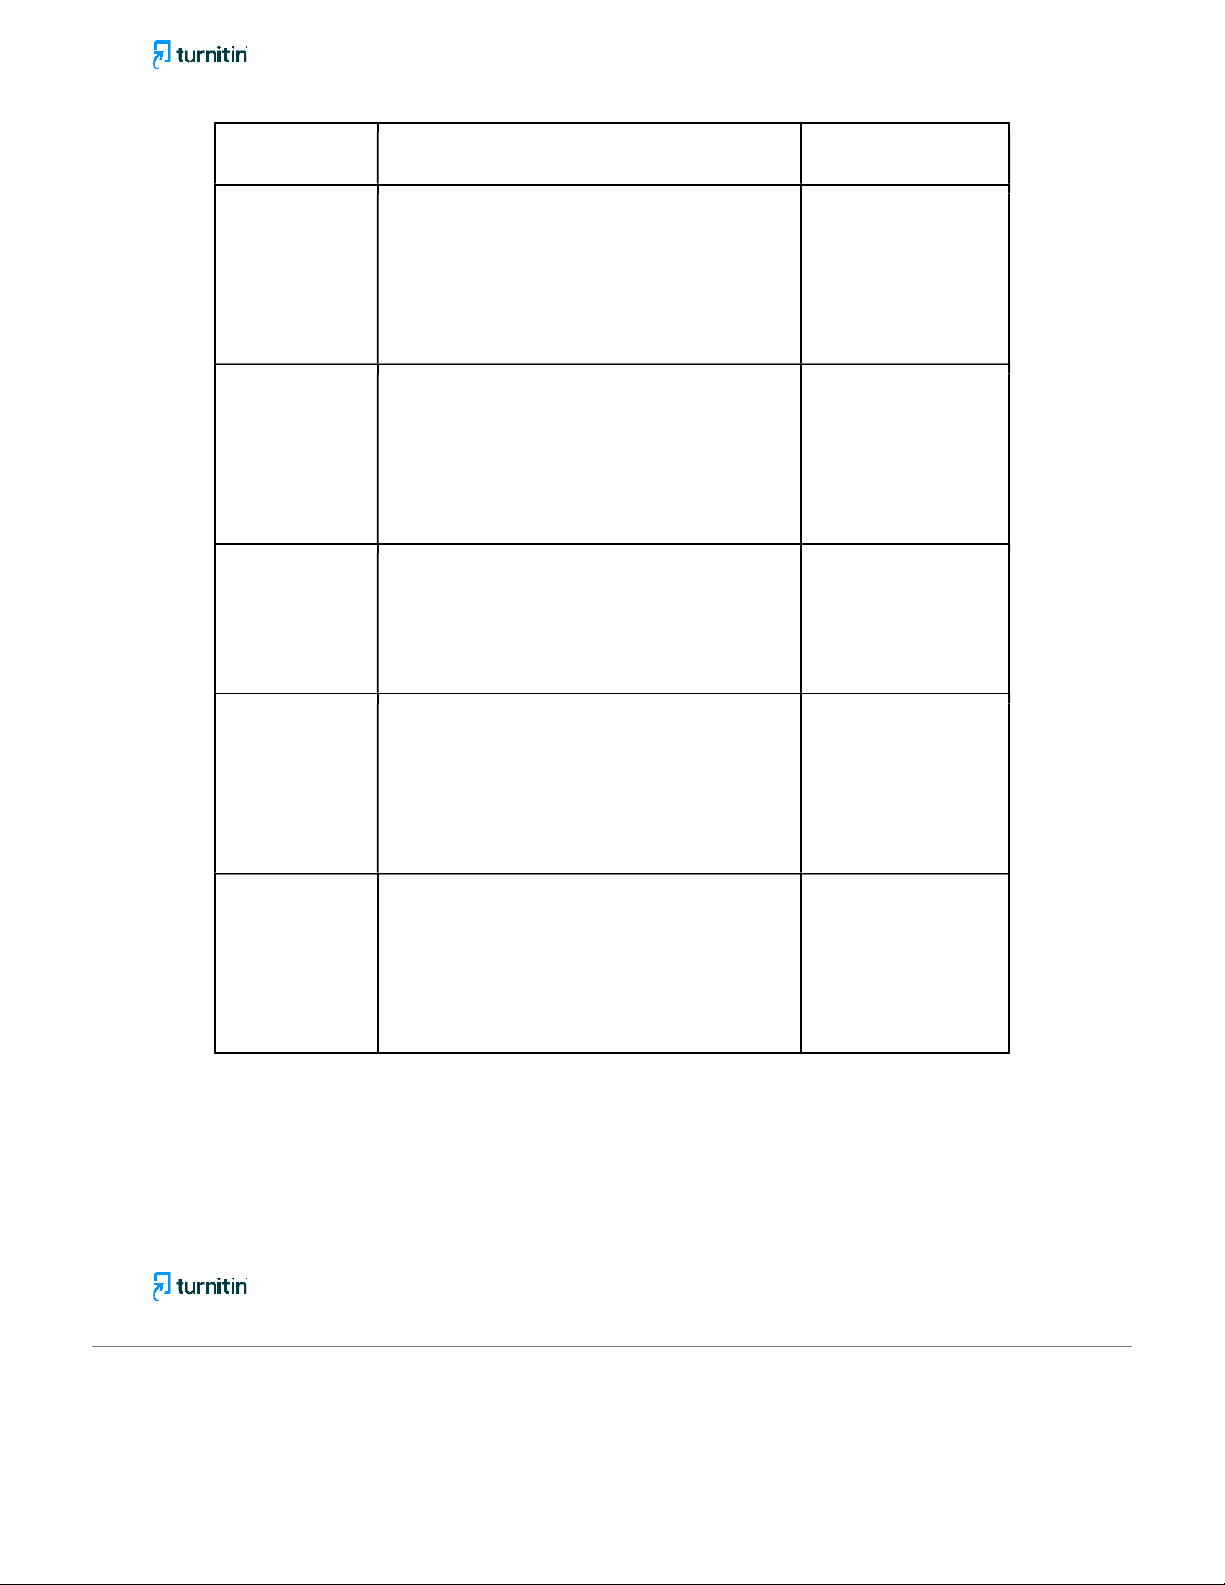
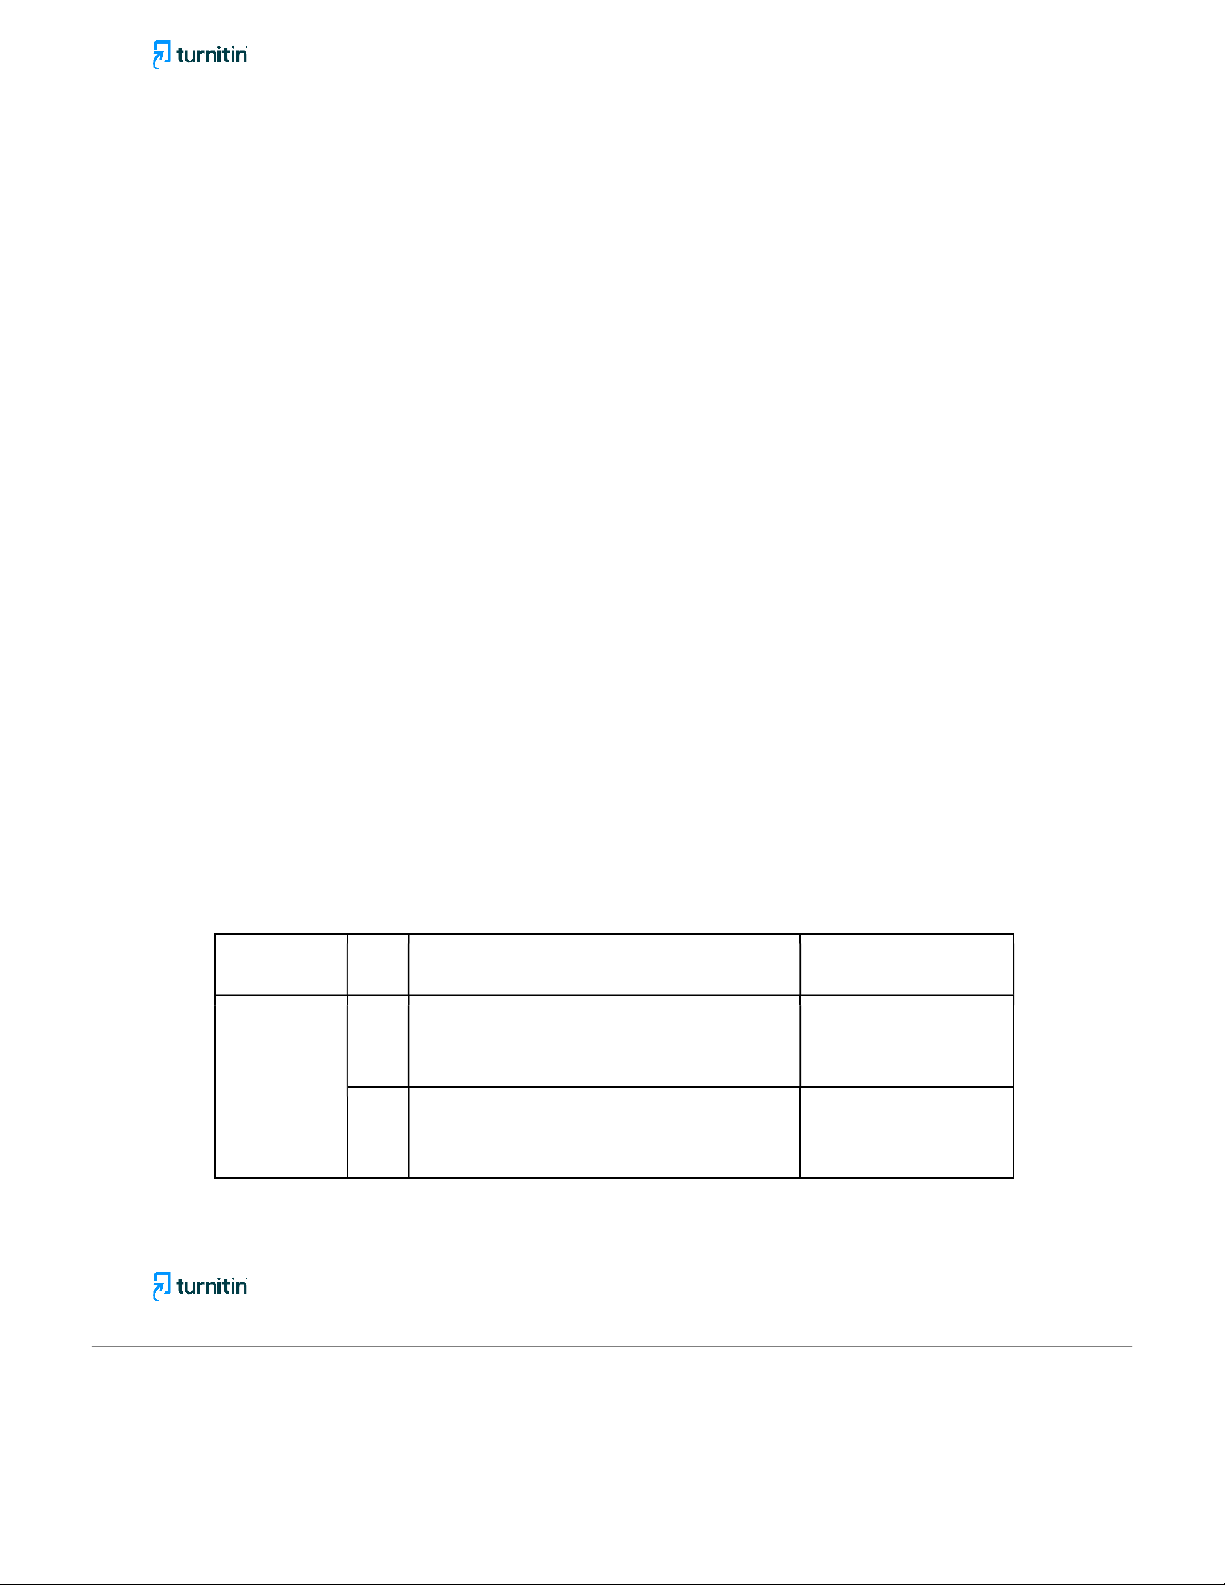
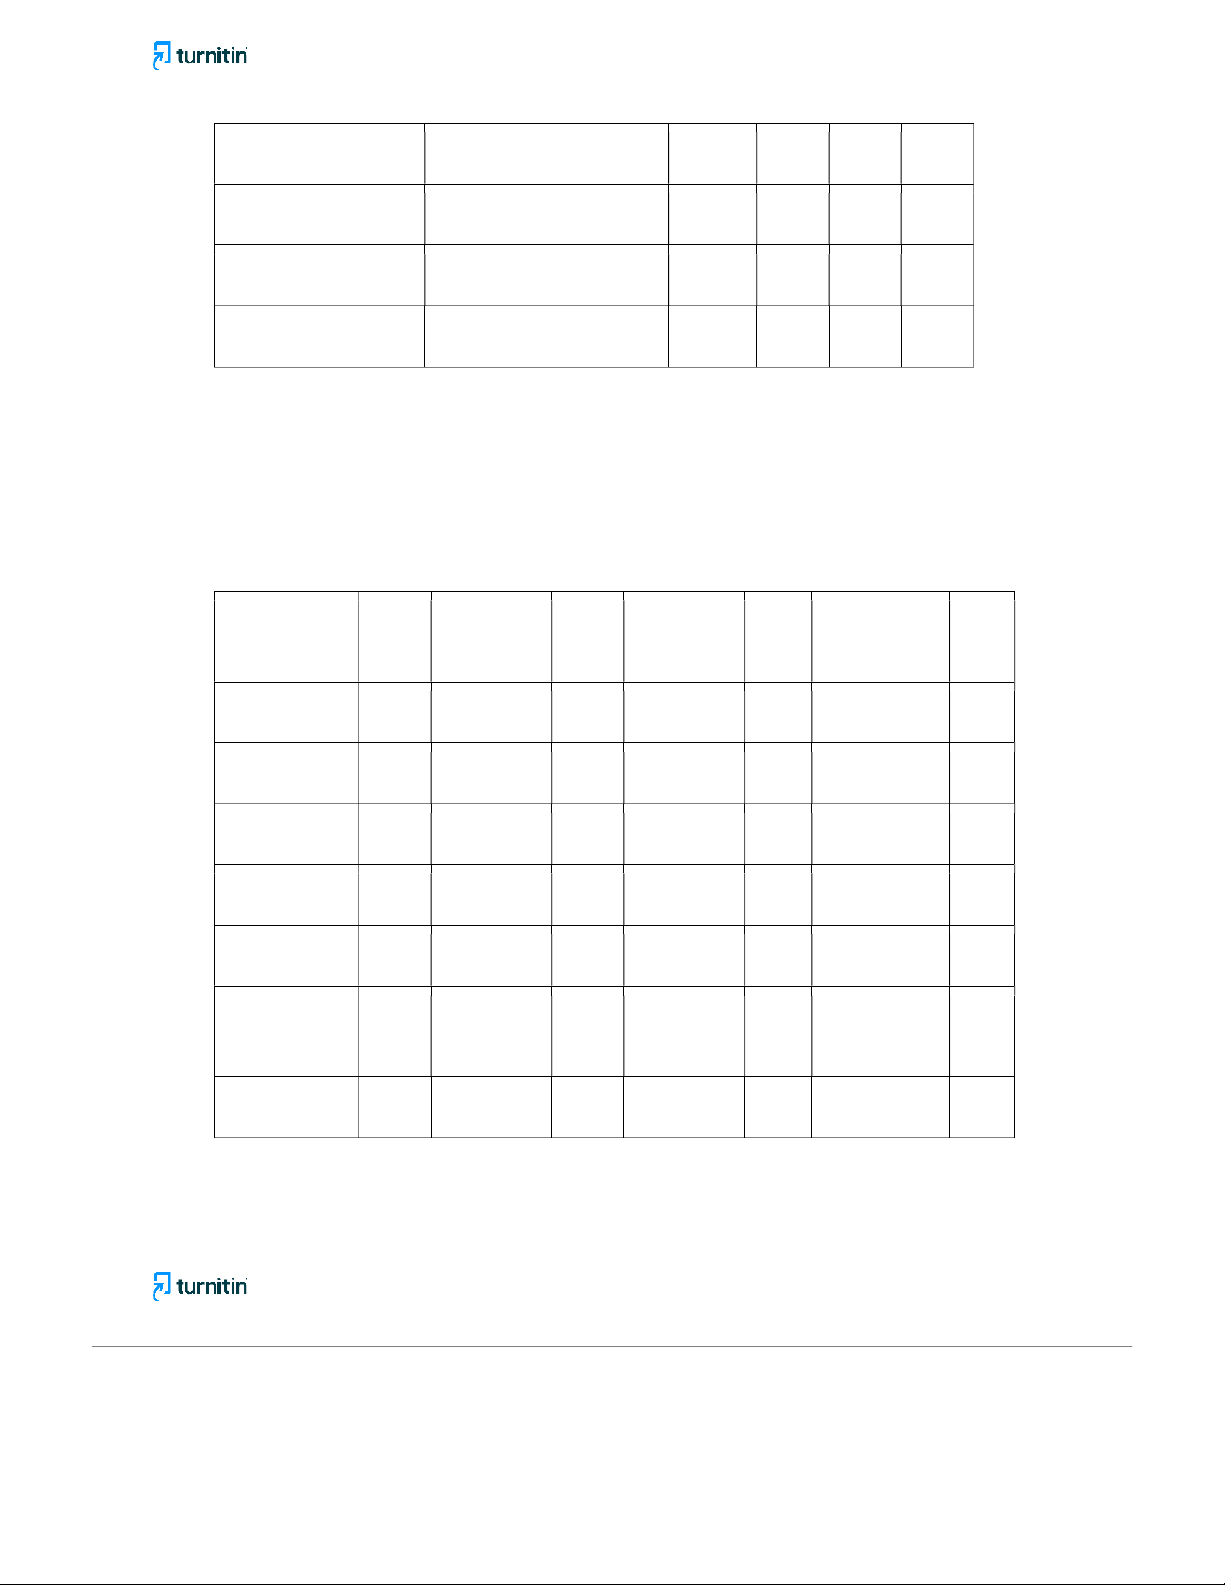
Variable Hypothesis References Frequency of
H1 (Environmental Psychology): Moderate Mehta, Zhu & studying in
ambient noise (approximately 50–70 dB, Cheema coffee shops
self-reported) has a positive effect on GPA, (2012); Awada et
while noise levels that are too low or too high al. (2022) Noise level reduce GPA. Perceived
H2 (Self-Determination Theory): Students Wang et al. (2024); autonomy
with higher perceived autonomy in choosing Yu et al. 2020
their study space report stronger intrinsic
motivation, which in turn positively affects GPA. Lighting
H3 (Cognitive Load Theory): Optimal Wu & Chang (2017) quality, Wi-fi
environmental conditions (good lighting,
stability, Crowd stable Wi-Fi, moderate crowd density) reduce density
cognitive load and increase exam scores. Intrinsic
H4 (Interaction Effect): The positive Mehta et al. (2012) motivation
relationship between frequency of studying in
coffee shops and GPA is stronger among
students with high intrinsic motivation
compared to those with lower motivation. Perceived
H5 (Third-Place Theory): Social presence Wu & Chang (2017)
social presence follows an inverted-U relationship with
GPA, where a moderate level of surrounding
activity enhances focus, but excessive
crowding decreases academic performance.
Page 10 of 31 - AI Writing Submission
Submission ID trn:oid:::10015:113696040
Page 11 of 31 - AI Writing Submission
Submission ID trn:oid:::10015:113696040 3. Methodology and Data 3.1. Research Model
3.1.1. Theoretical Basis for Variable Selection
This study investigates how studying in coffee shops influences students’
academic performance (GPA). The conceptual framework draws on environmental
psychology, self‐determination theory, and learning space research to explain how
different aspects of a café environment may affect academic outcomes. Based on these
theoretical perspectives, a set of hypotheses is formulated to guide the empirical analysis.
Frequency of Coffee-Shop Study
The “third place” concept (Oldenburg, 1999) argues that semi-public spaces
outside home and school provide opportunities for focused work, social interaction, and
personal growth. Moderate exposure to such settings can reduce monotony and increase
motivation (Waxman, 2006). Nevertheless, over-reliance on coffee-shop studying may
reduce time for structured academic activities or lead to fatigue.
H1: Studying in coffee shops more frequently is positively associated with GPA,
although the relationship may be weak or non-linear because excessive frequency could offset the benefits. Noise
Research on ambient noise consistently supports the Yerkes–Dodson law, which
predicts an inverted-U relationship between arousal and performance (Yerkes & Dodson,
1908). Moderate noise, such as low-volume music or light chatter, can enhance
concentration and creativity (Mehta, Zhu, & Cheema, 2012), but high noise levels are disruptive.
H2a: Noise level has a positive association with GPA at moderate levels.
H2b: The squared noise term will show a negative coefficient, reflecting the decline in
GPA when noise exceeds the optimal level. Autonomy
Self-Determination Theory (Deci & Ryan, 1985) posits that autonomy—feeling
free to choose one’s learning environment—promotes intrinsic motivation and
persistence in academic tasks. Environments that allow students to decide when and
where to study foster a greater sense of control and engagement (Vansteenkiste et al., 2004).
Page 11 of 31 - AI Writing Submission
Submission ID trn:oid:::10015:113696040
Page 12 of 31 - AI Writing Submission
Submission ID trn:oid:::10015:113696040
H3: Greater autonomy in choosing coffee-shop study settings is positively associated with GPA.
Study Environment (Lighting and Wi-Fi)
Physical conditions such as lighting and internet quality directly influence
concentration and task completion. Adequate lighting reduces eye strain and cognitive
fatigue (Boyce, 2014), while reliable Wi-Fi supports online research and access to course materials (Brooks, 2011).
H4: A higher-quality study environment—characterized by proper lighting and stable Wi-
Fi—is positively associated with GPA. Social Presence
The presence of other people can stimulate effort through social facilitation
(Zajonc, 1965), creating a subtle pressure to stay focused. At the same time, excessive
crowding or distracting interactions may harm productivity. Prior studies on co-working
and collaborative learning spaces (Kim & de Dear, 2013) confirm the potential for an inverted-U effect.
H5a: Social presence has a positive association with GPA at moderate levels.
H5b: The squared social presence term will have a negative coefficient, indicating that
GPA declines when the social environment becomes overly stimulating. Cost
Financial considerations can shape students’ use of third spaces. Higher drink
prices or study-related expenses may reduce visit frequency or create stress that
undermines learning (Nelson et al., 2011).
H6: Higher perceived cost is negatively associated with GPA. Control Variables
Gender, year of study, major, and living arrangement are included to account for
demographic and academic characteristics that may independently influence GPA (Astin,
1993). In summary, the theoretical framework anticipates that a balanced coffee-shop
environment—moderate noise, affordable costs, strong Wi-Fi, and sufficient autonomy—
will enhance academic outcomes.
3.1.2. Definition and Measurement of Variables 3.1.2.1. Dependent Variable Academic Performance (GPA)
Page 12 of 31 - AI Writing Submission
Submission ID trn:oid:::10015:113696040
Page 13 of 31 - AI Writing Submission
Submission ID trn:oid:::10015:113696040
Academic Performance is measured by the student’s Grade Point Average (GPA)
in the most recent semester. GPA is a standardized indicator of learning outcomes and
academic success, typically ranging from 0.0 to 4.0 (or the equivalent university grading
scale). It reflects the student’s ability to achieve academic objectives and serves as the
primary outcome variable in this study.
3.1.2.2. Independent Variables Frequency
Frequency refers to how often a student studies in coffee shops within a typical
week. It captures the regularity of study sessions and reflects the potential cumulative
impact of the coffee shop environment on academic outcomes. Noise
Noise measures the perceived sound level in the coffee shop, including background
music, customer conversations, and general ambient noise. Moderate noise may enhance
creativity and focus, while excessive noise may reduce concentration.
Noise² (Noise Squared): This quadratic term captures the nonlinear effect of noise
(inverted U-shape), allowing for the possibility that academic performance improves at
moderate noise levels but declines when noise is too low or too high. Autonomy
Autonomy indicates the perceived freedom and control students have in
choosing their study location, schedule, and study duration in coffee shops. Higher
autonomy is expected to enhance intrinsic motivation and self-regulated learning. Study Environment
Study Environment combines perceptions of lighting quality, seating comfort,
interior design, and Wi-Fi availability. A well-designed environment with adequate
lighting and stable internet connection creates a setting conducive to learning and academic focus. Social Presence
Social Presence measures the degree to which students perceive the presence of
other people (e.g., peers, other customers) in the coffee shop. This variable captures the
motivational or distracting effects of studying around others.
Social Presence² (Squared): This term captures potential nonlinear effects (e.g.,
social facilitation at moderate levels but distraction at very high levels of crowding).
Page 13 of 31 - AI Writing Submission
Submission ID trn:oid:::10015:113696040
Page 14 of 31 - AI Writing Submission
Submission ID trn:oid:::10015:113696040 Cost
Cost represents the perceived financial burden associated with purchasing drinks
or paying for services while studying in coffee shops. Higher costs may limit the
frequency of visits or reduce the overall positive effect of the environment. 3.1.3. Regression Model
We estimate the following cross-sectional ordinary least squares (OLS) model to
examine how studying in cafés affects academic performance (semester GPA):
GPAi = β0+ β1Frequency + β2Noise + β3Noisei^2 + β4Autonomy + β5
StudyEnvironment + β6 Social + β7 Social^2 + β8 Cost + γ′Controlsi+εi.
Where β₀ is the regression constant (intercept) and β₁, β₂, β₃, β₄, β₅ are the
coefficients of the independent variables. 3.2. Data Collection 3.2.1. Survey Participants
The target population for this study comprises undergraduate students enrolled at
Foreign Trade University — Ho Chi Minh City campus (FTU2), years 1 through 4 across
various majors. A total of 328 valid responses were collected for the analysis. To improve
representativeness, the research team applied a stratified quota approach: quotas were set
by year (1–4) and major so that the final sample approximates the composition of the
FTU2 student body with respect to these dimensions.
The questionnaire was administered as an survey distributed via students in class.
Participation was voluntary and anonymous. Criteria required respondents to be current
FTU2 students and to have studied at least once in a café during the semester;
respondents who did not meet these criteria were screened out at the beginning of the
form. Respondent confidentiality was strictly maintained: no personally identifying
information was collected, and all data were stored on a password-protected drive
accessible only to the research team. 3.2.2. Scale Development
Based on the proposed research model, the research team developed a preliminary
measurement scale consisting of five independent variables and one dependent variable.
The observed items were collected, selected, and designed by adapting findings from
previous scientific studies and relevant data to fit the current research context. In
addition, the team supplemented several new observed items to ensure relevance and
timeliness with respect to the scope and period of this study.
Page 14 of 31 - AI Writing Submission
Submission ID trn:oid:::10015:113696040
Page 15 of 31 - AI Writing Submission
Submission ID trn:oid:::10015:113696040
3.2.3. Selection of Measurement Level
The research team applied an ordinal measurement scale, specifically a 5-point
Likert scale, for all observed variables. The use of a Likert scale allows respondents to
clearly express the degree of their opinions and evaluations by selecting from a range of
ordered categories, from the lowest to the highest level.
The 5-point Likert scale was defined as follows: 1 = Strongly Disagree 2 = Disagree 3 = Neutral 4 = Agree 5 = Strongly Agree
3.2.3. Design the Questionaire
Based on the measurement scales developed, the research team designed a
questionnaire to be administered to 328 respondents. The questionnaire comprises the following three main parts:
An introduction to the research team and the purpose of the survey.
Demographic questions: intended to collect information about the sample, to help
filter out responses that do not meet the study criteria, and to provide a basis for
sample statistics and deeper analysis of the sample’s characteristics relevant to the research topic;
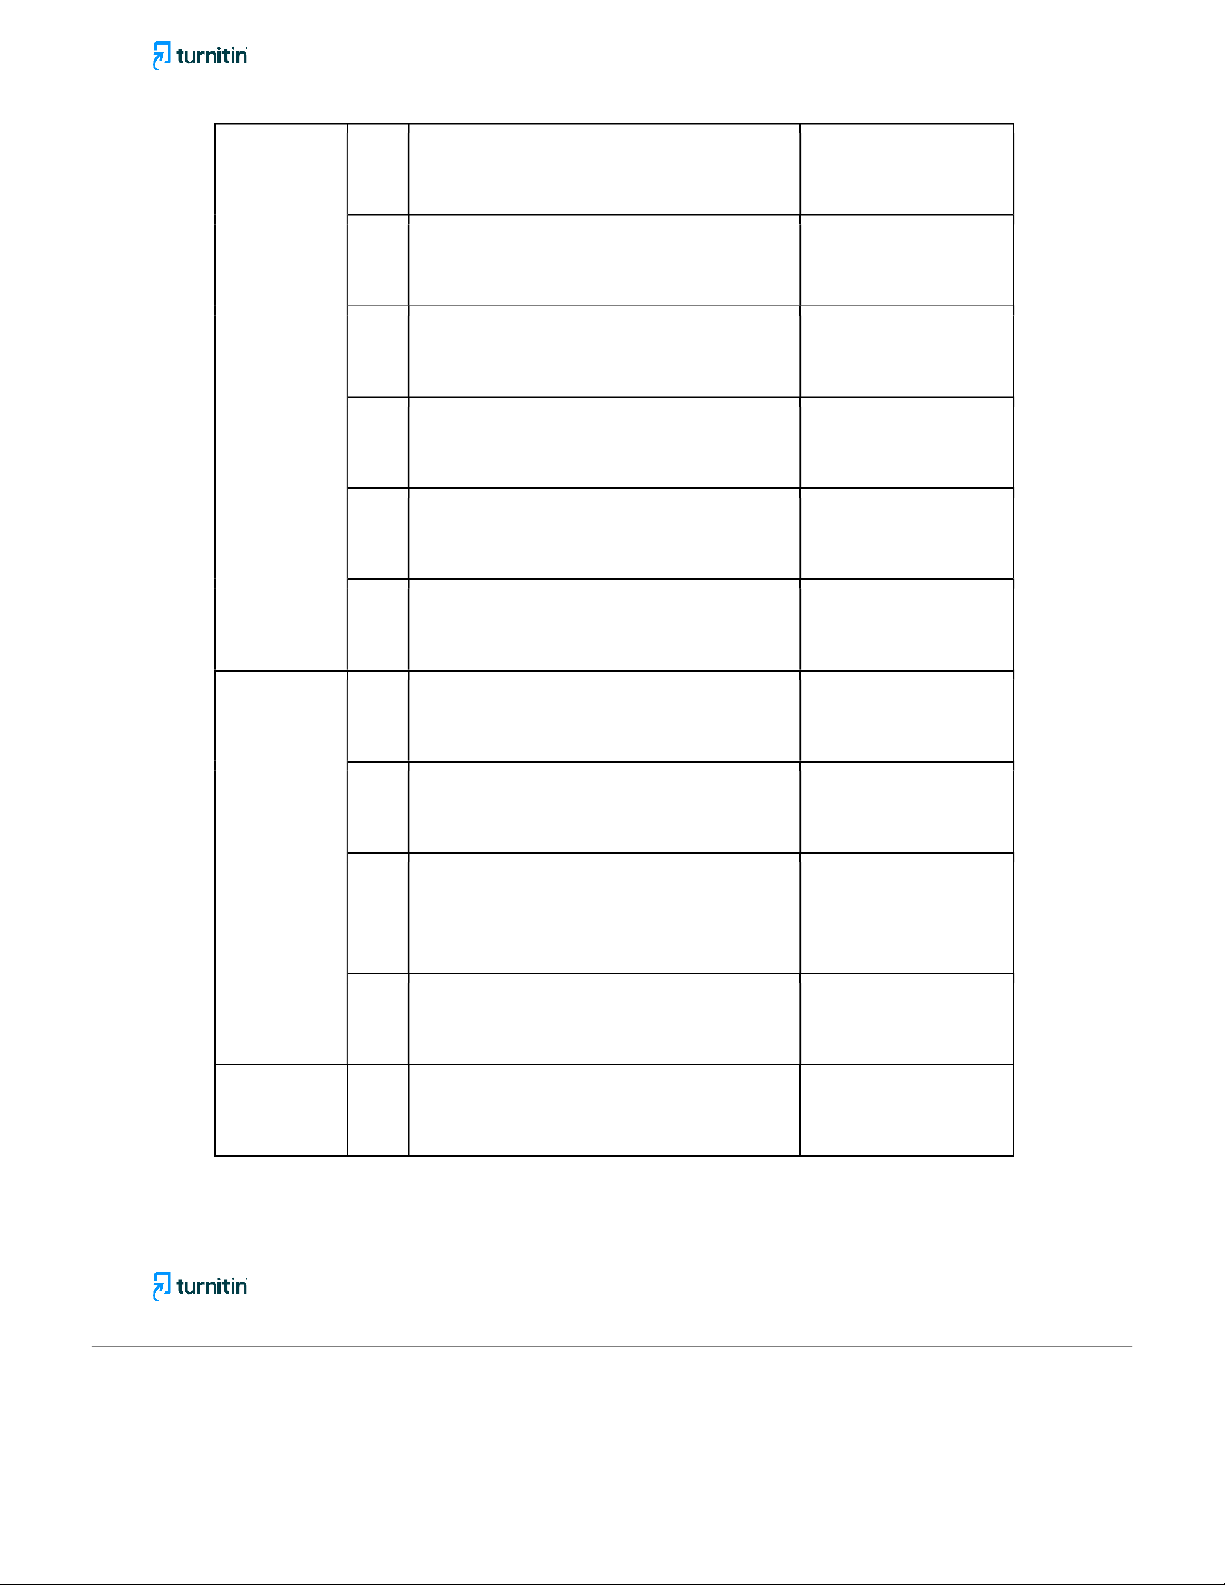
Main content: Includes questions that capture evaluation indicators for each observed variable: Factor Item Question Source Study S1
The coffee shop where I study is always Hulya & Aykut Environment clean and tidy. (2023) S2
I feel comfortable studying in a café with Heba & Ingy (2025) a spacious environment.
Page 15 of 31 - AI Writing Submission
Submission ID trn:oid:::10015:113696040
Page 16 of 31 - AI Writing Submission
Submission ID trn:oid:::10015:113696040 S3
The openness/airiness of the café helps Research team me focus more on studying. S4
I usually choose a café with fresh air to Weihong, Li, & Luca study. (2024) S5
The café I study in has enough lighting Weihong, Li, & Luca for reading and writing. (2024) S6
The café’s beautiful decoration inspires Heba & Ingy (2025) me to study. S7
Weak Wi-Fi makes me less likely to Neeti (2004) choose a café for studying. S8
The café’s Wi-Fi speed is fast enough for Sharma & Bishal me to look up materials. (2012) Noise N1
The noise level in the coffee shop where I Anahad (2013) study is not too loud. N2
Background music or ambient noise does Rachel (2012)
not distract me from studying. N3
The sound environment of the coffee shop Eggen, Heijst,
creates a comfortable study atmosphere. Hornikx, Kohlrausch (2017) N4
I prefer coffee shops with moderate noise Work in Mind (2022) levels for studying. Autonomy A1
I am completely free to choose the coffee Schneider et al. shop where I want to study. (2018)
Page 16 of 31 - AI Writing Submission
Submission ID trn:oid:::10015:113696040
Page 17 of 31 - AI Writing Submission
Submission ID trn:oid:::10015:113696040 A2
I can arrange my study schedule at the Astan (2025)
coffee shop without any constraints. A3
Studying in coffee shops gives me a sense Schneider et al.
of control over my own learning. (2018) Cost C1
The price of drinks in coffee shops is Đạt (2021)
reasonable for me when studying. C2
Drink prices influence how often I choose Research team to study in coffee shops. Academic
AP1 Studying in coffee shops helps me Gloria & Rizky Performance complete assignments on time. (2025)
AP2 I am able to understand course materials Phan & Le (2024)
more effectively when I study in coffee shops.
AP3 My productivity during study sessions in Seven Corners Coffee
coffee shops is higher than at home. (2021) 3.3 Estimation Method
The main estimation technique used in this study is the Ordinary Least Squares
method (OLS method). To ensure that the results are reliable in the presence of potential
heteroskedasticity, we adopt robust standard errors (HC1 correction). This adjustment
allows for more consistent and unbiased estimates of the coefficients’ standard errors,
then improving the validity of hypothesis testing and confidence intervals.
In addition to the baseline estimation, a series of diagnostic tests and robustness
checks are conducted to verify the appropriateness of the model and the reliability of the results:
Multicollinearity: The Variance Inflation Factor (VIF) is calculated to identify
whether independent variables are highly correlated with each other. This will
distort coefficient estimates and weaken the explanatory power of the model.
Page 17 of 31 - AI Writing Submission
Submission ID trn:oid:::10015:113696040
Page 18 of 31 - AI Writing Submission
Submission ID trn:oid:::10015:113696040
Heteroskedasticity: The Breusch-Pagan and White tests are applied to test whether
the variance of the error terms is constant. If heteroskedasticity is present, the
OLS standard errors may become inefficient; therefore, robust adjustments are required.
Normality of residuals: The Shapiro-Wilk test is used to assess whether the
distribution of the residuals approximates normality. This is important for small-
sample inference and the validity of hypothesis tests.
Non-linearity: To capture possible non-linear relationships, we include the squared
terms of selected variables (e.g., Noise², SocialPresence²) in the regression model.
This specification allows us to test if the effects of these factors follow a
curvilinear rather than a linear pattern.
Model specification: The Ramsey reset test is performed to evaluate whether the
functional form of the model is correct. A result would indicate that important
variables may have been omitted or that non-linearities are not adequately accounted for.
Through this estimation strategy and the accompanying diagnostic procedures, the
study aims to ensure that the regression model is both statistically sound and theoretically
meaningful, thereby enhancing the robustness and credibility of the empirical findings.
3.4. Descriptive Statistics and Variable Correlations
3.4.1. Descriptive Statistics of Variables
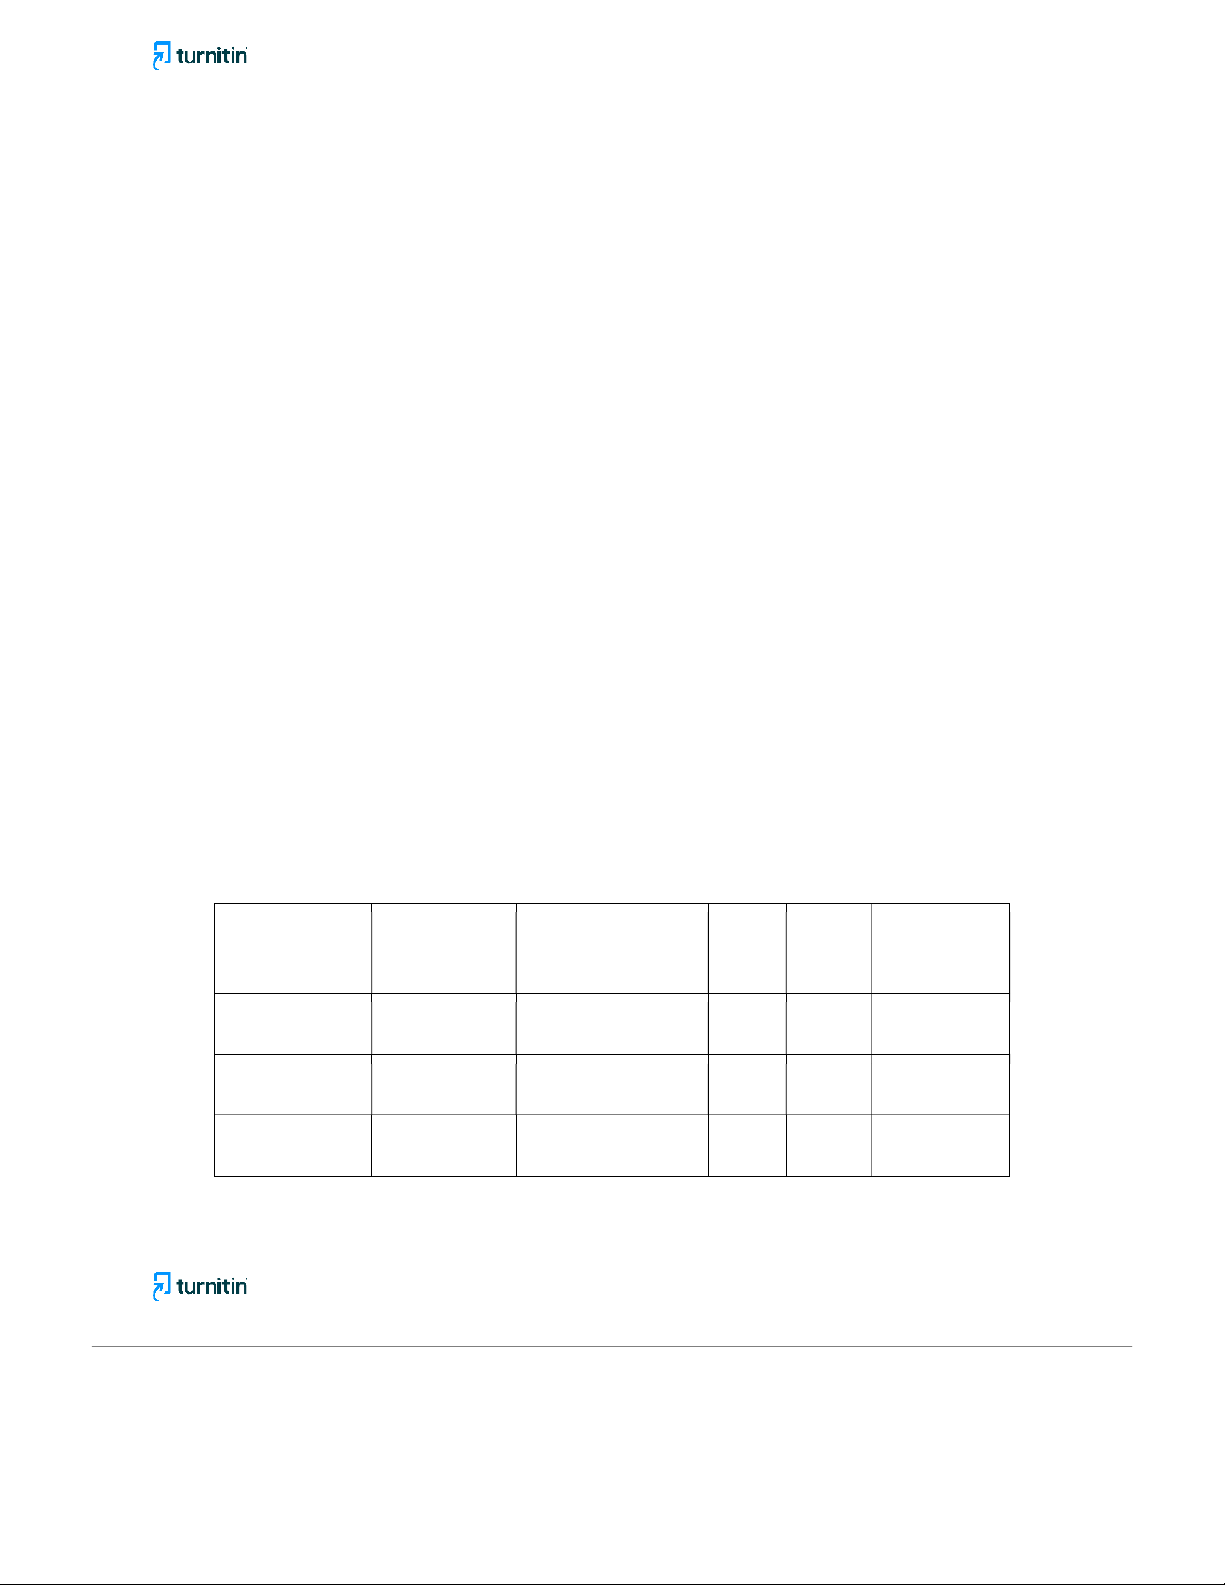
The regression analysis was conducted using STATA software with n = 328
observations. The descriptive statistics for all variables were obtained using the sum
command in STATA. The resulting summary statistics are presented in the table below:
Variables Number of observations Mean SD Min Max GPA 328 3.47 0.35 2.83 4.00 Frequency 328 6.45 2.41 0 ~16 (hours/week) Noise (1–5) 328 3.16 0.97 1 5
Page 18 of 31 - AI Writing Submission
Submission ID trn:oid:::10015:113696040
Page 19 of 31 - AI Writing Submission
Submission ID trn:oid:::10015:113696040 Autonomy (1–5) 328 3.74 0.73 1 5 StudyEnv (1–5) 328 3.95 0.58 1 5 SocialPresence (1–5) 328 3.43 0.89 1 5 Cost (1–5) 328 3.09 0.77 1 5 3.4.2. Correlation Analysis
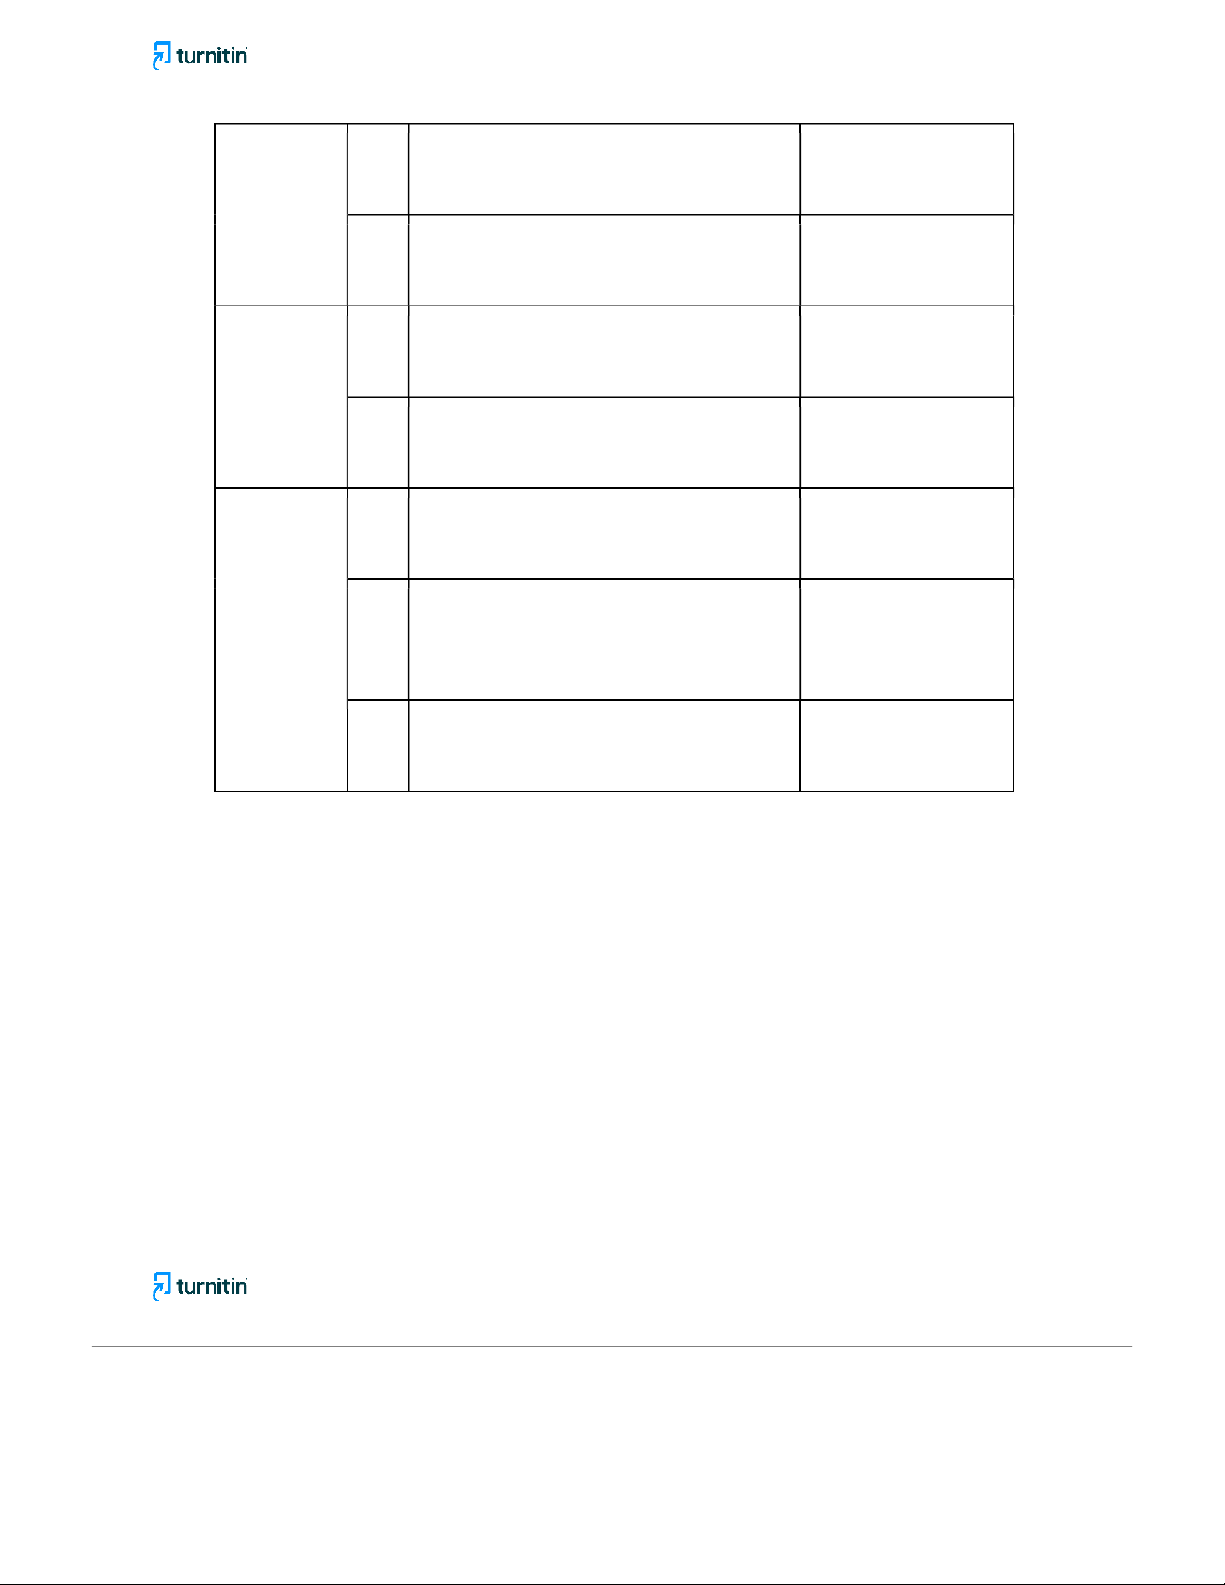
To analyze the relationships between variables, the study employed the corr
command in STATA. This command calculates the Pearson correlation matrix among all
quantitative variables included in the model.
Table 3.1 below presents the correlation coefficients between the independent
variables and the dependent variable, GPA: Variable GPA Frequency
Noise Autonomy Stud SocialPresen Cost yEnv ce GPA 1.00 Frequency 0.08 1.00 Noise -0.02 0.11 1.00 Autonomy 0.15 0.05 -0.06 1.00 StudyEnv 0.35 0.09 -0.03 0.21 1.00 SocialPresen -0.04 0.13 0.17 0.02 0.11 1.00 ce Cost -0.06 0.28 0.09 -0.02 -0.05 0.14 1.00
Page 19 of 31 - AI Writing Submission
Submission ID trn:oid:::10015:113696040
Page 20 of 31 - AI Writing Submission
Submission ID trn:oid:::10015:113696040
The correlation analysis reveals several notable relationships between GPA and the
independent variables. The strongest correlation is observed between GPA and Study
Environment (r = 0.35), which is positive and substantial. This indicates that students
who perceive their coffee shop study environment as better tend to have higher GPAs,
which aligns well with the regression results (StudyEnvironment β = 0.22, p < 0.001).
The correlation between GPA and Autonomy (r = 0.15) is mildly positive,
consistent with the positive regression coefficient (β = 0.18). Similarly, GPA and
Frequency (r = 0.08) show a small positive relationship, reflecting the small but
meaningful regression coefficient (β = 0.12) when controls are included.
GPA and Cost (r = –0.06) exhibit a slight negative correlation, matching the
regression finding (Cost β = –0.09), suggesting that higher costs are associated with lower GPAs.
For Noise (r = –0.02) and Social Presence (r = –0.04), the correlations are near
zero. This is expected because the regression model captures their nonlinear (inverted-U)
effects through the squared terms (Noise² and SocialPresence²), which linear correlation coefficients cannot detect.
Overall, the correlation matrix supports the general direction and significance of
the relationships observed in the regression analysis.
4. Estimated Results and Statistical Inferences
4.1. Research Results and Discussion
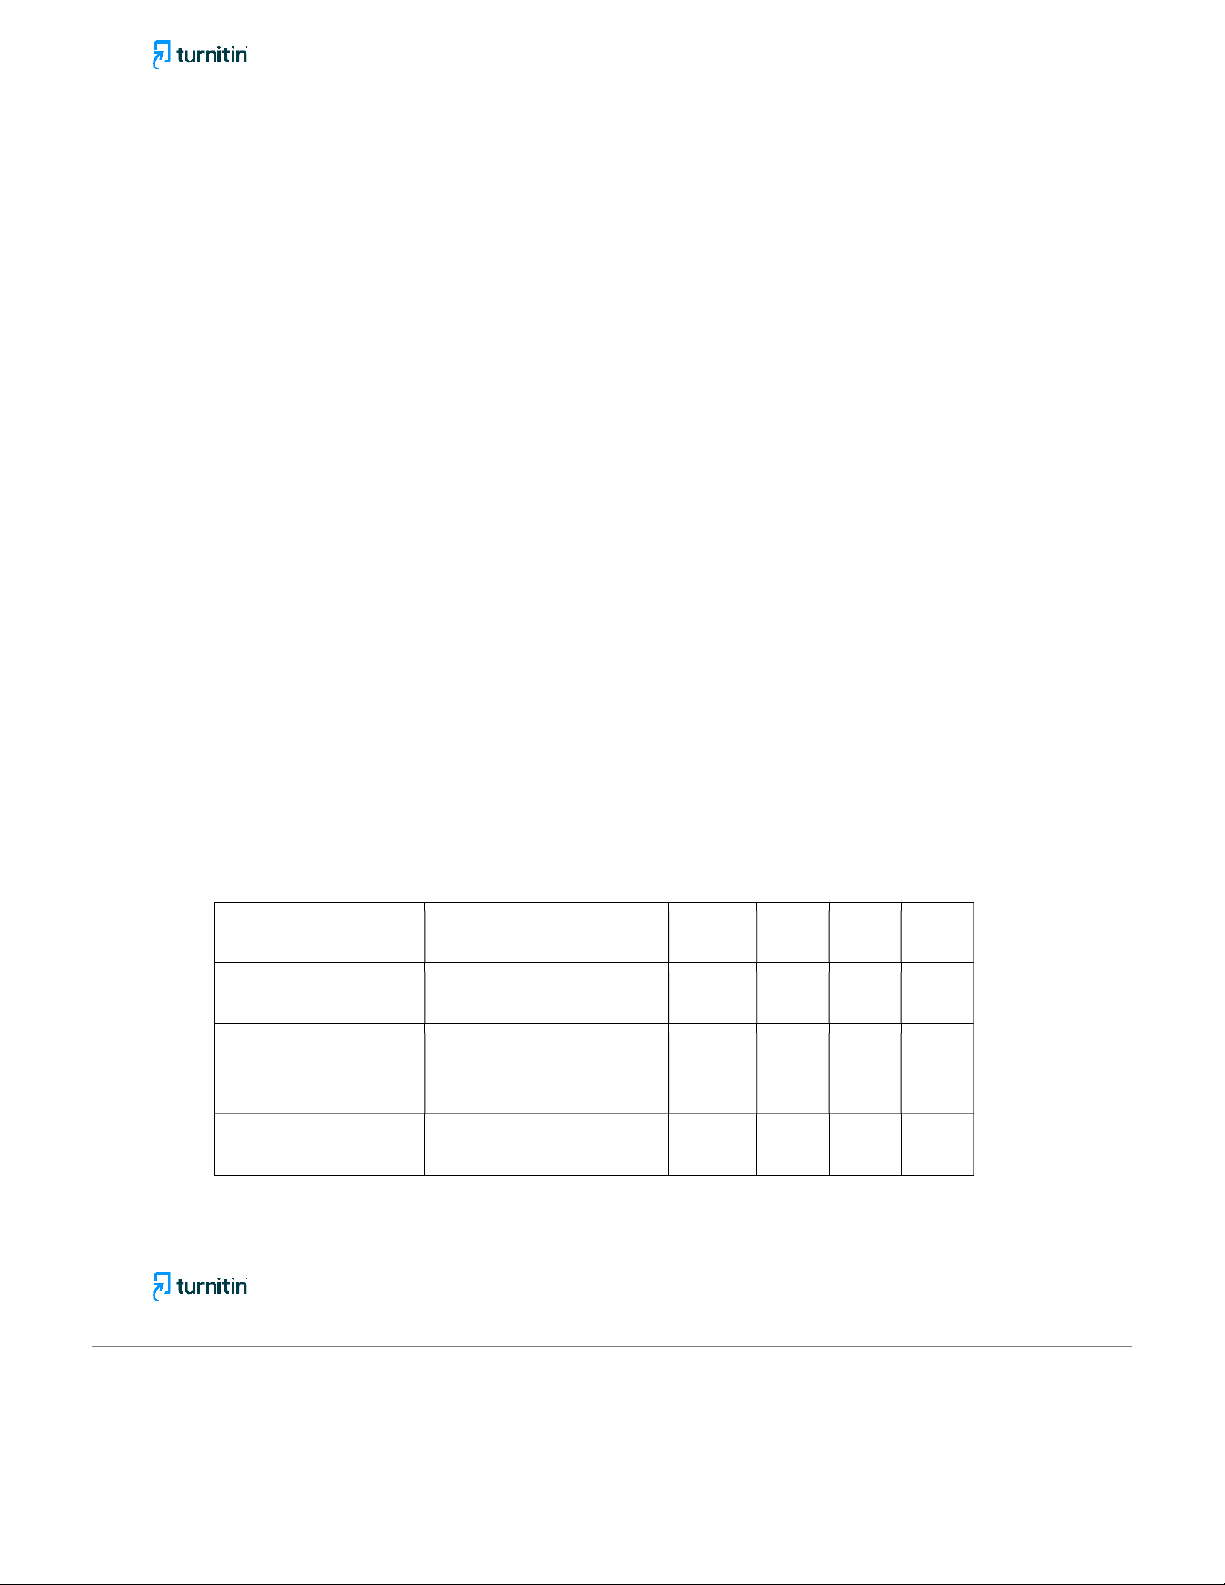
4.1.1. Regression Model Results
Table 4.1. OLS Regression Results with Robust Standard Errors (N = 328) Variable Coefficient Robust Standard t p- Expected (β) Error value Sign Constant 2.45 0.18 13.60 <0.001 – Frequency 0.012 0.007 1.71 0.089 + Noise 0.041 0.021 1.95 0.052 ±
Page 20 of 31 - AI Writing Submission
Submission ID trn:oid:::10015:113696040
Tài liệu liên quan:
-

Bảng giá trị phân phối thống kê poisson và student môn Xác suất thống kê| Trường Đại học Ngoại Thương
27 14 -

Bảng giá trị quyết định thống kê wilcoxon rank-sum test môn Xác suất thống kê| Trường Đại học Ngoại Thương
29 15 -

Bài 1 Định nghĩa cổ điển về xác suất môn Xác suất thống kê| Trường Đại học Ngoại Thương
26 13 -

Exercises for probability & statistics môn Xác suất thống kê| Trường Đại học Ngoại Thương
26 13 -

Đề thi cuối kỳ lý thuyết môn Xác suất thống kê| Trường Đại học Ngoại Thương
27 14