Tổng hợp các dạng bài tập cuối kì môn Thống kê doanh nghiệp | Học viện Báo chí và Tuyên truyền
Tổng hợp các dạng bài tập cuối kì môn Thống kê doanh nghiệp | Học viện Báo chí và Tuyên truyền. Tài liệu được sưu tầm giúp bạn tham khảo, ôn tập và đạt kết quả cao. Mời bạn đọc đón xem.
Môn: Thống kê doanh nghiệp 2 tài liệu
Trường: Học viện Báo chí và Tuyên truyền 2.8 K tài liệu
Tác giả:


Preview text:
Statistics for Business | Lecturer: Dr. N.H.Phu
TỔNG HỢP CÁC DẠNG BÀI
CÓ THỂ XUẤT HIỆN TRONG FINAL EXAM
Lưu ý: đây chỉ là các dạng bài mang tính chất tham khảo, có thể sẽ có hoặc không xuất hiện Nội dung thi:
• Chapter 6: Discrete Probability Distributions
• Chapter 7: Continuous Probability Distributions
• Chapter 8: Sampling Distributions and Estimation
• Chapter 9: One-Sample Hypothesis Tests
Hình thức: close book, các bạn được đem 1 tờ note A4 chép tay 2 mặt
Mình sẽ hong đề cập nhiều đến lý thuyết, các bạn có thể tự ôn tập lại để vững hơn nà.
----------------------------------------------------------------------------------------------------------------------------- ----------
Chapter 6: Discrete Probability Distributions
Có 2 dạng bài thường gặp:
(1) bài tập tính toán áp dụng các công thức của Binomial Distribution
(2) bài tập tính toán áp dụng các công thức của Poisson Distribution
1. Binomial Distribution
1.1. Bản chất của phân phối nhị thức (binomial distribution)
- Trong phân phối nhị thức (binomial distribution), biến ngẫu nhiên là biến rời rạc (discrete) hoặc gọi là
biến nhị phân, kết cục chỉ có 2 tình huống xảy ra: mua/không mua; bị bệnh/không bị bệnh,…
- Kết quả chỉ có hai trạng thái: thành công (success) hoặc thất bại (failure) chú ý kỹ cái này nè
1.2. Các công thức cần nhớ
(1) Công thức tính xác suất (probability) cho binomial distribution n! P(X = x) =
× πx × (1 − π)n−x, for X = 0, 1, 2, 3, 4, … , n x! × (n − x)! Trong đó: •
π = xác suất (probability) của “event of interest” thường đề sẽ cho nè •
n = sample size (number of trials or observations) •
x = number of “events of interest” in the sample
(2) Công thức tính mean, variance, và standard deviation
• Mean (Expected value) = n × π
• Variance = n × π × (1 − π)
• Standard deviation = √Variance = √n × π × (1 − π)
Để mình phân tích qua 1 ví dụ để các bạn hiểu kĩ hơn nà :)
Ví dụ 1: Biết tỉ lệ suy dinh dưỡng ở trẻ em dưới năm tuổi là 20%. Nếu chúng ta khám 10 trẻ dưới năm
tuổi. Tính xác suất để có 2 em bị suy dinh dưỡng.
Tips: khi đọc đề xong, các bạn nhớ bóc tách hết các dữ liệu liên quan đến con số á nha :))
Đề cho biết: “tỉ lệ bị suy dinh dưỡng ở trẻ em dưới năm tuổi là 20%” và đề yêu cầu chúng ta tính
“xác suất để có 2 em bị suy dinh dưỡng”
event of interest của chúng ta là “bị suy dinh dưỡng” π = 20% = 0.2
Tiếp theo, đề cho biết “chúng ta khám 10 trẻ dưới năm tuổi” n = 10 (number of observations – sample size)
Cuối cùng, đề yêu cầu chúng ta tính “xác suất để có 2 em bị suy dinh dưỡng” x = 2 (number of
“events of interest” in the sample)
Áp dụng vào công thức: 10! P(X = 2) =
× (0.2)2 × (1 − 0.2)10−2 = 0.3020 = 30.20% 2! × (10 − 2)!
Các bạn cần lưu ý điểm này nè:
Ví dụ 2: Biết tỉ lệ suy dinh dưỡng ở trẻ em dưới năm tuổi là 20%. Nếu chúng ta khám 10 trẻ dưới năm
tuổi. Tính xác suất để có 2 em không bị suy dinh dưỡng.
Đề cho biết: “tỉ lệ bị suy dinh dưỡng ở trẻ em dưới năm tuổi là 20%” và đề yêu cầu chúng ta tính “xác
suất để có 2 em không bị suy dinh dưỡng”
event of interest của chúng ta đã thay đổi, đó là “không bị suy dinh dưỡng”
xác suất “event of interest” của chúng ta không còn là 20% nữa, mà sẽ là: π = 1 − 20% = 80% = 0.8
(vì chỉ có 2 tình huống có thể xảy ra: bị suy dinh dưỡng và không bị suy dinh dưỡng)
Sau đó, áp dụng vào công thức: 10! P(X = 2) =
× (0.8)2 × (1 − 0.8)10−2 = 0.0074 = 7.4% 2! × (10 − 2)!
Tuy nhiên, có bạn sẽ tư duy là: đề yêu cầu tính “xác suất để có 2 em không bị suy dinh dưỡng”. Hay
nói cách khác, chúng ta có thể hiểu là nếu có đúng chính xác 2 em không bị suy dinh dưỡng, thì có
phải là trong 10 em được khám, thì sẽ có 8 em bị suy dinh dưỡng!? Cùng kiểm tra nè: 10! P(X = 8) =
× (0.2)8 × (1 − 0.2)10−8 = 0.0074 = 𝟕. 𝟒% 8! × (10 − 8)!
Hai kết quả giống nhau hen :) Nếu áp dụng lối tư duy này thì bạn sẽ hong cần tính tỉ lệ (xác suất)
“events of interest” lại đâu nè, nhưng đôi lúc sẽ gây nhầm lẫn khi áp dụng cách này, vì những sem
trước có 1 vài bạn bị mắc lỗi này nên mình muốn phân tích kĩ để các bạn hiểu sâu hơn và tránh bị sai trong bài thi nè.
1.3. Bài tập vận dụng
Binomial distribution thường được áp dụng trong các dạng bài tập mà kết quả của một phép thử chỉ có
hai khả năng, chẳng hạn như "thành công/thất bại," "đúng/sai," hoặc "xảy ra/không xảy ra.
Exercise: In the Ardmore Hotel, 20 percent of the customers pay by American Express credit card.
Of the next 10 customers, what is the probability that:
(a) None pay by American Express credit card?
(b) At least two customers who pay by American Express credit card?
(c) Fewer than three customers who pay by American Express credit card?
(d) What is the expected number who pay by American Express credit card?
(e) Find the variance and standard deviation. Solution
(a) None pay by American Express credit card.
20 percent of the customers pay by American Express credit card π = 20% = 0.2
Of the next 10 customers n = 10
None pay by American Express credit card x = 0 10! P(X = 0) =
× (0.2)0 × (1 − 0.2)10−0 = 0.1074 = 10.74% 0! × (10 − 0)!
(b) At least two customers who pay by American Express credit card.
- Các bạn chú ý, khi gặp câu hỏi có “at least, more than, fewer than,…” – có sự liên quan đến lớn
hơn, thấp hơn, lớn hơn hoặc bằng, hay thấp hơn hoặc bằng nghĩ liền đến Compound event.
- Còn các câu hỏi mà hỏi chính xác bao nhiêu, ví dụ như không có khách hàng nào (như câu a), 1
khách hàng, hay 2 khách hàng,… đây là Single event.
at least two customers P(X ≥ 2) = P(X = 2) + P(X = 3) + ⋯ + P(X = 10)
Tuy nhiên, bạn chú ý là mình vẫn tính theo biểu thức trên được nhưng sẽ tốn nhiều thời gian để tính
xác suất của các outcomes riêng lẻ (2 customers, 3, customers,…).
Do đó, chúng ta áp dụng “Complement rule” ngay: P (A) + P (not A) = 1 P(X ≥ 2) + P(X < 2) = 1
at least two customers P(X ≥ 2) = 1 − P(X < 2) = 1 − P(X = 0) − P(X = 1) • 10! P(X = 0) =
× (0.2)0 × (1 − 0.2)10−0 = 0.1074 0!×(10−0)! • 10! P(X = 1) =
× (0.2)1 × (1 − 0.2)10−1 = 0.2684 1!×(10−1)!
P(X ≥ 2) = 1 − 0.1074 − 0.2684 = 0.6242 = 𝟔𝟐. 𝟒𝟐%
(c) Fewer than three customers who pay by American Express credit card.
Fewer than three P(X < 3) = P(X = 0) + P(X = 1) + P(X = 2) • 10! P(X = 0) =
× (0.2)0 × (1 − 0.2)10−0 = 0.1074 0!×(10−0)! • 10! P(X = 1) =
× (0.2)1 × (1 − 0.2)10−1 = 0.2684 1!×(10−1)! • 10! P(X = 2) =
× (0.2)2 × (1 − 0.2)10−2 = 0.3020 2!×(10−2)!
P(X < 3) = 0.1074 + 0.2684 + 0.3020 = 0.6778 = 𝟔𝟕. 𝟕𝟖%
(d) The expected number who pay by American Express credit card.
Các bạn thấy “expected number” là áp dụng công thức của mean liền nhe.
• Mean = n × π = 10 × 0.2 = 2 (customers)
(e) Find the variance and standard deviation.
• Variance = n × π × (1 − π) = 10 × 0.2 × (1 − 0.2) = 1.6 (customers)
• Standard deviation = √Variance = √n × π × (1 − π) = √1.6 = 1.2649 (customers)
2. Poisson Distribution
2.1. Bản chất của phân phối Poisson
- Phân phối này cho biết xác suất của một sự kiện xảy ra một số lần nhất định trong một khoảng thời
gian hoặc không gian nhất định.
2.2. Các công thức cần nhớ của phân phối Poisson
(1) Công thức tính xác suất (probability) cho Poisson distribution 𝑒−𝜆 × 𝜆𝑥 𝑃(𝑥) = 𝑥! Trong đó:
• 𝑥 = number of events in an area of opportunity
• 𝜆 = expected value (mean) of number of events
• 𝑒 = base of the natural logarithm system (2.71828…)
(2) Công thức tính mean, variance, và standard deviation
• Mean (Expected value) = 𝜆 • Variance = 𝜆
• Standard deviation = √Variance = √𝜆
2.3. Bài tập vận dụng
Một số dấu hiệu để bạn nhận ra dạng bài của Poisson distribution nè: đề cung cấp giá trị “average” ở
dạng số (not percent), đề sẽ cho 1 khoảng thời gian (ví dụ ngày, tháng, năm).
Đây chỉ là tips để nhận ra dạng bài nhanh thoi nhen :D
Exercise: Anne is concerned about staffing needs at the Starbucks that she manages. She has specific
questions about the probability distribution of customer arrivals at her store. Anne believes that the
typical Starbucks customer averages 18 visits to the store over a 30-day month. She has the following questions:
(a) How many visits should Anne expect in a 5-day period from a typical Starbucks customer?
(b) What is the probability that a customer visits the chain five times in a 5-day period?
(c) What is the probability that a customer visits the chain no more than two times in a 5-day period?
(d) What is the probability that a customer visits the chain at least three times in a 5-day period?
(f) Calculate the expected value, variance, standard deviation? Solution
(a) How many visits should Anne expect in a 5-day period from a typical Starbucks customer?
Đề cho chúng ta biết trung bình có 18 lần khách ghé cửa hàng trong khoảng thời gian là 30 ngày (1
tháng): “typical Starbucks customer averages 18 visits to the store over a 30-day month”
Đề hỏi chúng ta vậy thì trong khoảng thời gian là 5 ngày thay vì 30 ngày, thì số lần trung bình khách
ghé cửa hàng là bao nhiêu. Ta có:
Khoảng thời gian 30 ngày 18 lần
Khoảng thời gian 5 ngày 5 ×18 = 3 lần (quy tắc tam xuất) 30
LƯU Ý COI CHỪNG “RED FLAG” NÈ!! :)))
Ở đây là may mắn người ta hỏi các bạn tính khoảng thời gian (a 5-day period) mà mình sẽ áp dụng
xuyên suốt các câu hỏi tiếp theo á. Nên các bạn chú ý là khoảng thời gian ở đề bài đã cho và khoảng
thời gian trong câu hỏi phải nhất quán với nhau nha.
Vì với khoảng thời gian 30 ngày, số lần trung bình khách ghé cửa hàng, 𝜆 = 18.
Còn với khoảng thời gian 5 ngày, số lần trung bình khách ghé cửa hàng, 𝜆 = 3.
Các bạn chú ý thật kĩ nha vì có thể bị sai ở phần tính probability nếu xác định λ sai á.
b) What is the probability that a customer visits the chain five times in a 5-day period?
5-day period, λ = 3 (câu a)
a customer visits the chain five times 𝑥 = 5 Áp dụng công thức: 𝑒−𝜆 × 𝜆𝑥 𝑒−3 × 35 𝑃(𝑥 = 5) = =
= 0.1008 = 𝟏𝟎. 𝟎𝟖% 𝑥! 5!
(c) What is the probability that a customer visits the chain no more than two times in a 5-day period?
no more than two times P(x ≤ 2)
P(x ≤ 2) = P(x = 0) + P(x = 1) + P(x = 2) 𝑒−3×30 P(x = 0) = = 0.0498 0! 𝑒−3×31 P(x = 1) = = 0.1494 1! 𝑒−3×32 P(x = 2) = = 0.2240 2!
P(x ≤ 2) = 0.0498 + 0.1494 + 0.2240 = 0.4232 = 𝟒𝟐. 𝟑𝟐%
(d) What is the probability that a customer visits the chain at least three times in a 5-day period?
at least three times P(x ≥ 3) = P(x = 3) + P(x = 4) + P(x = 5) + ⋯
Vì vậy, chúng ta áp dụng “Complement rule” ngay: P (A) + P (not A) = 1
P(x ≥ 3) = 1 − P(x < 3) = 1 − P(x = 0) − P(x = 1) − P(x = 2)] 𝑒−3×30 P(x = 0) = = 0.0498 0! 𝑒−3×31 P(x = 1) = = 0.1494 1! 𝑒−3×32 P(x = 2) = = 0.2240 2!
P(x ≥ 3) = 1 − 0.0498 − 0.1494 − 0.2240 = 0.5768 = 𝟓𝟕. 𝟔𝟖%
(f) Calculate the expected value, variance, standard deviation?
• Mean (Expected value) = 𝜆 = 3 (visits)
• Variance = 𝜆 = 𝟑 (visits)
• Standard deviation = √Variance = √𝟑 (visits)
3. Dạng bài xác định công thức (cho sẵn) có phù hợp để dùng cho tính xác suất hay không
Dạng bài này xuất hiện cách đây khoảng 4 học kỳ rồi, nhưng mình nghĩ là các bạn nên xem qua để
nắm kĩ hơn và nếu đề có ra thì mình vẫn làm được hen.
Ví dụ: Đề cho bạn hàm số x F(x) =
, với x = 0, 1, 2, 3 và 4 (các possible outcomes). Đề hỏi là liệu hàm 10
số F(x) này có phù hợp để dùng cho tính xác suất hay không?
Để hàm số phù hợp dùng cho tính xác suất, có 2 điều kiện cần thỏa mãn. Nếu 1 trong số 2 điều
kiện không thỏa mãn thì hàm số đã cho không phù hợp.
(1) Điều kiện thứ nhất, xác suất của từng outcome, P(x) = F(x) thỏa mãn: 𝟎 ≤ 𝐅(𝐱) ≤ 𝟏 (*)
Ta thay các outcome, x = 0, 1, 2, 3 và 4 vào hàm số F(x):
• P (0) = 0 = 0 thỏa mãn điều kiện (*) 10
• P (1) = 1 = 0.1 thỏa mãn điều kiện (*) 10
• P (2) = 2 = 0.2 thỏa mãn điều kiện (*) 10
• P (3) = 3 = 0.3 thỏa mãn điều kiện (*) 10
• P (4) = 4 = 0.4 thỏa mãn điều kiện (*) 10
(2) Điều kiện thứ hai, Tổng của xác suất của từng outcome phải bằng 1
Ta có: P (0) + P (1) + P (2) + P (3) + P (4) = 0 + 0.1 + 0.2 + 0.3 + 0.4 = 1 (thỏa mãn điều kiện)
Kết luận: Vậy hàm số trên phù hợp dùng để tính xác suất.
----------------------------------------------------------------------------------------------------------------------------- ----------
Chapter 7: Continuous Probability Distributions
Dạng bài thường gặp nhất là liên quan đến Standard Normal Distribution. Còn Exponential
Distribution thì các bạn đọc thêm ha.
1. Standard Normal Distribution
- The standard normal distribution, also cal ed the z-distribution, is a special normal distribution where
the mean is 0 and the standard deviation is 1.
- Normal distribution can be standardized by converting its values into z scores.
1.1. Công thức liên quan đến Standard Normal Distribution X − μ Z − score = σ Trong đó,
• X = giá trị mà mình muốn chuẩn hóa (từ normal distribution sang standard normal distribution) • μ = population mean
• σ = population standard deviation
• Z − score = giá trị của X sau khi được chuẩn hóa
1.2. Các dạng bài liên quan đến Standard Normal Distribution
Dạng bài phổ biến nhất là tính probability khi đề cho population mean và population standard
deviation (áp dụng z-score và tra bảng z-table). Lưu ý là các bạn phải nắm thật kĩ cách tra bảng z- table nha.
Exercise 1: The number of books borrowed from a university library is assumed to follow a normal
distribution. It is assumed that the population average number of books borrowed is 14 books, and the
population standard deviation is 6 books.
(a) Find the probability that a randomly selected student borrowed between 12 and 18 books.
(b) Find the probability that a randomly selected student borrowed greater than 37 books. Solution
(a) Find the probability that a randomly selected student borrowed between 12 and 18 books.
Between 12 and 18 books P (12 < X < 18) μ = 14 ; σ = 6 Standardizing process: P ( 12−14 18−14 12 < X < 18) = P ( < Z < ) 6 6
= P(−0.33 < Z < 0.67) = P(Z < 0.67) − P(Z < −0.33)
= 0.7486 − 0.3707 = 0.3779 = 37.79% Chú ý: •
1 lưu ý nhỏ là trong các dạng bài của continuous probability distribution thì dấu ≥ hay > thì về bản chất sẽ không khác
biệt (khác với discrete probability distribution). Nên ở đây bạn P (12 < X < 18) hay P (12 ≤ X ≤ 18) thì vẫn được nha!! •
1 lưu ý nữa là tất cả các phép tính mình làm, mình đều quy về dạng: less than z – ví dụ P( Z < −1.96) = 0.0250 (Bảng
cummulative standard normal distribution) Đây chỉ là phong cách của mình dùng thoi, bạn cũng có thể dùng bảng
between 0 and z vẫn được nhé :)
(b) Find the probability that a randomly selected student borrowed greater than 37 books.
Greater than 37 books P ( X > 37) μ = 14 ; σ = 6 Standardizing process: P ( 37−14 X > 37) = P ( Z >
) = P(Z > 3.83) = 1 − P(< 3.83) = 1 − 100% = 0% 6
Sau đó, chúng ta tra bảng Z-table với giá trị 3.83. Tuy nhiên chúng ta lại hong thấy giá trị này nằm trên bảng Z-table . Thì 1 chú ý là:
Nếu giá trị của Z-score càng lớn (tiến về dương vô cùng), thì probability của nó sẽ là 100%.
Nên: P(Z < 3.83) = 𝟏𝟎𝟎%
Vô thi thì nếu các bạn gặp trường hợp này thì chỉ cần ghi 100% thoi hong cần giải thích gì dài dòng nè. Tương tự:
Nếu giá trị của Z-score càng nhỏ (tiến về âm vô cùng), thì probability của nó sẽ là 0%.
Exercise 2: I am considering to invest my money in stock markets. The monthly performance for each
stock is provided in the fol owing table. Assume that average returns are normally distributed. You are my financial advisor. Stock Average returns (%) Standard deviation (%) A 11 17 B 7 5
a) To minimize the probability of losing money next month, which stock should I choose?
b) Which stock should I select if my expected returns are at least 5%?
c) Which stock should I choose if my expected returns are between 7% and 10%? Solution
a) To minimize the probability of losing money next month, which stock should I choose?
Ở đây đề muốn giảm thiểu rủi ro mất tiền, vì thì ta phải tính probability nếu mất tiền (0% return) là bao
nhiêu, sau đó lựa chọn phương án mang lại xác suất mất tiền thấp hơn. For stock A: 0−11 P(X < 0) = P (Z <
) = P(Z < −0.65) = 0.2578 = 25.78% 17 For stock A: 0−7 P(X < 0) = P (Z <
) = P(Z < −1.4) = 0.0808 = 𝟖. 𝟎𝟖% 5 Selection: Stock B
b) Which stock should I select if my expected returns are at least 5%? For stock A: 5−11 P(X > 5) = P (Z >
) = P(Z > −0.35) = 1 − P(Z < −0.35) = 63.68% 17 For stock A: 5−7 P(X > 5) = P (Z >
) = P(Z > −0.4) = 1 − P(Z < −0.4) = 𝟔𝟓. 𝟓𝟒% 5 Selection: Stock B
c) Which stock should I choose if my expected returns are between 7% and 10%? For stock A: 7−11 10−11 P(7 < X < 10) = P ( < Z <
) = P(Z < −0.1) – P(Z < −0.23) = 9.10% 17 17 For stock A: 7−7 10−7 P(7 < X < 10) = P ( < Z <
) = P(Z < 0.6)– P(Z < 0.5) = 𝟐𝟐. 𝟓𝟕% 5 5 Selection: Stock B
2. Exponential Distribution (Đọc thêm)
----------------------------------------------------------------------------------------------------------------------------- ----------
Chapter 8: Sampling Distributions and Estimation
Chap này dễ gây lú nè hu hu (T.T)
Có 3 dạng bài cần lưu ý:
(1) Tính probability liên quan đến sampling distribution of sample mean, 𝐱̅ hoặc sampling distribution of sample proporation, P
̂. (dạng này ít khi gặp lắm nè)
(2) Tính khoảng tin cậy - confidence interval. (dạng này gặp nhiều nè – sem nào cũng có lun :D)
(3) Xác định sample size tối thiểu. (dạng này cũng hay gặp lắm)
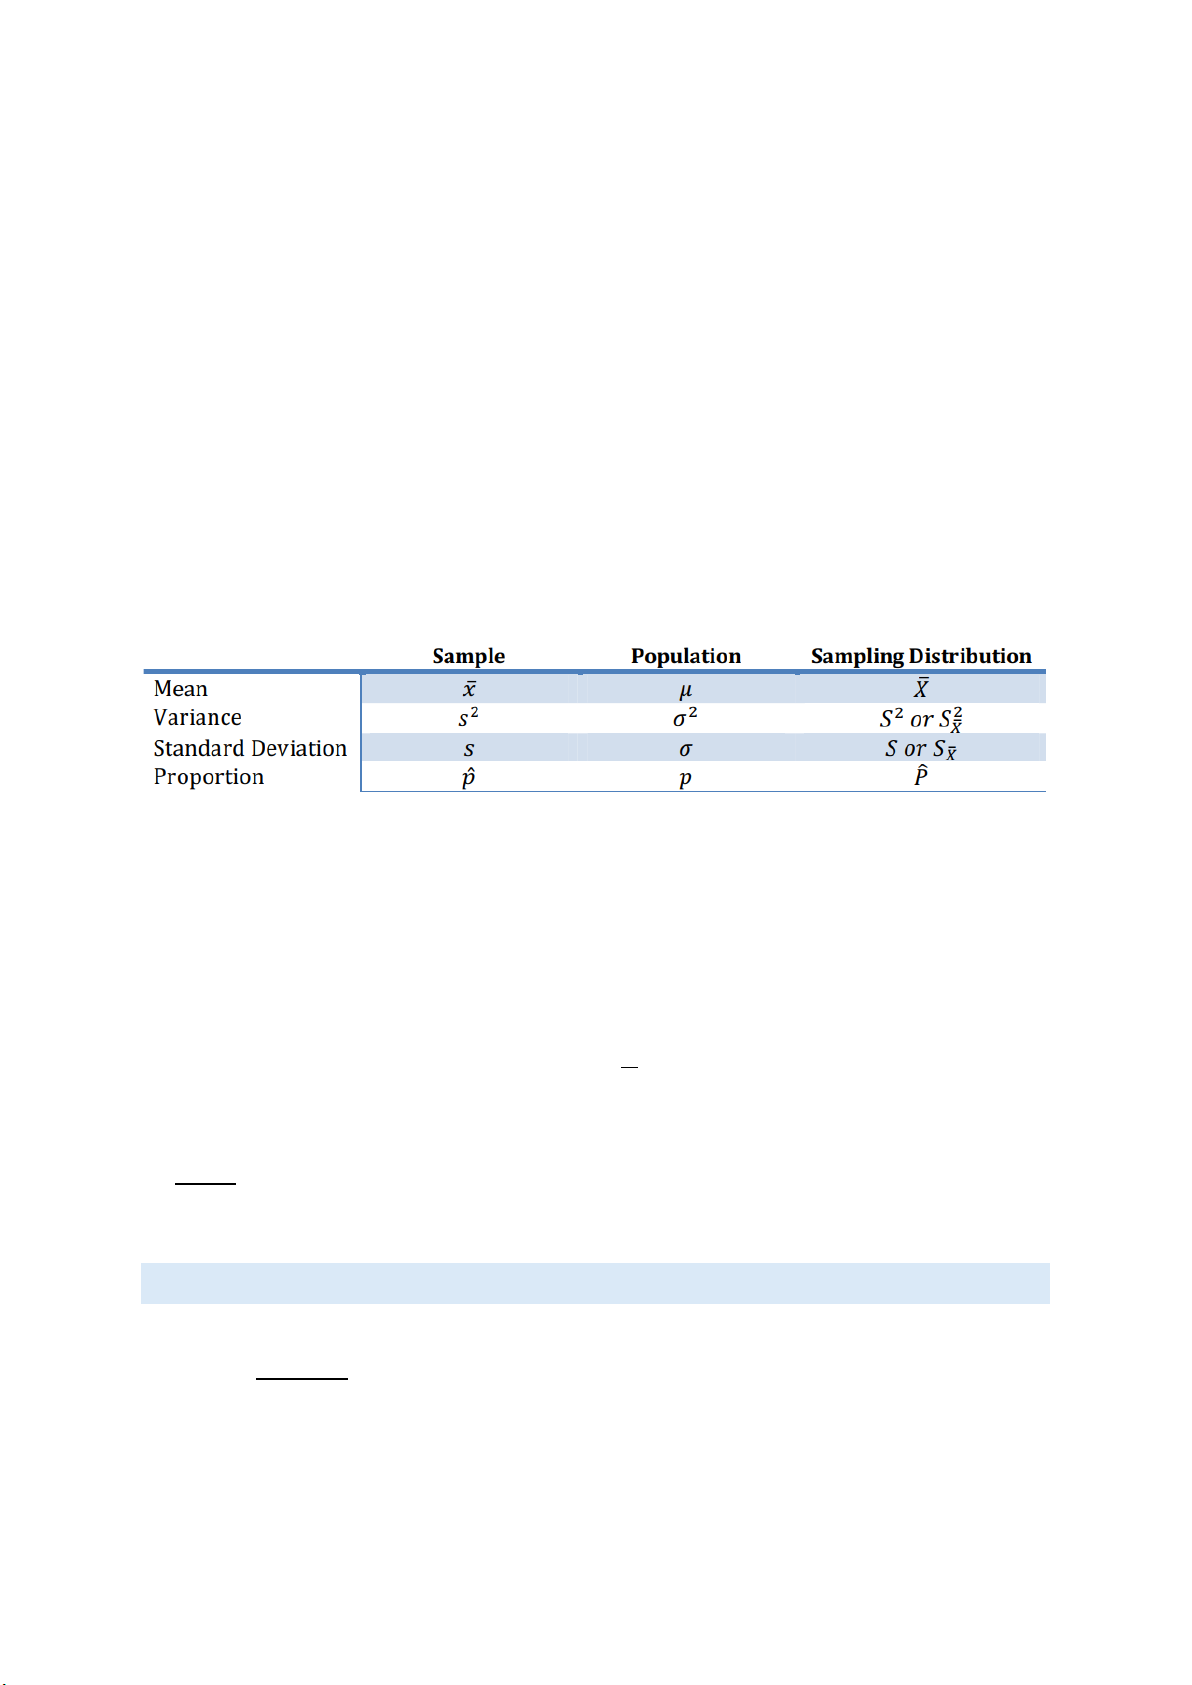
1. Sampling and Sampling Distribution
Nhớ chú ý kí hiệu nha, dễ lú lắm í :>
1.1. Sampling distribution of sample mean, 𝒙 ̅
When sampling is done from a normal distribution with mean (𝛍) and standard deviation (𝛔), the sample mean (𝒙
̅) has a normal sampling distribution: σ2 X ̅ ~ N(μ, ) n
Có 3 case để các bạn áp dụng các công thức liên quan đến Sampling distribution of sample mean. Case 1
• The population is normal y distributed.
• The population standard deviation σ is known. Then we use:
• z – distribution (standard normal distribution) • population mean: μ • standard deviation: σ √n
Ví dụ: Japan’s birthrate is believed to be 1.57 per woman. Assume that the population is normally
distributed and the population standard deviation is 0.4. If a random sample of 200 women is selected,
what is the probability that the sample mean wil fall between 1.52 and 1.62? Solution
The population is normally distributed and the population standard deviation is known. use z – distribution
μ = 1.57 ; σ = 0.4 ; n = 200
sample mean wil fal between 1.52 and 1.62 P(1.52 < X ̅ < 1.62) 1.52 −1.57 1.62 −1.57 P(1.52 < X ̅ < 1.62) = P ( 0.4 < Z < 0.4
) = P(−1.77 < Z < 1.77) √200 √200
= P(Z < 1.77) − P(Z < −1.77) = 0.9616 − 0.0384 = 𝟗𝟐. 𝟑𝟐%
Lưu ý: bạn đừng lo lắng nếu kết quả hơi khác với đáp án 1 xíu nè, ví dụ bạn ra kết quả là 92.29%, vì sẽ có sự sai số 1 xíu sẽ
hong sao đâu nha :D Nhưng đừng lệch quá nhiều là được, ví dụ đáp án là 92.32 mà bạn ra 120.25 là xu cà na nha :)))))) Case 2
• The population is normal y distributed.
• The population standard deviation σ is unknown.
• The sample size is small, n < 30 Then we use:
• t – distribution (student distribution)
Tuy nhiên, khó có thể tính xác suất của t – distribution với 1 giá trị cho sẵn. Nên case này sẽ không xuất hiện đâu nha. Case 3
• The population is normal y distributed.
• The population standard deviation σ is unknown.
• The sample size is large, n ≥ 30 Then we use: • z – distribution • population mean: μ
• standard deviation: s where s = sample standard deviation √n
Ví dụ: A random sample with size 36 is taken from a normal population having mean µ = 25, standard
deviation is unknown. Sample standard deviation is s = 4.35. Assume the population is normally
distribution, find the probability that sample mean is at least 19.5? Solution
The population is normally distributed and the population standard deviation is unknown.
However, the sample size is large enough, n = 36 (n ≥ 30) use z – distribution
μ = 25 ; s = 4.35 ; n = 36
sample mean is at least 19.5 P( X ̅ ≥ 19.5) 19.5 −25 P( X
̅ ≥ 19.5) = P (Z ≥ 4.35 ) = P(Z ≥ −7.59) = 1 − P(Z < −7.59) = 1 − 0 = 𝟏𝟎𝟎% √36
1.2. Sampling distribution of sample proportion, 𝑷 ̂
Khi bắt đầu giải các bài toán liên quan đến proportion, có 2 điều kiện các bạn phải kiểm tra xem có thỏa
mãn hay không, nếu có thì mới tiếp tục được í :D
The sampling distribution of the sample proportion 𝑷
̂ is based on the binomial distribution with
parameters n and p, where n = the sample size and p = population proportion.
Conditions: 𝐧 × 𝐩 > 𝟓 𝐚𝐧𝐝 𝐧 × (𝟏 − 𝐩) > 𝟓 use z – distribution
Một số công thức liên quan đến sample proportion: • Mean = p
• Standard deviation = √p(1−p) n
• To find the probability with given values, use the formula: P ̂ − p Z = √p(1 − p) n
• To find the values with given the probability, use the formula: p(1 − p) P ̂ = p ± z × √ n
Ví dụ: When sampling is done for the proportion of defective items in a large shipment, where the
population proportion is 0.18 and the sample size is 200, what is the probability that the sample
proportion wil be at least 0.20? Solution n = 200; p = 0.18
Điều kiện: n × p > 5 và n × (1 − p) > 5
Ta có: n × p = 200 × 0.18 = 36 > 5 (thỏa mãn)
n × (1 − p) = 200 × (1 − 0.18) = 164 > 5 (thỏa mãn)
Sample proportion wil be at least 0.20 P(P ̂ ≥ 0.20) Standardize: 0.20−0.18 P(P ̂ ≥ 0.20) = P (Z ≥
) = P(Z ≥ 0.74) = 1 − P(Z < 0.74) √0.18(1−0.18) 200
= 1 – 0.7704 = 22.96% 2. Confidence Interval
2.1. Determine a confidence interval for population mean 𝝁
Note: The population is normally distributed (or the population is assumed normal)
Có 3 trường hợp để bạn xác định sẽ áp dụng z – distribution hay t – distribution Case 1
• The population is normal y distributed.
• The population standard deviation σ is known. Then we use: • z – distribution (zα) 2 • standard deviation: σ √n 𝜎
𝐶𝐼 (𝑓𝑜𝑟 𝜇) = 𝑥̅ ± zα × 2 √𝑛
Ví dụ: A real estate agent needs to estimate the average value of a residential property of a given size
in a certain area. The real estate agent believes that the standard deviation of the property values is σ
= $5,500 and that property values are approximately normally distributed. A random sample of 16 units
gives a sample mean of $89,673.12. Determine a 95% confidence interval for the average value of all properties of this kind. Solution
The population is normal y distributed and the population standard deviation is known. use z – distribution σ = $5,500 n = 16 x̅ = 89,673.12
95% confidence level zα = 1.96 (critical value) 2 σ 5,500 CI = x̅ ± zα × = 89,673.12 ± 1.96 × 2 √n √16
So, CI = [86,978.12 ; 92,368.12] Case 2
• The population is normal y distributed.
• The population standard deviation σ is unknown.
• The sample size is small, n < 30 Then we use:
• t – distribution (t α) , where df = n − 1 df,2
• standard deviation: s , where s = sample standard deviation √n 𝑠
𝐶𝐼 (𝑓𝑜𝑟 𝜇) = 𝑥̅ ± t α × df,2 √𝑛
Ví dụ: The manufacturer of batteries used in small electric appliances wants to estimate the average
life of a battery. A random sample of 12 batteries yields 𝑥̅ = 34.2 hours and 𝑠 = 5.9 hours. Determine
a 95% confidence interval for the average life of a battery. Solution
Assume the population is normal y distributed.
The population standard deviation is unknown.
The sample size is small, n < 30 (n = 12) use t – distribution 𝑥̅ = 34.2 𝑠 = 5.9
n = 12 df = 12 – 1 = 11
95% confidence level α = 0.025 t 2 11, 0.025 = 2.201 s 5.9 CI = x̅ ± t α × = 34.2 ± 2.201 × df,2 √n √12
So, CI = [30.45 ; 37.45] Case 3
• The population is normal y distributed.
• The population standard deviation σ is unknown.
• The sample size is large, n ≥ 30 Then we use:
• z – distribution (follow Central Limit Theorem)
• standard deviation: s , where s = sample standard deviation √n 𝑠
𝐶𝐼 (𝑓𝑜𝑟 𝜇) = 𝑥̅ ± zα × 2 √𝑛
Ví dụ: To aid in planning the development of a tourist shopping area, a state agency wants to estimate
the average dollar amount spent by a tourist in an existing shopping area. A random sample of 56
tourists gives 𝑥̅ = $258 and 𝑠 = $85. Determine a 95% confidence interval for the average amount spent
by a tourist at the shopping area. Solution
Assume the population is normal y distributed.
The population standard deviation is unknown.
The sample size is large, n ≥ 30 (n = 56)
follow Central Limit Theorem (CLT) use z – distribution 𝑥̅ = 258 𝑠 = 85 n = 56
95% confidence level zα = 1.96 2 s 85 CI = x̅ ± zα × = 258 ± 1.96 × 2 √n √56
So, CI = [235.74 ; 280.26]
CHÚ Ý CÁI NÌ NÈ :)))))
Để tiết kiệm thời gian thì khi đề cho level of confidence (e.g: 90%, 95%, 99% confidence…) hoặc level
of significance (e.g: 10%, 5%, 1%...) thì các bạn được quyền suy ra critical value luôn. Ở đây thì mình
cung cấp critical value sẵn để các bạn ghi luôn cho nhanh nà :D – Áp dụng cho z – distribution nha
3 level of confidence thường gặp nhất Confidence Interval
Level of confidence (1- α)
Level of significance (α) zα 2 90% 10% ±1.645 95% 5% ±1.96 99% 1% ±2.58
Exercise: Bach Hoa Xanh is considering opening a new store at a certain location. To make the store
profitable, Bach Hoa Xanh estimates that average weekly sales must be at least $250,000. Before
investing in the new store, Bach Hoa Xanh estimates weekly gross sales at nearby stores by sending
field workers to collect observations. The field workers collect 40 nearby stores which resulted in a
sample mean of $263,590 and a standard deviation of $42,000.
(a) Find a 95% confidence interval for average weekly sales.
(b) Would you recommend that Bach Hoa Xanh should open the store? Why or why not? Solution
(a) Find a 95% confidence interval for average weekly sales.
Assume the population is normal y distributed.
The population standard deviation is unknown.
The sample size is large, n ≥ 30
follow Central Limit Theorem (CLT) use z – distribution 𝑥̅ = 263,590 𝑠 = 42,000 n = 40
95% confidence level zα = 1.96 2 s 42,000 CI = x̅ ± zα × = 263,590 ± 1.96 × 2 √n √40
So, CI = [250,574.07 ; 276,605.93]
(b) Would you recommend that Bach Hoa Xanh should open the store? Why or why not?
Based on the finding in part a, average weekly sales meet the requirement, at least $250,000. For
making the store profitable, Bach Hoa Xanh should open this store.
2.2. Determine a confidence interval for population proportion 𝒑
Khi gặp các bài tập liên quan đến proportion thì các bạn phải kiểm tra điều kiện, điều kiện thỏa mãn rồi
thì luôn phải dùng z – distribution nhé.
Conditions: 𝐧 × 𝐩 > 𝟓 𝐚𝐧𝐝 𝐧 × (𝟏 − 𝐩) > 𝟓 Or 𝐧 × 𝑷
̂ > 𝟓 𝐚𝐧𝐝 𝐧 × (𝟏 − 𝑷 ̂) > 𝟓
Then use z – distribution for calculation 𝑃̂ × (1 − 𝑃̂)
𝐶𝐼 (𝑓𝑜𝑟 𝑝𝑟𝑜𝑝𝑜𝑟𝑡𝑖𝑜𝑛) = 𝑃̂ ± zα × √ 2 𝑛
Ví dụ: A maker of portable exercise equipment, designed for health-conscious people who travel too
frequently to use a regular athletic club, wants to estimate the proportion of traveling business people
who may be interested in the product. A random sample of 120 traveling business people indicates that
30 may be interested in purchasing the portable fitness equipment. Determine a 95% confidence
interval for the proportion of all traveling business people who may be interested in the product. Solution 30 𝑃̂ = = 25% = 0.25 , n = 120 120 Condition: 𝐧 × 𝑷
̂ > 𝟓 𝐚𝐧𝐝 𝐧 × (𝟏 − 𝑷 ̂) > 𝟓
Ta có: n × 𝑃̂ = 120 × 25% = 30 > 5 (thỏa mãn)
n × (1 − 𝑃̂) = 120 × (1 − 25%) = 90 > 5 (thỏa mãn) Dùng z – distribution
95% confidence level zα = 1.96 2 𝑃̂ × (1 − 𝑃̂) 0.25 × (1 − 0.25)
𝐶𝐼 = 𝑃̂ ± zα × √ = 0.25 ± 1.96 × √ 2 𝑛 120
So, CI = [17.25% ; 32.75%]
3. Determining the minimum sample sizes needed for estimation
3.1. Determining the minimum sample sizes in estimating population mean (zα)2 × 𝜎2 n = 2 𝑒2 Trong đó, • n = sample size • zα = critical value 2
• 𝜎 = population standard deviation • 𝑒 = range estimation
3.2. Determining the minimum sample sizes in estimating population proportion (zα)2 × 𝑝(1 − 𝑝) n = 2 𝑒2
Cách xác định range estimation 𝒆
Trường hợp 1: đề cho khoảng (within) bao nhiêu (e.g: within ±𝟏; ±𝟐, … or within 2 in the true mean…)
Ví dụ: In a large manufacturing plant in Vietnam, the quality control team wants to estimate the true
proportion of defective products in their production line. They want to ensure that their estimate true
proportion defective is accurate within ±3% with 95% confidence. How large a sample do they need to
take to achieve this goal? Assume the pilot sample yields is 0.12. Solution
Đây là dạng bài: xác định minimum sample sizes in estimating population proportion. p = 0.12 e = 3
95% confidence critical value, zα = 1.96 2