Writing assignment - English | Trường Đại Học Ngoại ngữ Huế
Writing assignment - English | Trường Đại Học Ngoại ngữ Huế được sưu tầm và soạn thảo dưới dạng file PDF để gửi tới các bạn sinh viên cùng tham khảo, ôn tập đầy đủ kiến thức, chuẩn bị cho các buổi học thật tốt. Mời bạn đọc đón xem!
Môn: Tiếng anh 1 (ENGL 101E) 228 tài liệu
Trường: Trường Đại học Ngoại ngữ, Đại học Huế 466 tài liệu
Tác giả:


Preview text:
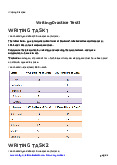
WRITING ÔN THI HSG SECTION IV: WRITING TASK 1:
Part 1: Read the following passage and use your own words to summarize it. Your
summary should be between 100 and 120 words long. You MUST NOT copy the original.
Be it a data entry, a deleted file or a jammed photocopier, every office is susceptible to
the occasional human hiccup. At best, mistakes are time consuming and costly; at worst
they are fatal. Several recent disasters have been attributed to employee oversights, a fact
that has forced companies to consider how best to handle slips and lapses. Traditionally,
employers have taken a punitive line, but a recent study has shown that it might be in the
company's interest to embrace employees who blunder. 'Rewarding staff for managing
errors rather than punishing them leads to a better company culture,' says one researcher
whose work has revealed a relationship between error tolerance and commercial success.
A psychologist who looks at human errors in work settings where safety is critical adds:
‘If you have a work system that is error intolerant, the efficiency of an organisation is
going to be affected. If someone is in a situation where a flick of a button means the
entire contents of the computer are wiped, then that person is likely to lead a fairly
stressful life. If you can set up a system designed to be error tolerant, you're likely to see
less of the normal human psyche protection strategies. People understandably look
elsewhere for explanations when things go wrong, but if systems are set up correctly and
people know their actions will be recoverable, they can be more innovative and express
themselves in their work without fear of getting the blame for every little thing that goes wrong.
Not so long ago, stressed-out executives at a failing company were packed off on a
training course. Nothing so very unusual about that, but they were in for a surprise. There
was no time management seminar, no flashy flip-charts. Instead they were faced with
cardboard, paint and glue. The day-long session required each delegate to create a mask
to represent the face they presented at work. Mask-making, it is claimed, is a very
effective corporate tool. It helps people access their intuitive, imaginative skills.
Creativity has become a highly-prized commodity, even in less-than-fizzy professions
such as accountancy. Bosses have begun to see that if you sit in a boring meeting in a
boring conference room, you will inevitably emerge with boring ideas. As companies
become desperate to harness creativity and lateral thinking, they are being forced to look
at new ways of fostering those talents. A London comedy club has launched a corporate
programme to inspire executives by teaching them to do comic routines, because
forward-looking companies realise a good atmosphere at work and good relations with
colleagues are crucial to motivating staff. Teaching them how to laugh with each other is
a good start. There are other courses that focus on humour in the belief that comedy can
help employees confront their inner fears. Says the organiser, 'We get people to write a
story about a situation that's bothering them, then we clown it. It's not about being funny,
it's about developing self-expression.'
The passage underlines the importance of making mistakes at workplace. Creativity
and freedom to express are promoted if employees are allowed to make mistakes without
a fear of being blame. This is linked to the corporation, which is acquired by employees
by putting a facemask that they should be put at work. To boost employee’ motivations,
many companies make an attempt to create a comfortable atmosphere and build
colleague- colleague relationships at work. They offer courses focusing on humor only to
help employees to get through their internal fear that prevents them to make mistake at workplace.
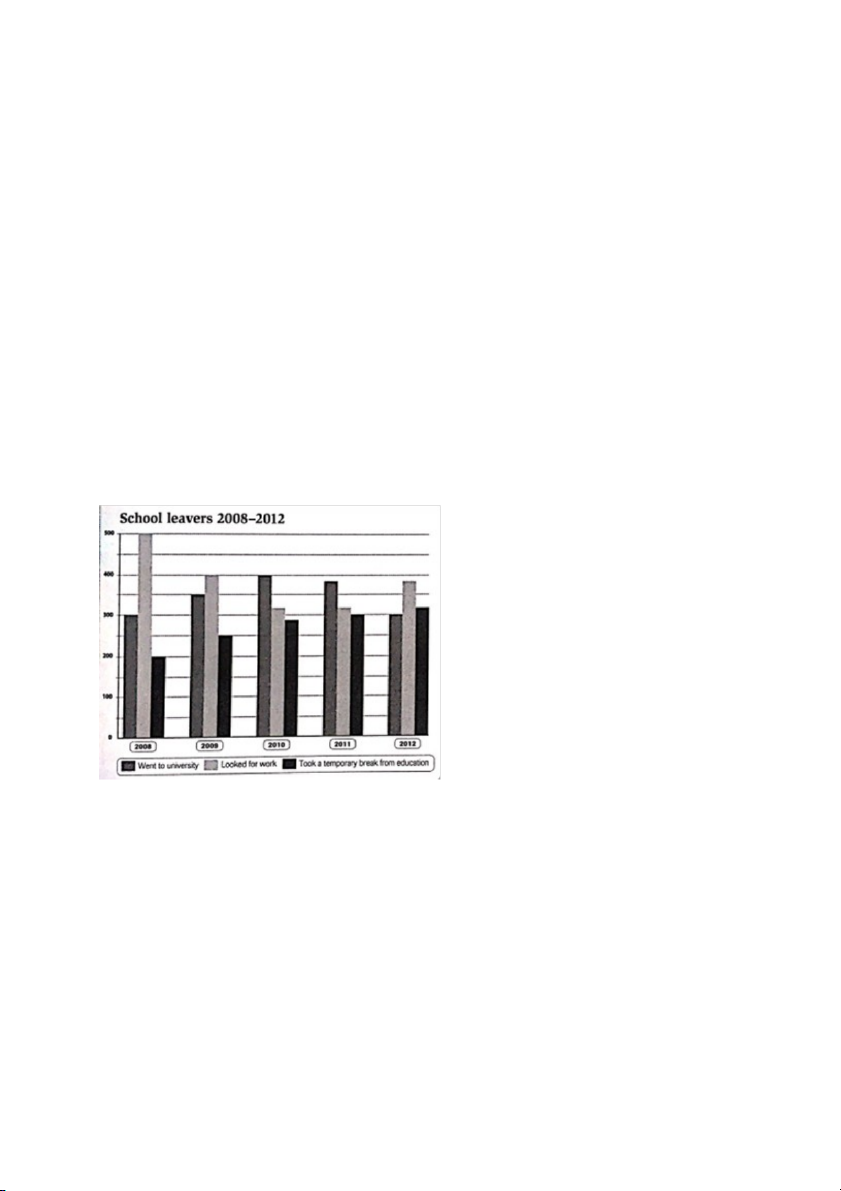
Part 2: The graph below gives the results of a survey showing what 1,000 young people
did after leaving school between 2008 and 2012. Summarize the information by
selecting and reporting the main features, and make comparisons where relevant. You
should write about 150 words.
The given bar chart demonstrates what students do after graduating from high schools from 2008 to 2012.
Overall, the number of students looking for work after leaving schools was highest, but
there were some changes during this period. The figure going to university showed the
similar trend. Meanwhile, graduates took a temporary break from education decreased.
As can be seen from the chart, the number of graduates in search of work was the
highest, standing at 500 in 2008, followed by 300 going to university and 200 taking gap
years. In the next year, there was a significant decline in the figure for looking for work
to 400, while the figure for going to university and taking a temporary break from
education increased slightly. In 2009, students decide to go to university reached the
peak at 400, which was the highest compared to nearly 300 in search of work and take a
gap year. The figure for these choices remained stable in the next year. The number of
students looking for work after graduating rose again at approximately 400. By contrast,
those choose to receive higher education went down sharply.
Part 3: Creativity is considered an essential factor to spur development in all aspects of
life. In about 250 words, write a passage to suggest ways to promote creativity at school. TASK 2:
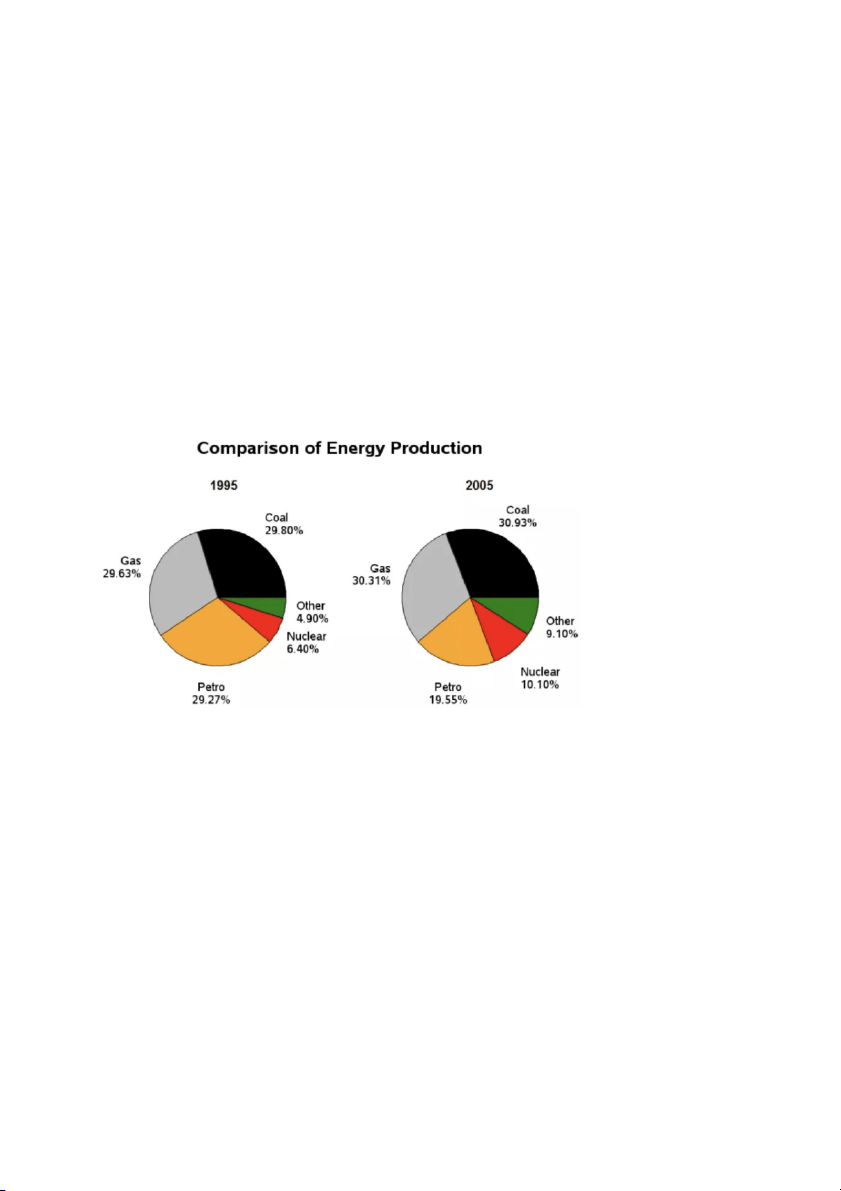
Part 1: Summarise the information by selecting and reporting the main features, and
make comparisons where relevant. You should write about 150 words.
The two given pie charts demonstrate the comparison in the production of five different
sources of energy between 1995 and 2005.
Overall, the quantity of coal production was the highest during the period shown. In
addition, there was a significant decrease in the figure for petrol production, while the
figure for other energy increased.
As can be seen from the two chart, coal production made up 29.80% of the total
production, which was the highest compared to the four other energy in 1995. Followed
by 29,63 % in gas production and 29,27% in petrol production. In the next ten years, the
data for coal production went up slightly and still remained the first place at 30,93%.
The quantity of gas, nuclear and other energy produced showed the similar trend. By
contrast, there was a sharply declined in the figure for petrol production, from 29,27% in 1995 to 19,55% in 2005.
Part 2: Summary (10pts)
Summarize the following extract. Your summary should be between 70 and 100 words long. SIGNS OF LIFE
As the search for alien life turn 50, its practitioners find new methods. Frank Drake, who
was born in Chicago, Illinois, graduated in 1952 from Cornell University and obtained
his PhD in 1958 from Harvard. He worked initially at the National Radio Astronomy
Observatory (NRAO, West Virginia (1958-1963) and at the Jet Propulsion Laboratory,
California (1963-1964) before returning to Cornell and serving as a professor of
astronomy from 1964. He was appointed professor of astronomy at the University of California in 1984.
Half a century ago a radio astronomer called Frank Drake thought of a way to calculate
the likelihood of establishing contact with aliens. He suggested the following figures
should be multiplied: how many stars are formed in the galaxy in a year : what fraction of
these have planets and thus form solar systems : the average number of planets per solar
system that have the potential to support life : on what percentage of those where it is
possible do such biospheres actually form : what percentage of such biospheres give rise
to intelligent species : what percentage of intelligent life is able to transmit signals into
space ; and for how long could such intelligence keeps sending signals.
This calculation became celebrated as the Drake equation – perhaps the best attempt so
far to tame a wild guess. Most of the terms remain hard to tie down, although there is a
consensus that about ten stars are formed per year in the galaxy. Also, recent searches for
extra solar planets have concluded that planets are not rare.
At the AAAS, Dr. Drake reflected on his search for alien signals. One reason this is hard
is that radio telescopes must chop the spectrum into fine portions to study it, like tuning
in to a signal on a car radio. Another is the trade-off between a telescope’s field of view
and its magnificence. Small telescopes see a lot of sky but can detect only strong signals.
Large ones, which can detect weak signals, have a narrow focus. Astronomers therefore
have difficulty looking both carefully and comprehensively.
Dr. Drake said there may be another difficulty. Researchers tend to look for signals
similar to those now made by humanity. The Earth, though, is getting quitter because the
rise of spread-spectrum communication makes stray emissions less likely than in the past.
The extract gives an insight into the experiment of Prs. Frank Drake about
communicating with aliens. By doing so, he investigated the stars and planets in solar
systems and the galaxy and argued that the number of stars formed in the galaxy each
year is uncountable. There are two major causes preventing his study from success. The
first one is the difficulty when dividing the spectrum into pieces. Another is the trade-off
of the telescope’s view and its splendor, which means that the small telescope cannot see
the small signals, while the large one cannot focus the signals on a wide view. TASK 3:
Part 1: Read the following passage and use your own words to summarize it. Your
summary should be about 70 words long. You MUST NOT copy the original. The Earth
How old is the Earth? In the past, scientists came up with many interesting ways to
calculate the Earth's age. But as we learn more and more about the Earth, some of the old ideas don't seem as useful.
One method of estimating the Earth's age is by looking at layers of rock. Rocks that are
beneath other rocks must be older. So, when you look at a cliff with many different layers
of rock, the rocks on the bottom must be the oldest. But how old are they? Originally,
scientists estimated each layer took about the same amount of time to form. But now
most scientists agree such estimation is not really accurate. In some places, rock layers
form very quickly. In other places, they form slowly.
A better way to estimate the Earth's age is from radiation. From chemistry and physics,
we know a lot about radiation. We know how fast radioactive rocks decay (give off
radioactive particles). By looking at how much radiation certain rocks give off, scientists
can get a much more accurate age for the Earth. Based on analysis of the radiation from
very old rocks, the Earth appears to be about 4,500 million years old.
The passage gives an insight into two methods to calculate the earth’s age. The first
one is to investigate layers of rocks. The deeper the rocks lay, the older they are.
However, this method soon dies out due to its inaccuracy. The second method is
analyzing radiation, which estimates the amount of radiation that is released by rocks. By
doing so, scientists can estimate the earth’s age at 4,500 million years old.
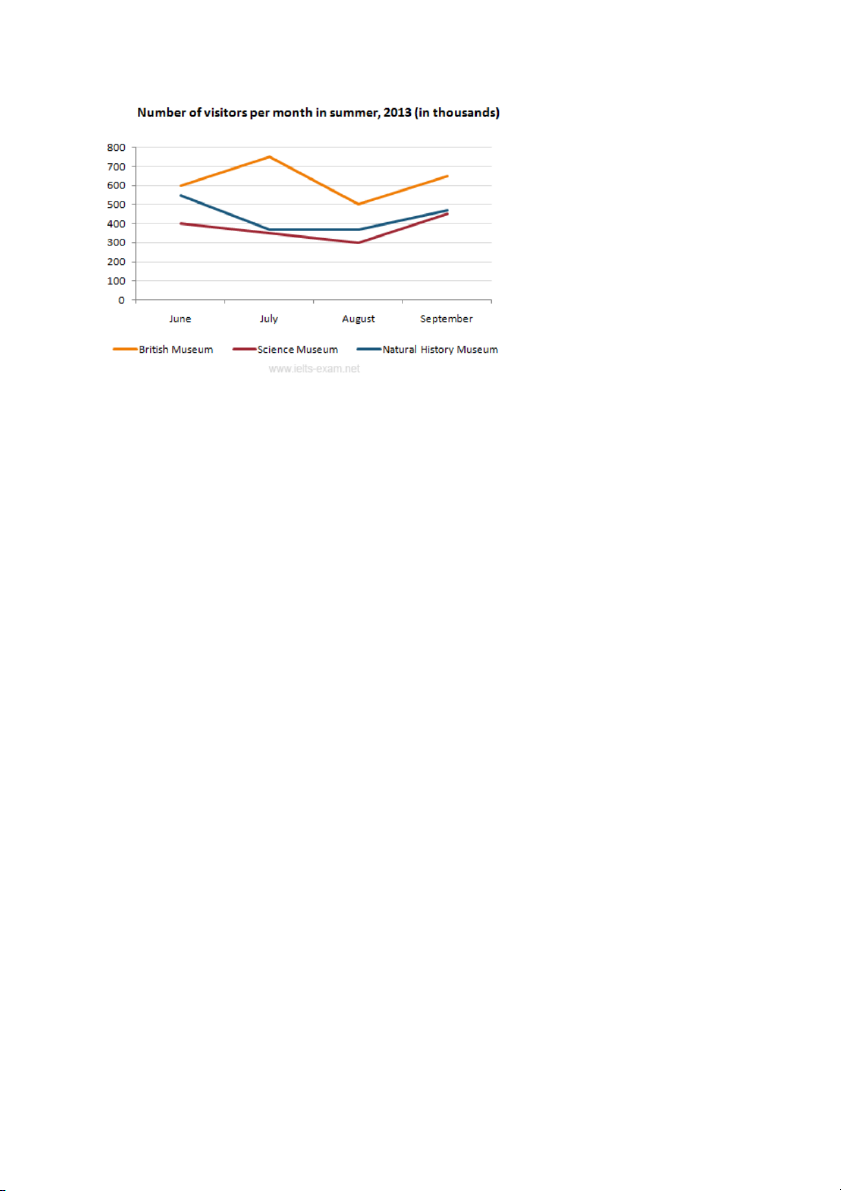
Part 2: The line graph below gives information about the number of visitors to three
London museums between June and September 2013. Summarise the information by
selecting and reporting the main features, and make comparisons where relevant.
The given line graph demonstrates how many visitors visit three different museums in
London from June to September 2013.
Overall, the number of visitors visiting the British Museum was the highest compared to
the two others. The figure for the three museums fluctuated during the period shown.
600 thousand people visit British Museum in June, which was the highest, followed by
the figure for Natural History Museum and Science Museum, standing at nearly 500
thousand, 400 thousand respectively. In the next month, there was a sharp increase in the
data for British Museum to the peak at over 700 thousand visitors, while that of the
Natural History Museum and Science Museum decreased slightly to approximately 350
thousand people. During the period July-August, the figure for British Museum went up
significantly, whilst both the number of people visiting NHM and SM remained stable.
After that, the data for three museums in London showed an upward trend.
Tài liệu liên quan:
-
Tổng hợp bài tập thì tương lai đơn | Trường Đại học Ngoại Ngữ, Đại học Huế
373 187 -
Complex Sentence - English | Trường Đại Học Ngoại ngữ Huế
300 150 -
Work - English | Trường Đại Học Ngoại ngữ Huế
359 180 -
Grammar of present tense - English | Trường Đại Học Ngoại ngữ Huế
332 166 -
Writing Practice Test - English | Trường Đại Học Ngoại ngữ Huế
465 233