Xlstat tip sheet for business statistics - cengage learning môn Xác suất thống kê| Trường Đại học Ngoại Thương
Select the data in the Excel worksheet, choose the samplingmethod, and enter the sample size to be generated. You may choose to locate the generated subsample beginning in a cell in the existing worksheet. Tài liệu giúp bạn tham khảo, ôn tập và đạt kết quả cao. Mời đọc đón xem!
Môn: Xác suất thống kê (FTU) 355 tài liệu
Trường: Trường Đại học Ngoại Thương 1.1 K tài liệu
Tác giả:


Preview text:
15:01, 11/01/2026
XLSTAT Tip Sheet for Business Statistics - CENGAGE LEARNING - Studocu
XLSTAT® TIP SHEET FOR BUSINESS STATISTICS – CENGAGE LEARNING INTRODUCTION
XLSTAT makes accessible to anyone a powerful, complete and user-friendly data analysis and statistical solution. Accessibility to the
XLSTAT interface totally relies on Microsoft Excel, whether for inputting the data or for displaying the results. The power of XLSTAT is
a result of all computations having been developed with the C++ programming language. Users’ suggestions have led to software
improvements that offer a complete solution to a well-adapted variety of requirements. The user-friendly interface facilitates the
use of some statistical methods that might require hours of training with other software.
More detail about the statistical processes described in this card can be found in the Help option available on the XLSTAT ribbon. CO MM ON DIAL OG BOX TO OL S
Click to reset the dialog box to default options.
Click to delete existing data selections of the dialog box.
The blue arrow indicates that data are displayed in
columns; change the arrow to red to indicate that data are displayed by rows.
You may choose to locate the generated subsample
beginning in a cell in the existing worksheet (Range), in
a new worksheet within the current workbook (Sheet),
or in a new workbook (Workbook). DATA SA MPLIN G
Use the Data Sampling tool found in the Preparing data dropdown object to generate a subsample of observations from a dataset. 1 15:01, 11/01/2026
XLSTAT Tip Sheet for Business Statistics - CENGAGE LEARNING - Studocu
Select the data in the Excel worksheet, choose the sampling method, and enter the sample size to be generated. You may choose to
locate the generated subsample beginning in a cell in the existing worksheet, in a new worksheet within the current workbook, or in
a new workbook. The variable labels checkbox is selected if the first row of the data contains a data label (header). Default settings
indicate that a report header will be displayed and that the sample output data will automatically be permuted. Uncheck these
options if no report header is required and if you want to display the data in the order that it was generated.
Sample report header associated with using the Random without replacement sampling method to generate a sample of 500 from the given dataset. DESCRIPTIVE STATI STI CS
The Descriptive Statistics tool (found in the Describing data tab) is used to calculate descriptive statistics and display univariate plots
for quantitative and/or qualitative variables. GE NER AL TAB
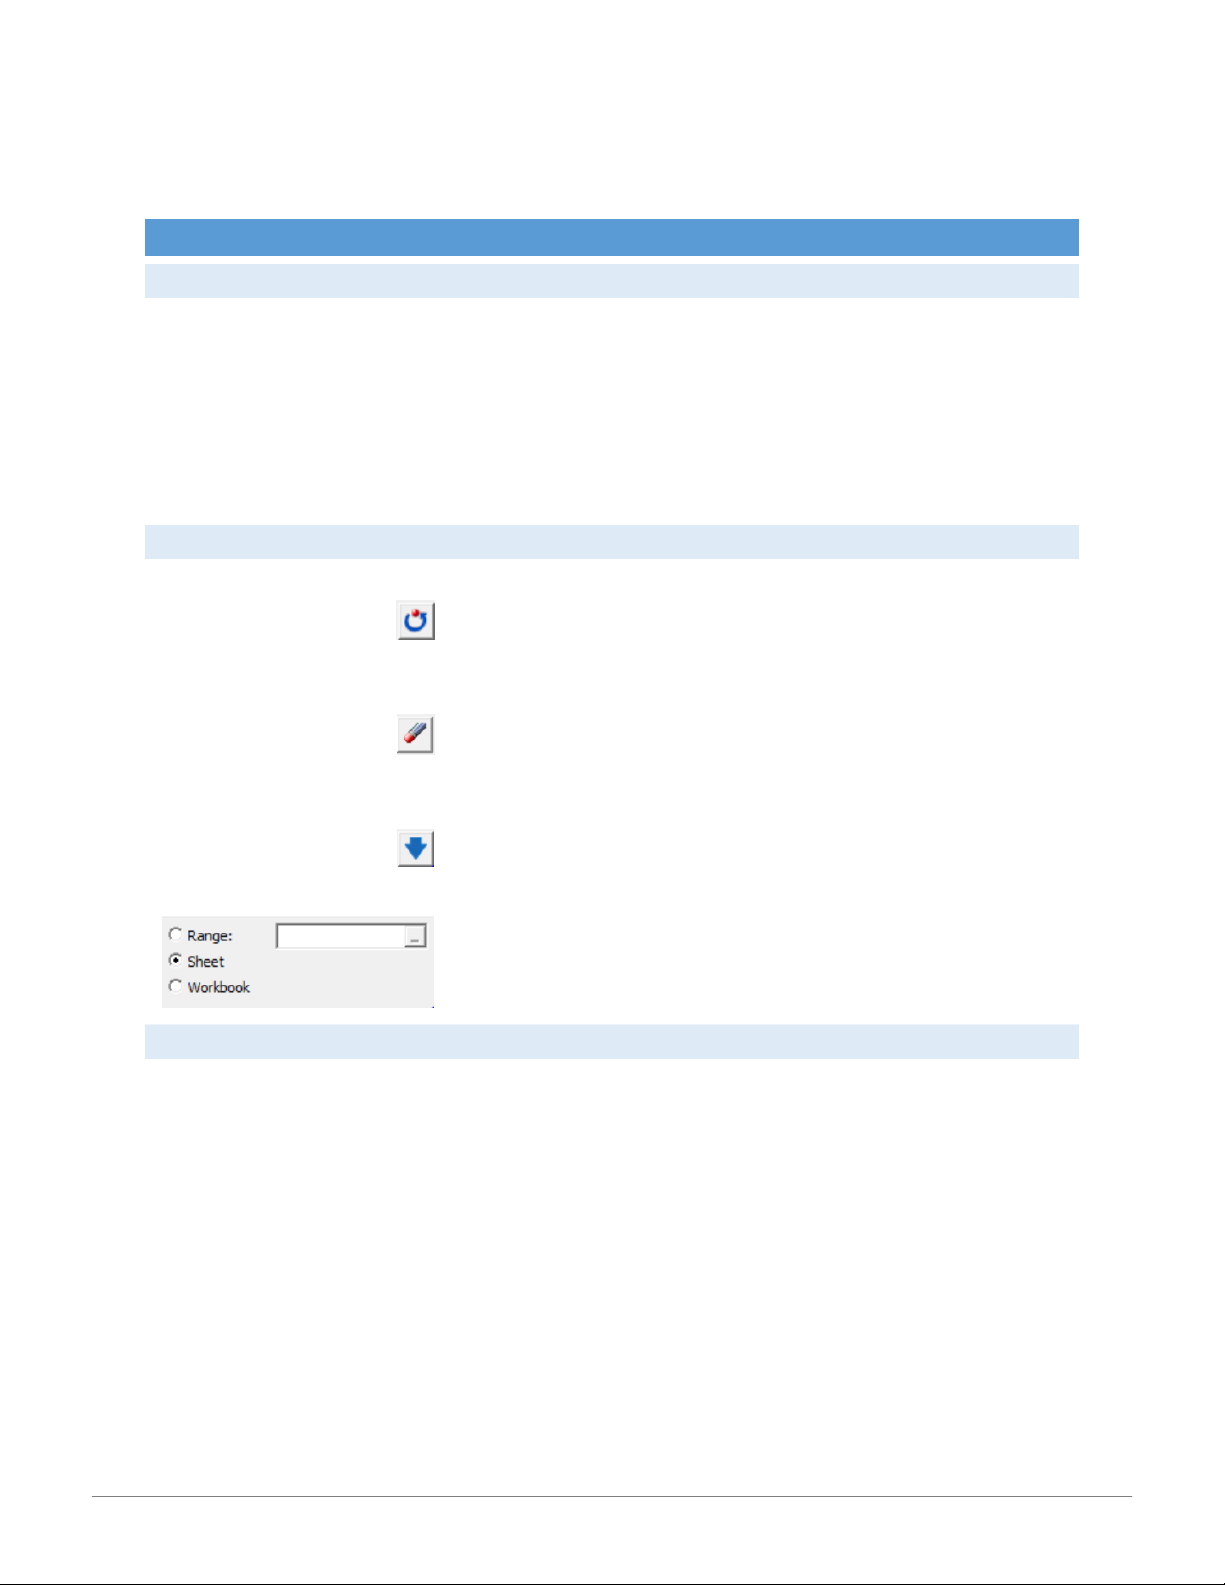
In the General tab, sample data is selected and the report output location is specified. 2 15:01, 11/01/2026
XLSTAT Tip Sheet for Business Statistics - CENGAGE LEARNING - Studocu OPTIONS TAB
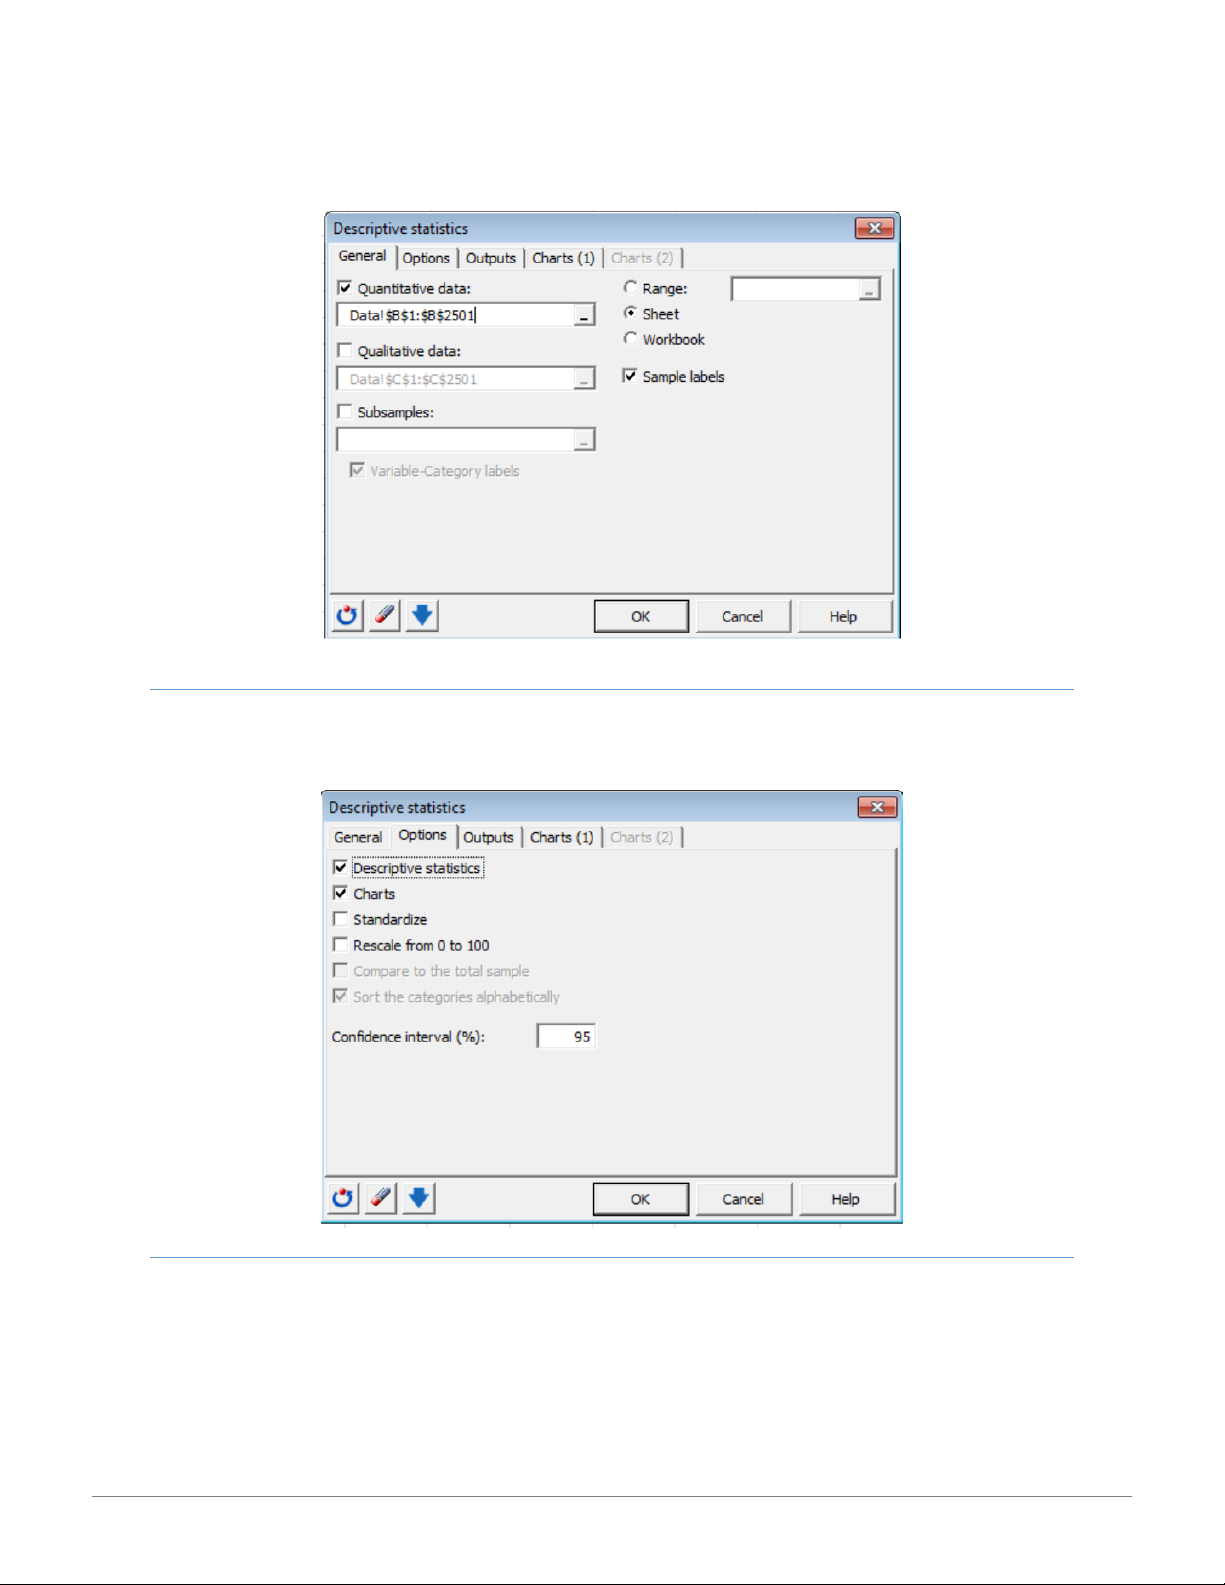
The Options tab provides options for descriptive statistics, charts, normalization and scaling of data, and specification of a confidence interval. OUTPUTS TAB
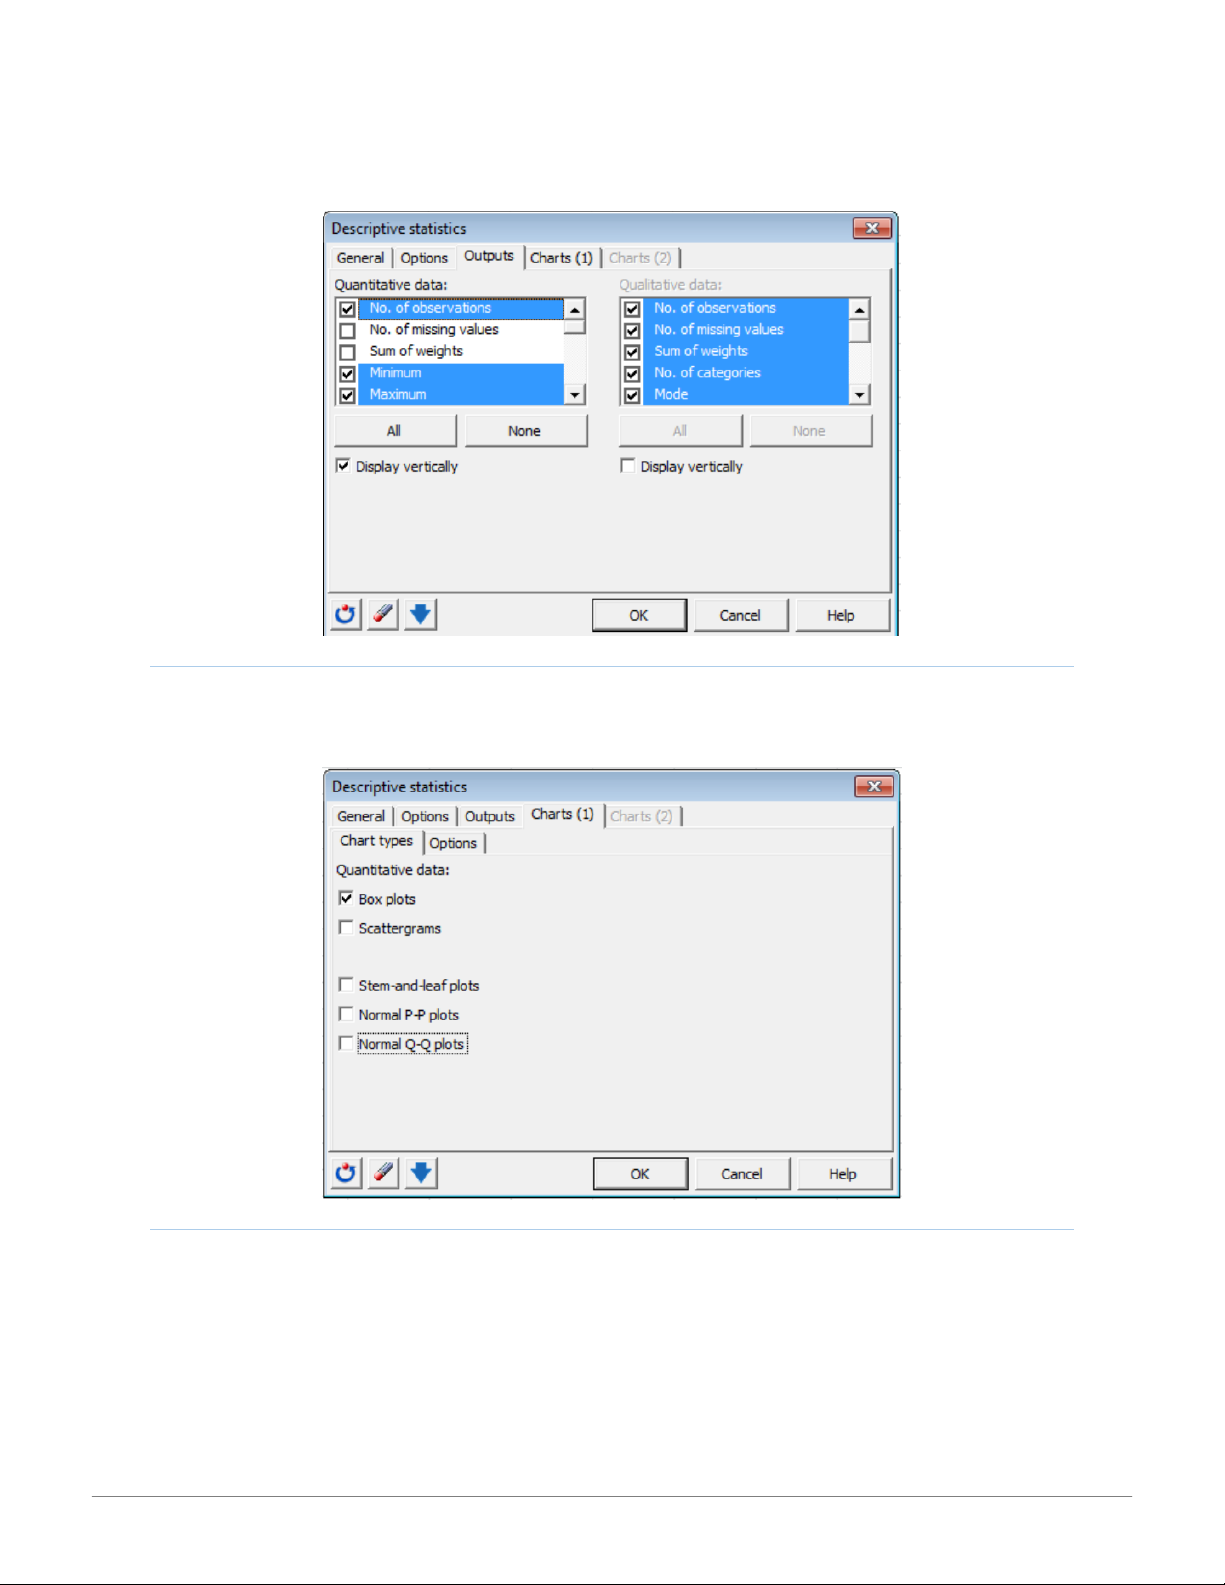
The Outputs tab allows you to choose the specific options you want to calculate for quantitative and/or qualitative data. 3 15:01, 11/01/2026
XLSTAT Tip Sheet for Business Statistics - CENGAGE LEARNING - Studocu CH AR TS(1) TAB
The Charts(1) tab specifies chart types for quantitative data including box plots, scatter grams, stem-and-leaf plots, P-P plots, and Q- Q charts. CH AR TS(2) TAB
The Charts(2) tab provides charting options for qualitative data including bar charts, pie charts, doughnuts, stacked bars, multiple
bars. In this tab you may choose to plot frequencies or relative frequencies of the categories. This tab becomes available when the
Qualitative data option is selected in the General tab. 4 15:01, 11/01/2026
XLSTAT Tip Sheet for Business Statistics - CENGAGE LEARNING - Studocu HISTOGRAMS
Histograms – Use this tool (found in the Visualizing and Describing data tabs) to create a histogram from a sample of continuous or
discrete quantitative data. Data and data type are selected in the General tab. OPTIONS TAB
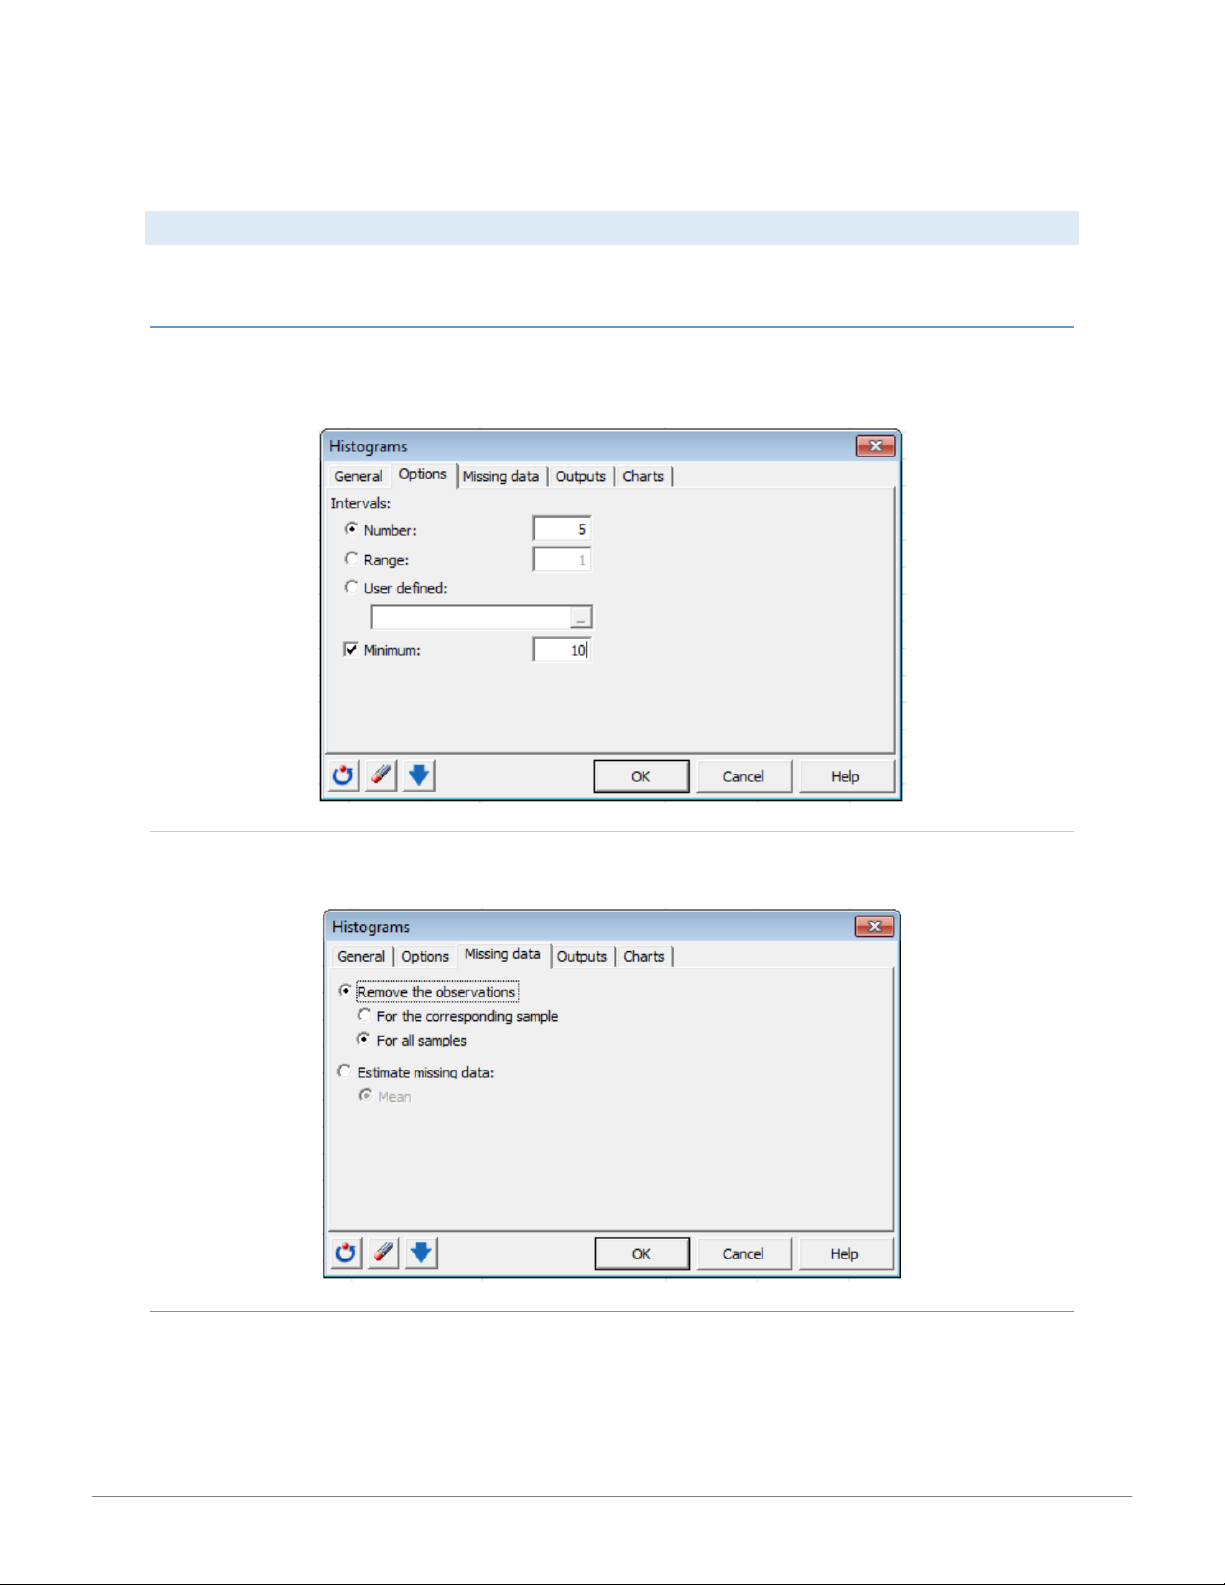
Use the Options tab to define the intervals for the histogram. These intervals may be defined by Number:, Range:, or User defined:.
Activate the Minimum option to specify the lower value of the first interval. MISSING DATA TAB
The Missing data tab allows you to remove missing data or estimate missing data using the mean of the sample. OUTPUTS TAB
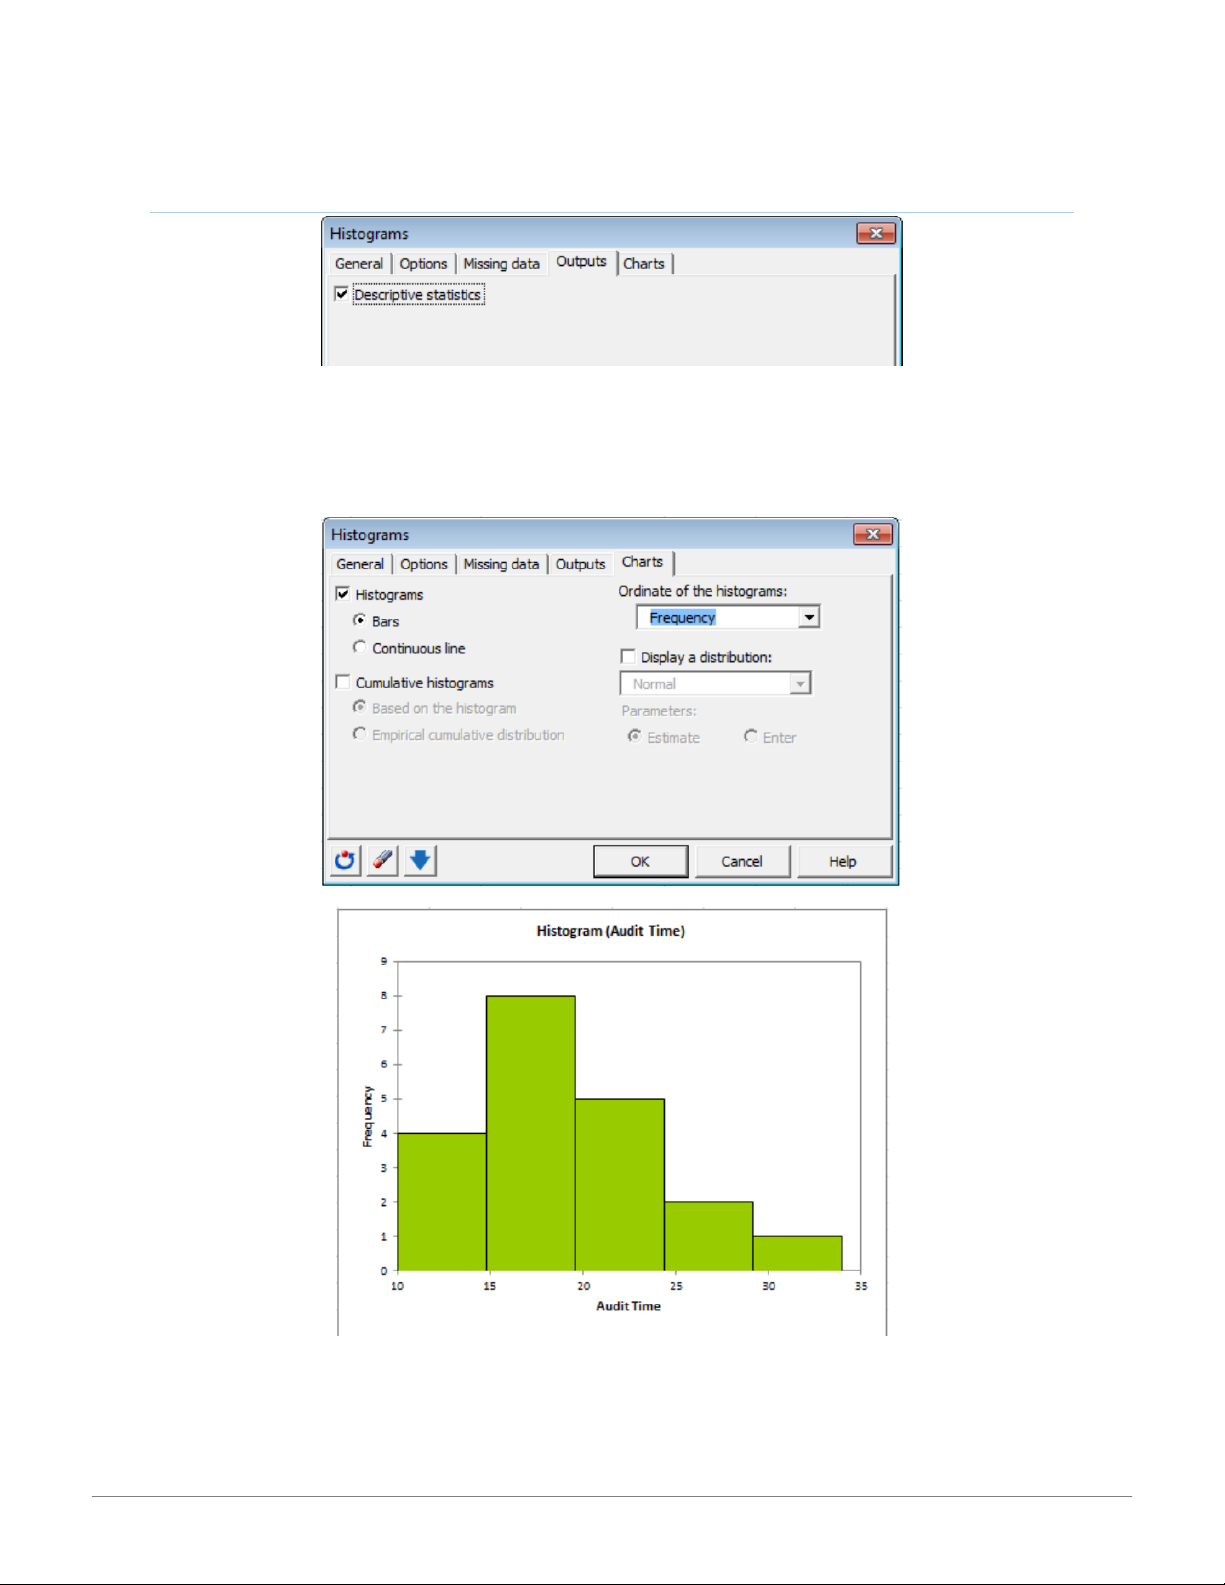
The Outputs tab allows you to display the descriptive statistics of the samples (default). 5 15:01, 11/01/2026
XLSTAT Tip Sheet for Business Statistics - CENGAGE LEARNING - Studocu CH AR TS TAB
The Charts tab allows you to activate the display of the histogram. The histogram may be displayed as a bar or continuous line. The
cumulative histograms option provides a display of cumulated histograms of the sample(s). The Ordinate of the histograms:
provides the quantity to be used in the histogram as density, frequency, or relative frequency. 6 15:01, 11/01/2026
XLSTAT Tip Sheet for Business Statistics - CENGAGE LEARNING - Studocu SCATTE RPL OTS
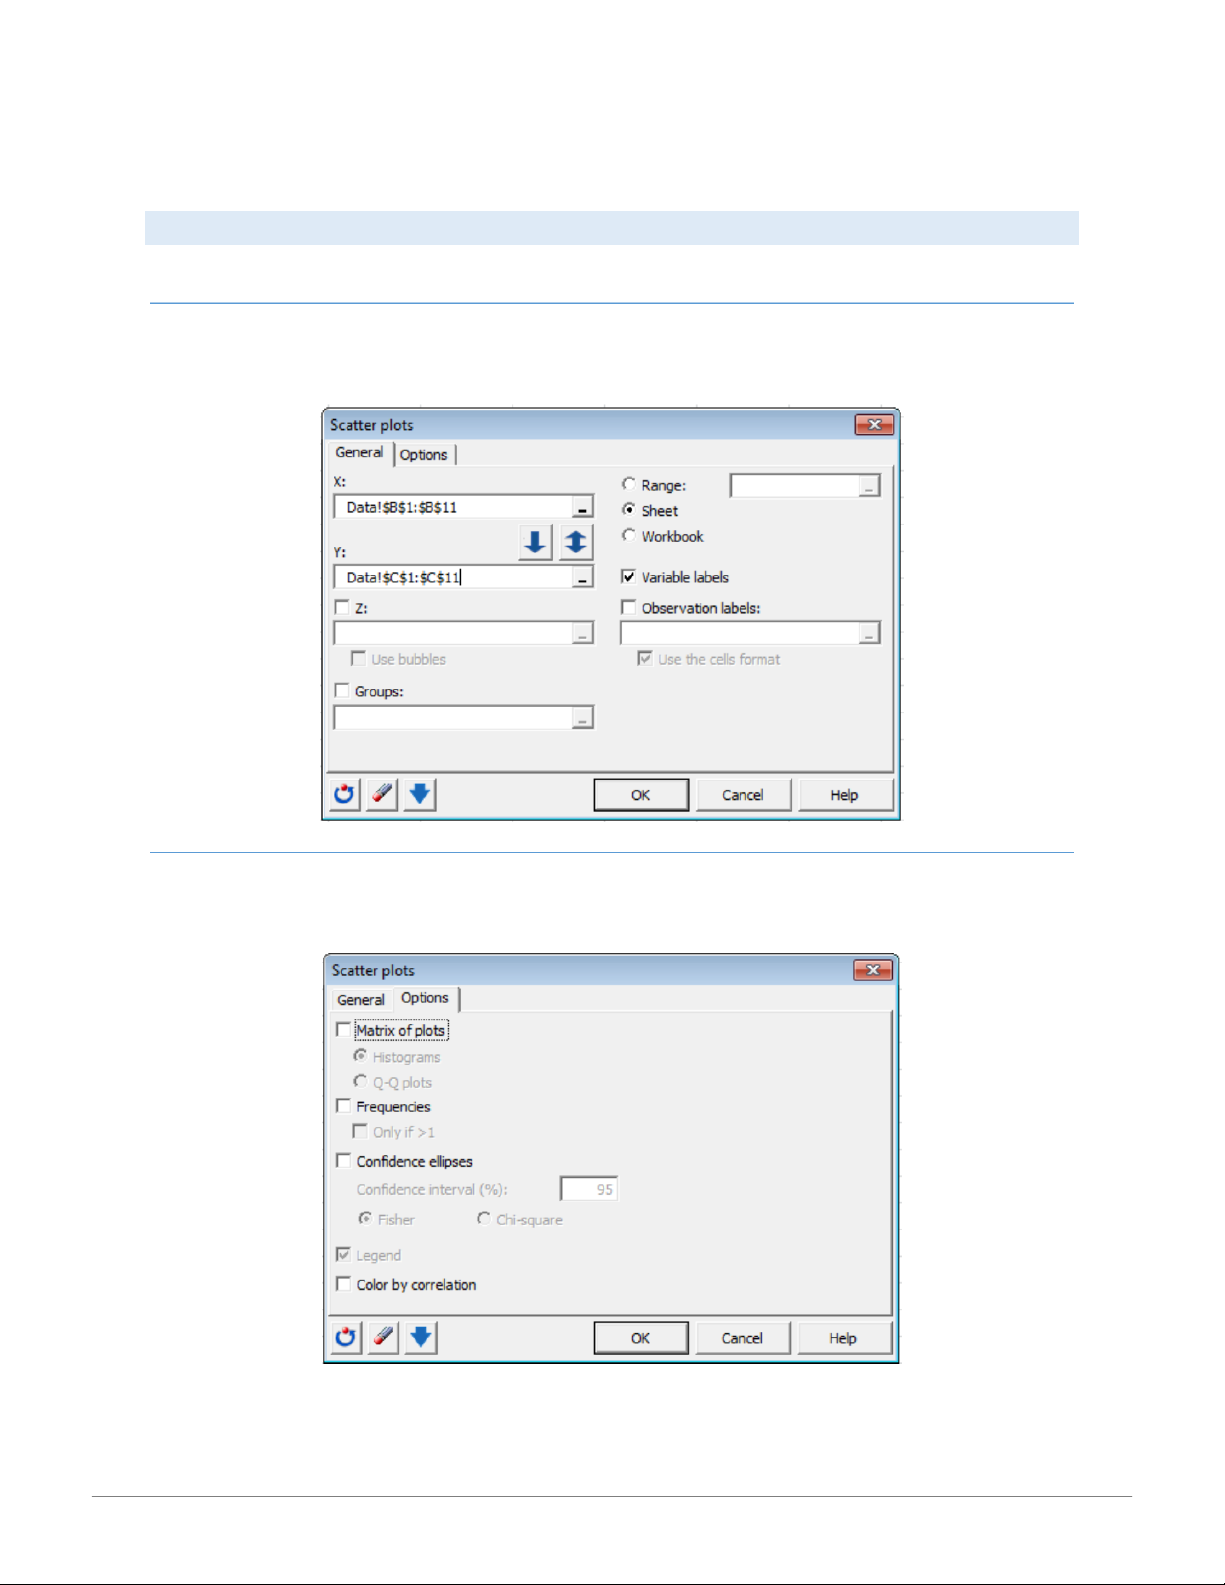
Use this tool (found in the Visualizing Data tab) to create 2- or 3–dimensional plots (represented by the size of the point). GE NER AL TAB
In the General tab, specify the data along the X-axis in the X: field and the data along the Y-axis in the Y: field. The Variable labels
checkbox frequencies for each point on the chart, and a display of confidence ellipses. OPTIONS TAB
The Options tab displays by default a legend for the histogram. Additional options provide for a Matrix of plots, display of
Frequencies for each point on the chart, and a display of Confidence ellipses. 7 15:01, 11/01/2026
XLSTAT Tip Sheet for Business Statistics - CENGAGE LEARNING - Studocu LINEAR REGRESSI ON
Linear regression is the most frequently used statistical method. The principle of linear regression is to model a quantitative
dependent variable Y through a linear combination of p quantitative explanatory variables, X1, X2, …, Xp. While a distinction is usually
made between simple regression (with only one explanatory variable) and multiple regression (several explanatory variables), the
overall concept and calculation methods are identical.
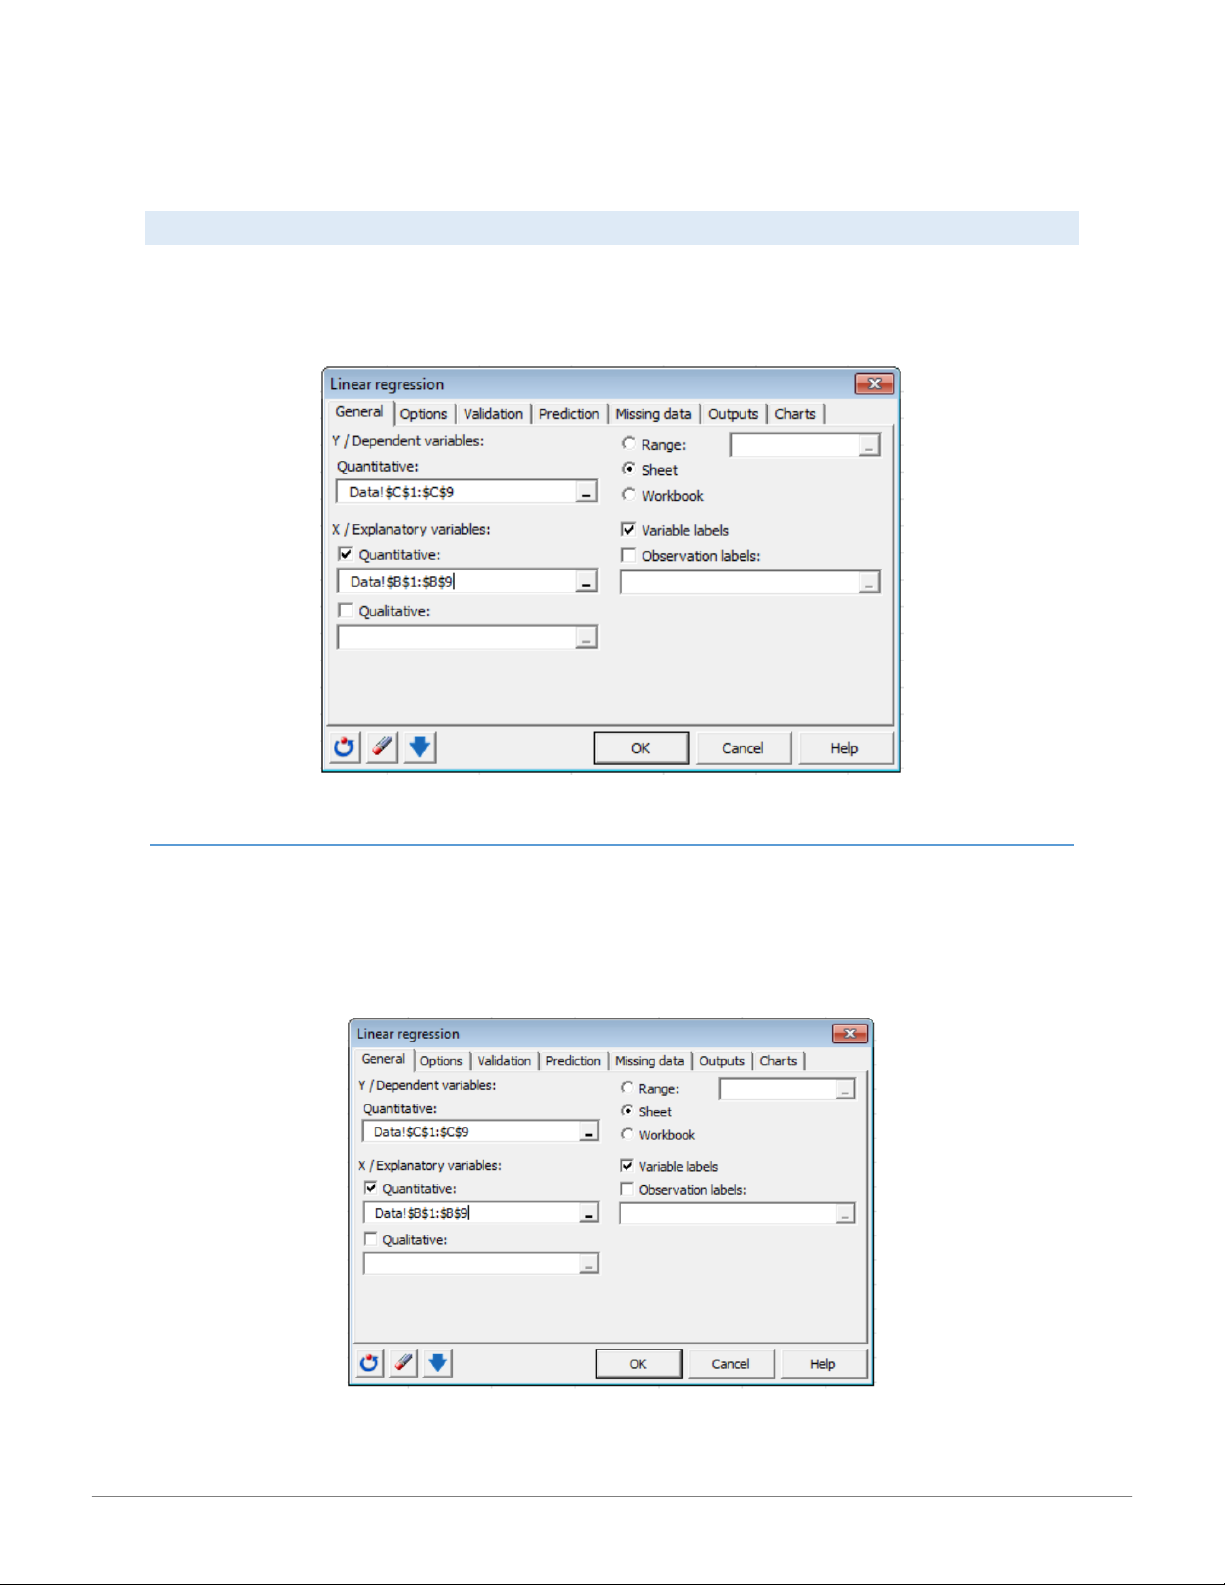
Use this tool (found in the Modeling Data tab) to create a simple or multiple linear regression model for explanation or prediction. GE NER AL TAB
In the Y / Dependent variables: box select the response variable(s) you want to model. If several variables have been selected,
XLSTAT carries out calculations for each of the variables separately. In the X / Explanatory variables: box select the quantitative
explanatory variables in the Excel worksheet. The data selected must be of type numeric. Activate the Qualitative: data option and
select qualitative variables to perform an ANCOVA analysis. Activate the Variable labels option if the first row of the data selections
(dependent and explanatory variables, weights, observations labels) includes a header. 8 15:01, 11/01/2026
XLSTAT Tip Sheet for Business Statistics - CENGAGE LEARNING - Studocu OPTIONS TAB
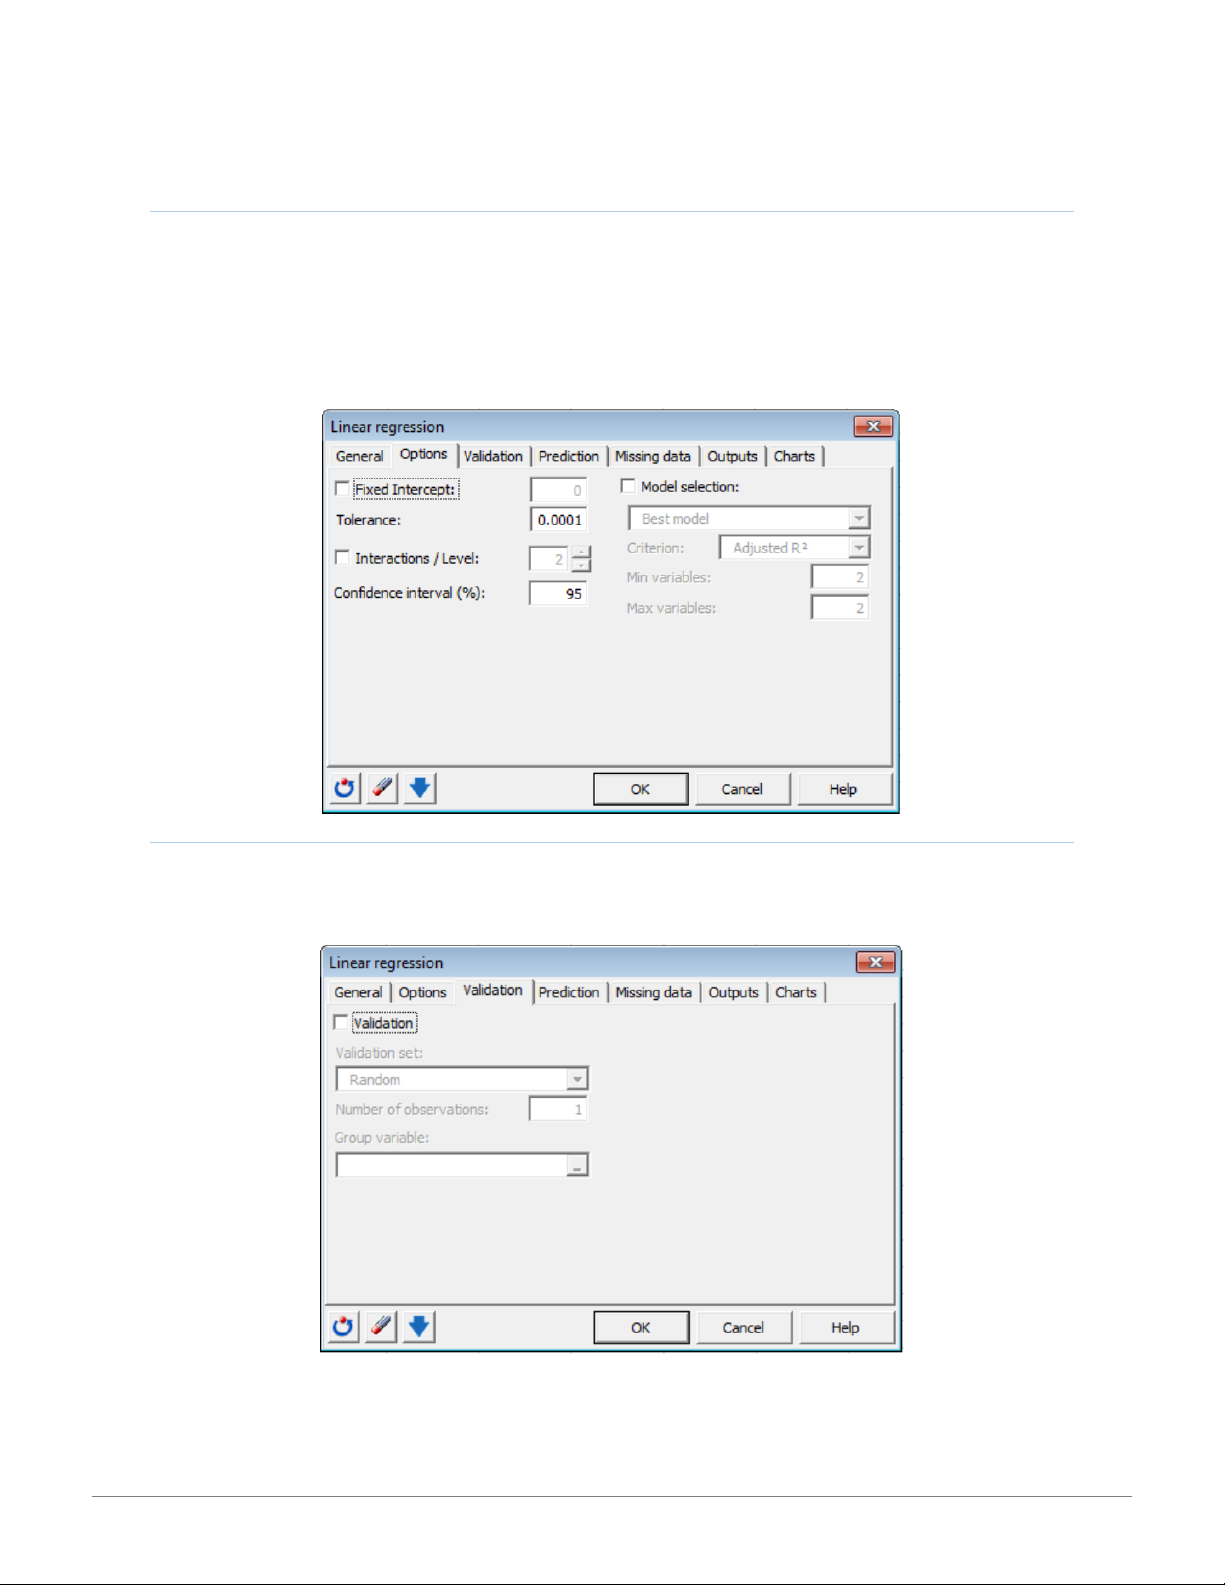
Activate the Fixed Intercept: option to set the regression constant to a fixed value (default 0).The Tolerance: option (default 0.0001)
prevents the OLS regression algorithm from considering variables which are constant or too correlated with other variables in the
model. The Interactions/Level: option allows you to include interactions in the model. Select a value between 1 and 4. Use the
Confidence interval (%): option to enter the percentage range of the confidence interval (default .95). Activate the Model selection:
option if you want to indicate one of four available selection methods: best model regression, stepwise regression, forward, and backward regression. VAL ID ATION T AB
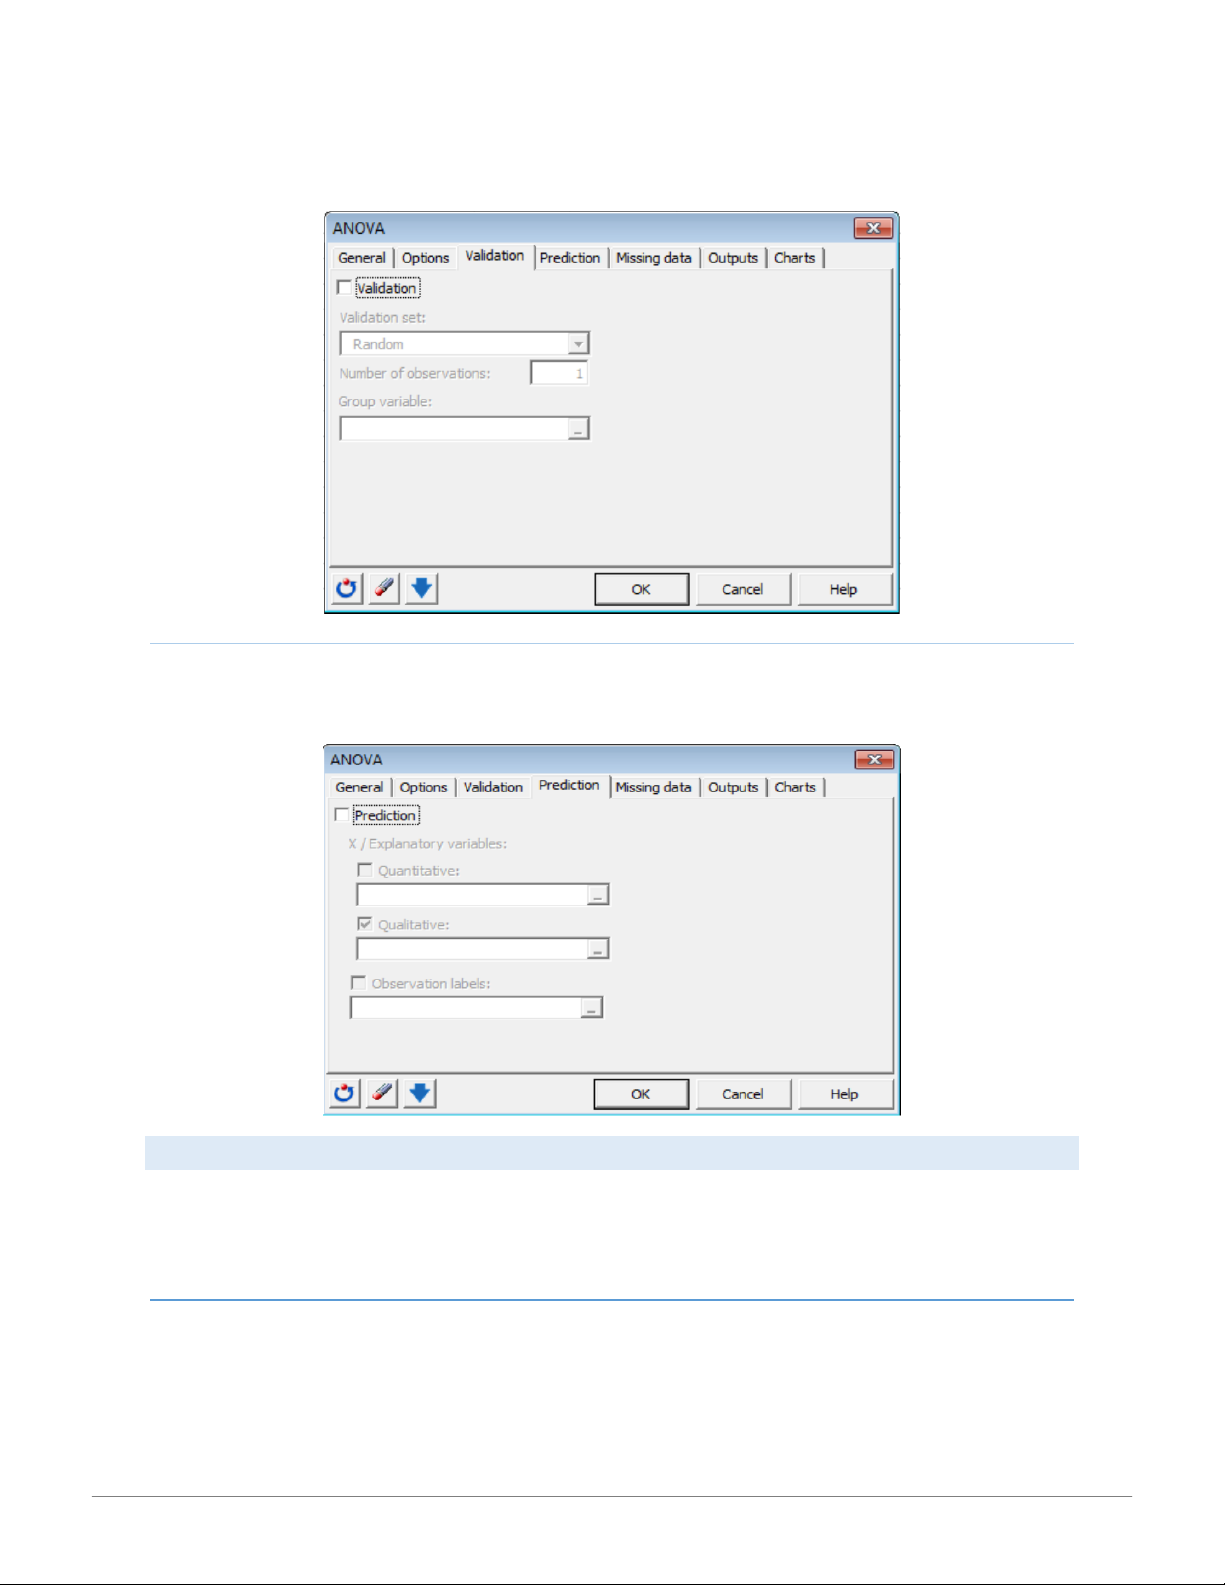
In the Validation tab, activate the Validation option if you want to use a sub-sample of data to validate the model. Define the
method for obtaining the validation set as random, N last rows, N first rows, or Group variable. 9 15:01, 11/01/2026
XLSTAT Tip Sheet for Business Statistics - CENGAGE LEARNING - Studocu PRE DIC TION TA B
Activate the Prediction option in the Prediction tab to select data to use in prediction model. The data for Quantitative or Qualitative
variables must not include variable labels. MISSING DATA TAB
Activate the Remove the observations: option to remove the observations with missing data. The observations may be removed for
each Y separately or across all Ys. Activate the Estimate missing data: option to estimate missing data before starting computations.
The missing data may be estimated as the Mean or mode or Nearest neighbor. OUTPUTS TAB
In the General sub-tab of the Outputs tab, defaults output is selected for Descriptive statistics, Correlations, Analysis of variance,
Standardized coefficients, Predictions and residuals. In the Contrasts sub-tab of the Outputs tab, activate the Compute contrasts 10 15:01, 11/01/2026
XLSTAT Tip Sheet for Business Statistics - CENGAGE LEARNING - Studocu
option to compute contrasts, then select the contrasts table. There must be one column per contrast and one row for each coefficient of the model. CH AR TS TAB
In the Charts tab, Regression charts, Standardized coefficients, Predictions and residuals, and Confidence intervals are displayed by
default. De-select any option to remove its display. ANALYSIS OF VARI ANCE (ANOVA)
Use this tool to carry out ANOVA (ANalysis Of VAriance) of one or more balanced or unbalanced factors.
ANOVA uses the same conceptual framework as linear regression. The presented dialog box options will be much the same. The
main difference is that the explanatory variables are qualitative. Thus, required data organization for ANOVA in XLSTAT differs from
data normally available for datasets provided with most texts. Consider the following data from National Computer Products, Inc. A 11 15:01, 11/01/2026
XLSTAT Tip Sheet for Business Statistics - CENGAGE LEARNING - Studocu
quality awareness examination was given to employees from three plants. Managers want to test the hypothesis that the mean
examination score is the same for all three plants. You might receive (or expect to receive) the data in the following format:
XLSTAT expects that the data is organized as found in the Regression format where the quantitative data are in a single column. This
data is delineated by city by qualitative data in an adjacent column as shown here: GE NER AL TAB
In the General tab, select the Quantitative: data you want to model as the Y/Dependent variables (data from column F above). In
the X/Explanatory variables section choose Qualitative: explanatory variables (the factors from column E in the above example).
Note that the data as presented does not include Variable labels and the output will be produced in a new worksheet. 12 15:01, 11/01/2026
XLSTAT Tip Sheet for Business Statistics - CENGAGE LEARNING - Studocu OPTIONS TAB
Activate the Fixed Intercept: option to set the regression constant to a fixed value (default 0). The Tolerance: option (default 0.0001)
prevents the OLS regression algorithm from considering variables which are constant or too correlated with other variables in the
model. The Interactions/Level: option allows you to include interactions in the model. Select a value between 1 and 4. Use the
Confidence interval (%): option to enter the percentage range of the confidence interval (default .95).
A number of Constraints: are available as a1 = 0, an = 0 (default), Sum (ai) = 0, and Sum (ni.ai) = 0. These options are fully described
in the Description section of the Help system in XLSTAT.
Activate the Random effects option to include random factors in the model displayed as an expected mean squares table. VAL ID ATION T AB
Activate this option to use a sub-sample of the data to validate the model. Define how to obtain the observations as random, N last
rows, N first rows, or a group variable which is a binary with the 1s option identifying the observations to use for the validation. 13 15:01, 11/01/2026
XLSTAT Tip Sheet for Business Statistics - CENGAGE LEARNING - Studocu PRE DIC TION TA B
Activate the Prediction option in the Prediction tab to select data to use in prediction model. The data for Quantitative: or
Qualitative: variables must not include variable labels. CO RREL ATION TE STS
Use this tool (in the Correlation/Association tests tab) to compute the correlation coefficients of Pearson, Spearman or Kendall,
between two or more variables, and to determine if the correlations are significant or not. Several visualizations of the correlation
matrices are proposed. The Pearson correlation coefficient corresponds to the classical linear correlation coefficient for continuous
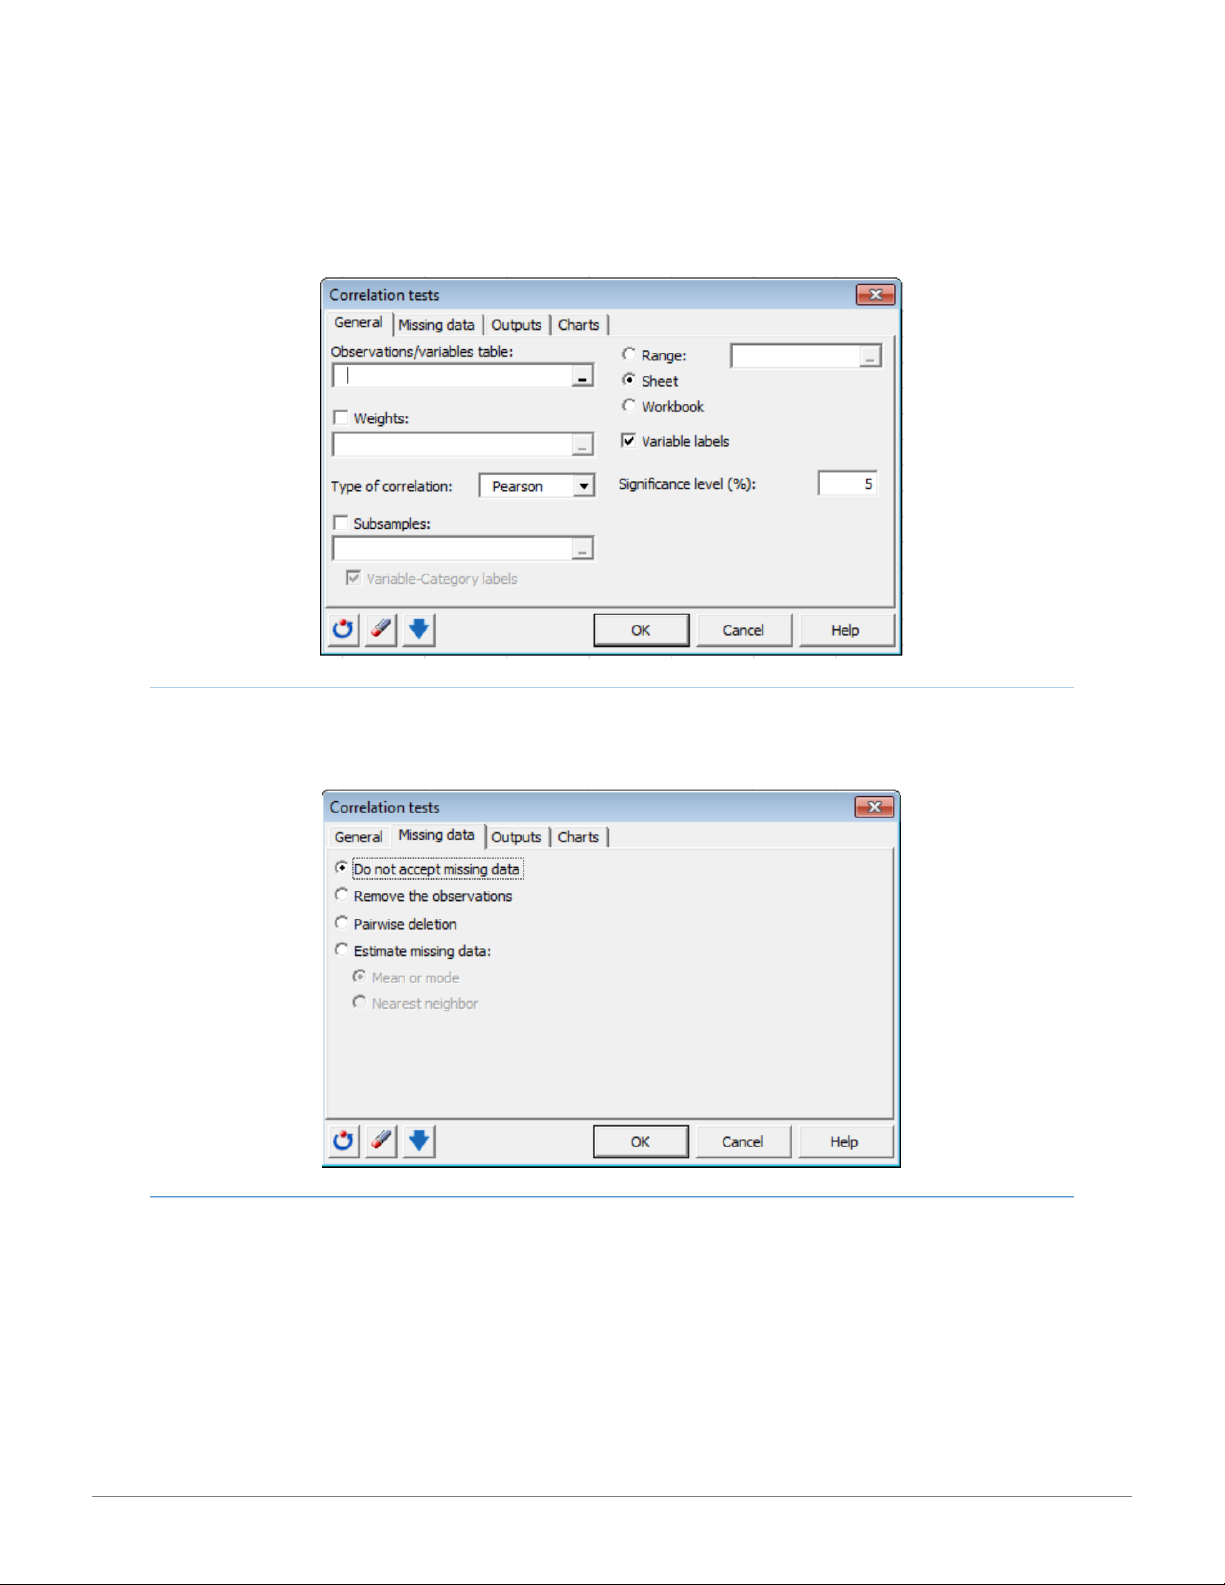
data. Its value ranges from -1 to 1, and it measures the degree of linear correlation between two variables. GE NER AL TAB
Select a table in Excel of N observations (rows) described by P variables (columns)in the Observations/variables table: option.
Activate the Weights: option as a number greater than or equal to 0 if the observations are weighted. Check the Subsamples: option 14 15:01, 11/01/2026
XLSTAT Tip Sheet for Business Statistics - CENGAGE LEARNING - Studocu
to select a column showing the names or indexes of the subsamples for each of the observations. All computations are then performed. MISSING DATA TAB
Use the Missing data tab to determine how missing data should be treated in calculations: Do not accept missing data, Remove the
observations, Pairwise deletion or Estimate missing data using the mean or mode or nearest neighbor. OUTPUTS TAB
In the Output tab, default settings include descriptive statistics, correlations, p-values, and coefficients of determination. Choose the
Sort the variables option to provide the data sorted alphabetically by variable name. 15 15:01, 11/01/2026
XLSTAT Tip Sheet for Business Statistics - CENGAGE LEARNING - Studocu CH AR TS TAB
Use the charts tab to visualize the correlation matrix as a set of Correlation maps or Scatter plots. Correlation maps may be provided
in blue-red, black and white, or patterns scales to represent positive and negative correlations. Present scatter plots as histogram or
Q-Q matrix plots or confidence ellipses, for a x% confidence interval for a bivariate normal distribution. Additionally colors by correlation may be added. PARAMETRIC TES TS
Use this tool (in the Parametric tests tab) to conduct one- and two-sample t and z tests, one-and two-sample variance tests, z-tests
for one and two proportions, and the multinomial goodness of fit test. Tests are said to be parametric since their use requires the
assumption that the samples are distributed normally. Additionally, it is also assumed that observations are independent and identically distributed.
ONE-SAMPLE T -TES T AN D Z- TEST 16 15:01, 11/01/2026
XLSTAT Tip Sheet for Business Statistics - CENGAGE LEARNING - Studocu
Use this tool to compare the mean of a normally-distributed sample with a given value. Two parametric tests are possible. Student's
t test if the true variance of the population from which the sample has been extracted is not known; the variance of sample s2 is
used as the variance estimator. Use the z test if the true variance s² of the population is known. Three types of test are possible
depending on the alternative hypothesis chosen: Two-tailed test Ha: u ≠ u0
Left one-tailed test Ha: u < u0
Right one-tailed test Ha: u > u0 GENERAL TAB
Select the data in the Excel worksheet. Choose the Data format: as One column/row per sample which considers each column or row
as a sample and allows for testing hypotheses on several samples at the same time OR One sample: to consider all values as a single
sample. Activate the Column/row labels option if the selected data contain labels. Activate the z Test or Student’s t Test option
depending on the type of test to be conducted. OPTIONS TAB
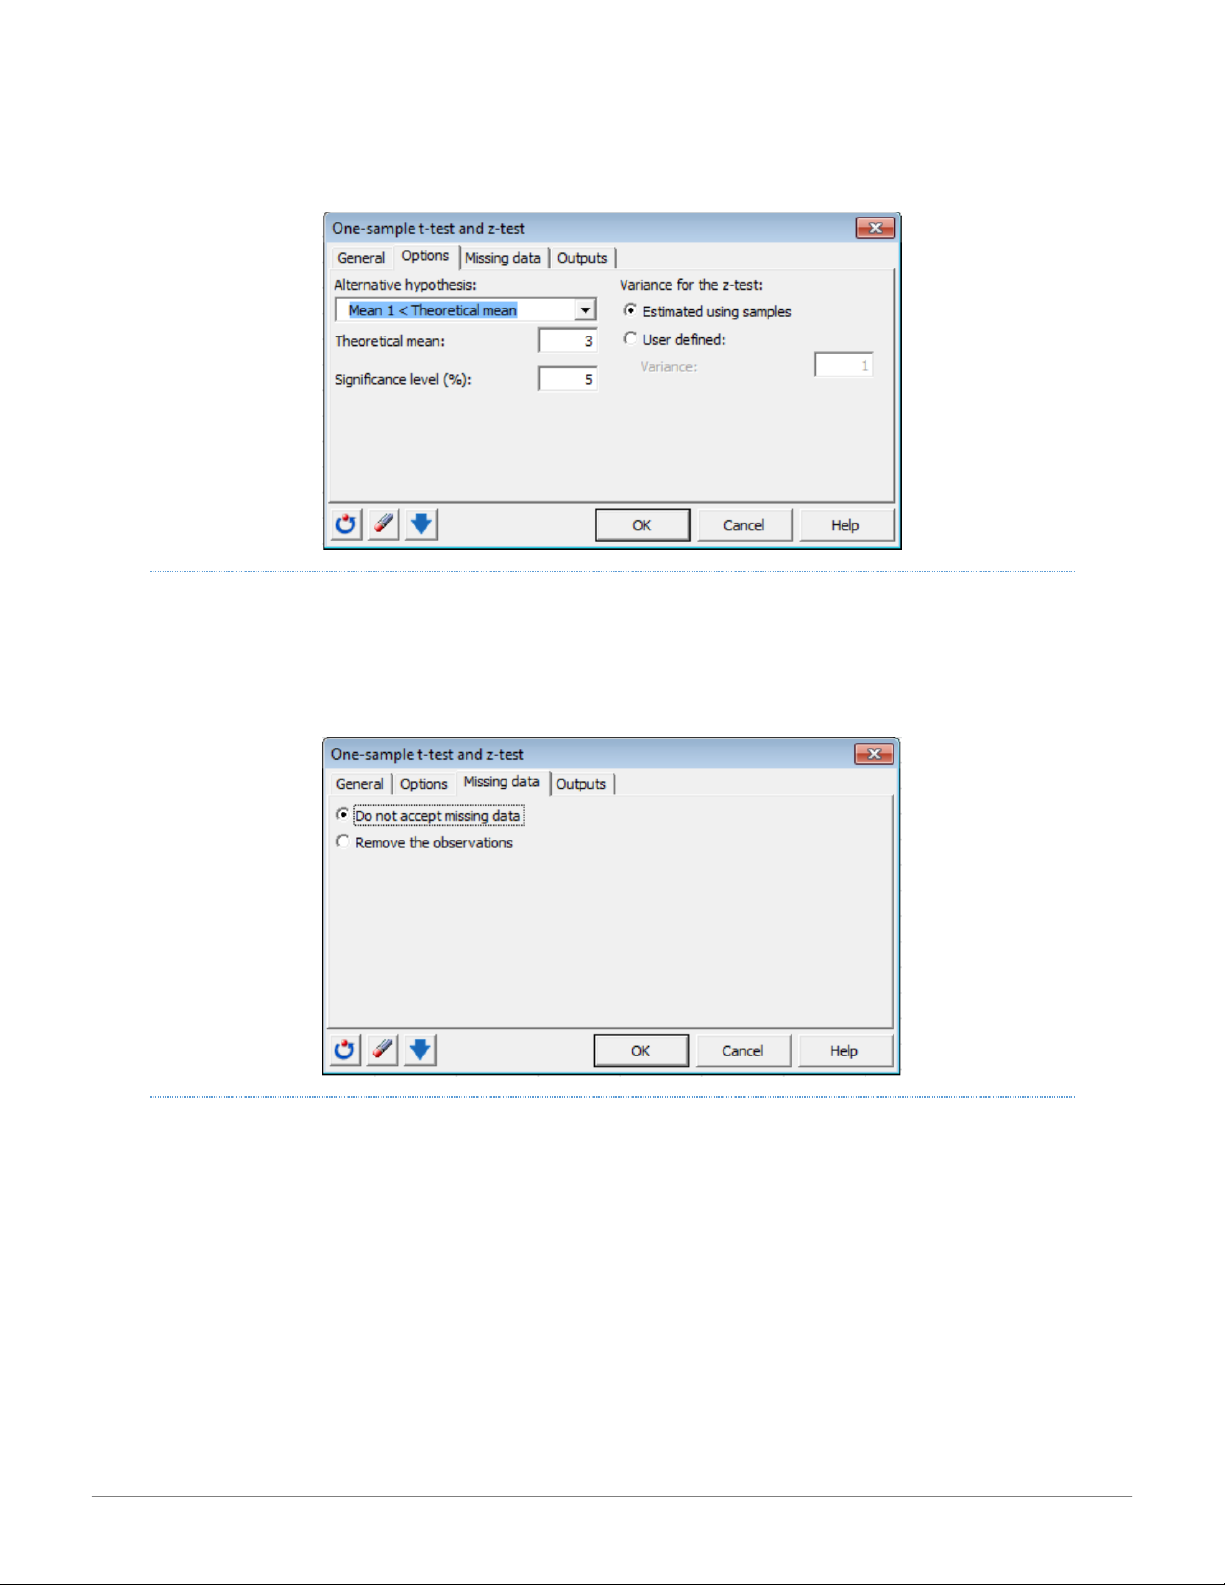
Choose the Alternative hypothesis: to be used for the test. Enter the value of the Theoretical mean: with which the mean of the
sample is to be compared, and the Significance level (%): for the tests (default value: 5%). If the z test option has been selected,
indicate whether the Variance for the z-test: should be Estimated using samples or User defined: which requires a value to be entered for the variance. 17 15:01, 11/01/2026
XLSTAT Tip Sheet for Business Statistics - CENGAGE LEARNING - Studocu MISSING DATA TAB
Activate the desired option: Do not accept missing data OR Remove the observations. If the missing data option is activated, XLSTAT
will discontinue calculations if missing values are detected. The remove observations option will remove observations with missing data and continue processing. OUTPUTS TAB
The Outputs tab allows you to display the descriptive statistics of the samples (default). 18 15:01, 11/01/2026
XLSTAT Tip Sheet for Business Statistics - CENGAGE LEARNING - Studocu
TW O- SAMP LE T -TEST AN D Z-TEST
Use this tool to compare the means of two normally distributed independent or paired samples. A distinction is made between
independent samples (for example a comparison of annual sales by shop between two regions for a chain of supermarkets), or
paired samples (for example if comparing the annual sales within the same region over two years). When comparing the means of 2
independent samples, use Student's t test if the true variance of the populations from which the samples are extracted is not known;
the z test if the true variance s² of the population is known. When the Student’s t Test is used a decision must be made about the
equality/inequality of variances. When comparing the means of two paired samples, sample sizes of the paired samples must be the
same size. Where values are missing from certain observations, either the observation is removed from both samples or the missing values are estimated.
Three types of test are possible depending on the alternative hypothesis chosen
Two-tailed test Ha: u1 – u2 ≠ D
Left one-tailed test Ha: u1 – u2 < D
Right one-tailed test Ha: u1 – u2 > D GENERAL TAB
Sample 1: If the format of the selected data is "one column per variable", select the data for the various samples in the Excel
worksheet. If the format of the selected data is "one column per sample" or "paired samples", select a column of data corresponding to the first sample.
Sample 2: If the format of the selected data is "one column per variable", select the data identifying the two samples to which the
selected data values correspond. If the format of the selected data is "one column per sample" or "paired samples", select a column
of data corresponding to the second sample.
Choose the Data format: as One column/row per sample, One column/row per variable, or Paired samples. Activate the Column/row
labels option if the first row/column of the selected data contain labels. Activate the z-test or Student’s t test to indicate the type of test to execute. 19 15:01, 11/01/2026
XLSTAT Tip Sheet for Business Statistics - CENGAGE LEARNING - Studocu OPTIONS TAB
Choose the Alternative hypothesis: to be used for the test. Enter the value of the supposed difference between the samples as the
Hypothesized difference (D): Enter the significance level for the tests (default value: 5%) as the Significance level (%):. A Weights:
option is available if the data format is “One column/row per variable” or if the data are paired. Check this option if the observations are weighted.
Where a z test has been requested, the value of the known variance of the populations, or, for a test on paired samples, the variance
of the difference must be entered. Choose the Estimated using samples option to estimate the variance of the population from the
sample data (leads to a t test). Choose the User defined: option to enter the values of the known variances of the populations. For t-
test samples variances, activate Assume equality to consider sample variances equal, Cochran-Cox to calculate the p-value using the
Cochran and Cox method where the variances are assumed to be unequal, and Use an F test to use Fisher’s F test to determine
whether the variances of both samples can be considered to be equal or not. MISSING DATA
In the Missing data tab, activate the appropriate option to not accept missing data, remove the observations, or ignore missing data (default). 20
Tài liệu liên quan:
-

Bảng giá trị phân phối thống kê poisson và student môn Xác suất thống kê| Trường Đại học Ngoại Thương
27 14 -

Bảng giá trị quyết định thống kê wilcoxon rank-sum test môn Xác suất thống kê| Trường Đại học Ngoại Thương
29 15 -

Bài 1 Định nghĩa cổ điển về xác suất môn Xác suất thống kê| Trường Đại học Ngoại Thương
26 13 -

Exercises for probability & statistics môn Xác suất thống kê| Trường Đại học Ngoại Thương
26 13 -

Đề thi cuối kỳ lý thuyết môn Xác suất thống kê| Trường Đại học Ngoại Thương
27 14