1072-Article Text-3276-1-10-20231220 - Tài liệu tham khảo | Đại học Hoa Sen
1072-Article Text-3276-1-10-20231220 - Tài liệu tham khảo | Đại học Hoa Sen và thông tin bổ ích giúp sinh viên tham khảo, ôn luyện và phục vụ nhu cầu học tập của mình cụ thể là có định hướng, ôn tập, nắm vững kiến thức môn học và làm bài tốt trong những bài kiểm tra, bài tiểu luận, bài tập kết thúc học phần, từ đó học tập tốt và có kết quả
Môn: Toán rời rạc(qe) 11 tài liệu
Trường: Trường Đại học Hoa Sen 5.3 K tài liệu
Tác giả:


Preview text:
4th International Conference Eco-Innovation in Science, Engineering, and Technology Volume 2023
http://dx.doi.org/10.11594/nstp.20 3.36 2 33 Conference Paper
Quality Control Analysis to Reduce Instant Noodle Product Defects with Six Sigma and Kaizen Method
Sumiati, Isna Nugraha*, Dwi Sukma Donoriyanto
Department of Industrial Engineering, Faculty of Engineering and Sains, Universitas Pembangunan Nasional
“Veteran” Jawa Timur, Surabaya 60294, Indonesia *Corresponding author: ABSTRACT E-mail:
isna.nugraha.ti@upnjatim.ac.id PT. XYZ is a company operating in the food industry, with its main product being
instant noodles. In its production process, not all products produced meet the
quality standards set by the company. This indicates the presence of defective
products, often due to errors in factors such as machinery or human resources,
among others. Initial observations reveal that there are still many defects in their
products. Quality control at PT. XYZ is done manually by the owner, who
supervises each production cycle. Defects in PT. XYZ's products are categorized
into three types: torn noodle packaging, crushed noodles, and torn seasoning
packaging. Therefore, improvements are needed in the production of instant
noodles by PT. XYZ. This research aims to improve the quality of production in
the company and to explain the approach to analyzing the defect rate of instant
noodles using Six Sigma and Kaizen. The results obtained using the Six Sigma
method in the DMAIC analysis (Define, Measure, Analyze, Improve, Control),
showed that product quality testing during the instant noodle production
process resulted in 3238 failures. The Defects Per Million Opportunities (DPMO)
value was 41172.88, which, when converted to a sigma level, was 3.23, indicating
that the sigma level was at the industry average in Indonesia. This suggests that
there is a potential for 41172.88 defects per one million productions, showing an
inconsistent pattern of DPMO and sigma achievement. This indicates that the
production process has not been managed accurately and requires
improvement, particularly in the quest for zero defects.
Keywords: Instant noodles, quality, production, six sigma, FMEA, Kaizen Introduction
In the global market competition, only high-quality products wil consistently attract demand, as
quality is one of the key components that can serve as a solid foundation and tool for any company to
survive and even excel in any era of competition (Nugraha et al., 2020). In the food industry, product
quality is a defining factor for a company's success (Latifah et al., 2022). This is particularly true for
everyday consumer products such as instant noodles. The higher the product quality, the greater the
opportunity to win the hearts of consumers and succeed in the fierce market competition. On the other
hand, product defects can result in financial losses, damage to brand reputation, and customer dissatisfaction.
PT. XYZ is a company operating in the food industry, with its main product being instant noodles.
In its production process, not al products produced meet the quality standards set by the company.
This indicates the presence of defective products, often due to errors in factors such as machinery or
human resources, among others. Initial observations reveal that there are stil many defects in their
products. Quality control at PT. XYZ is done manual y by the owner, who supervises each production How to cite:
Sumiati, Nugraha, S., & Donoriyanto, D. S. (2023). Quality control analysis to reduce instant noodle product defects with six sigma and
kaizen method. 4th International Conference Eco-Innovation in Science, Engineering, and Technology. NST Proceedings. pages 231-238. doi: 10.11594/ nstp.2023.3633 4th ICESET
cycle. Defects in PT. XYZ's products are categorized into three types: torn noodle packaging, crushed
noodles, and torn seasoning packaging. Therefore, improvements are needed in the production of instant noodles by PT. XYZ.
To achieve high product quality and reduce defect rates in instant noodle production, a proven
approach is to use Six Sigma (Smętkowska & Mrugalska, 2018). Six Sigma is a quality management
methodology that focuses on reducing variation in the production process (Saleh, 2022). By identifying
sources of defects, measuring defect rates, analyzing data, implementing improvements, and
control ing processes, Six Sigma helps companies achieve consistent and high-quality products (Qothrunnada et al., 2022).
Another approach often used in conjunction with Six Sigma is Kaizen. Kaizen is a philosophy of
continuous improvement that encourages gradual improvements throughout the organization
(Mahmod et al., 2017). In the context of instant noodle production, Kaizen can help discover innovative
ways to reduce defects, improve efficiency, and enhance quality on a sustainable basis (Bordin et al., 2018).
This research aims to explain the approach to analyzing the defect rate of instant noodles using
Six Sigma and Kaizen. The researcher wil discuss the basic concepts of Six Sigma, its steps, and how to
apply it in the context of instant noodle production. The primary goal is to help companies identify and
reduce sources of defects, improve efficiency, and achieve higher product quality in their instant
noodles. By implementing Six Sigma, companies can improve their production processes, reduce costs,
and enhance customer satisfaction (Nandakumar et al., 2020). Al of these contribute to achieving a
competitive advantage in an increasingly competitive market. Material and Methods
The research was conducted at PT. XYZ, is located in Surabaya, East Java. The product under
investigation was instant noodles. The data used in this research included data on the types of defects
and the quantity of defective products in instant noodles over a period. Data col ection was carried out
every working day for three months (from February 2022 to April 2022) in the instant noodle
production process. This research process fol ows the DMAIC (Define, Measure, Analyze, Improve,
Control) stages, referencing Kholil (2023) and Hendy (2015) for problem-solving and process improvement. 1. Define
The steps in this stage are as fol ows: a. Process Mapping: This stage wil present the sequence of the production process. 2. Measure
The second step is measurement, which includes the fol owing stages:
a. Determining CTQ (Critical to Quality).
b. Identifying the sequence of CTQ (Critical to Quality) using a Pareto diagram.
c. Measuring Process Stability (Proportion, CL, UCL, LCL, and control chart p), based on Fon- seca (2017).
d. Measuring Process Capability to determine the DPMO value and sigma value (Wahyuni et al., 2015; Cheng, 2018). 3. Analyze
a. Identifying the Causes of Defects using FMEA. Subsequently, the calculation of RPN (Risk
Potential Number) is performed to determine the dominant factors that frequently occur
in the production process (Rochmoeljati et al., 2022).
b. Root Cause Analysis using a fishbone diagram through the perspective of five factors: hu-
man, method, machine, material, and environment (Shania et al., 2022). 232 4th ICESET 4. Improvement and Control
At this stage, proposed improvements and controls obtained from the interpretation of the
results are presented. To provide improvement proposals, this wil be done through the 5W-
1H concept: What, Why, Where, When, Who, and How. Furthermore, Kaizen wil be
determined as a recommendation for improvement using the Kaizen Five-Step Plan and
Kaizen Five M Checklist (Nugraha, 2022; Hil , 2014). Results and Discussion Define
The Define stage is the first step in the DMAIC cycle, where in this stage, the identification of the
research object is conducted to determine the targets that the research wil focus on. In this stage,
mapping is also done on instant noodles using a SIPOC diagram to understand the production flow.
Table 1. Identification of defects in instant noodles Type of Defect Information
Torn Noodle Packag- The source of the damage is when the machine is unstable due to a lack of ing
spare part maintenance, making the machine less effective in sealing the
noodle packaging, which results in torn noodle packaging. Crushed Noodles
The source of the damage is rough and careless distribution process and in-
adequate supervision during the handling, leading to torn noodle packaging. Torn
Seasoning The source of the damage is the unreliable sealing of noodle packaging in the Packaging
production machine, resulting in easy tearing of the seasoning packaging, as
wel as employee negligence in product inspection, causing torn seasoning packaging. Measure
In this stage, which is the second operational step in the DMAIC cycle, measurements are taken
on the research object, which is instant noodles. Inspection is carried out in terms of defect rates, and
performance baselines are measured over the period from February 2022 to April 2022. For
performance baselines, what wil be sought is the DPMO level and sigma level.
Table 2. Calculation of DPO, DPMO, six sigma for instant noodle products Date
Observation (n) Defect (unit) CTQ DPO DPMO Sixsigma (unit) 18/02/2022 520 59 3 0.113462 37821 3.2766 19/02/2022 519 53 3 0.1021 34040 3.3245 20/02/2022 523 61 3 0.1166 38878 3.2639 21/02/2022 525 66 3 0.1257 41905 3.2290 22/02/2022 518 54 3 0.1042 34749 3.3152 23/02/2022 520 59 3 0.1135 37821 3.2766 24/02/2022 519 59 3 0.1137 37893 3.2757 25/02/2022 524 62 3 0.1183 39440 3.2572 26/02/2022 520 56 3 0.1077 35897 3.3004 27/02/2022 530 74 3 0.1396 46541 3.1794 28/02/2022 528 70 3 0.1326 44192 3.2040 30/03/2022 524 62 3 0.118321 39440 3.2572 01/03/2022 525 68 3 0.1295 43175 3.2150 To be continued…. 233 4th ICESET Date
Observation (n) Defect (unit) CTQ DPO DPMO Sixsigma (unit)
02/03/2022 518 56 3 0.1081 36036 3.2987 03/03/2022 526 68 3 0.1293 43093 3.2159 04/03/2022 524 67 3 0.1279 42621 3.2211 05/03/2022 518 55 3 0.1062 35393 3.3069 06/03/2022 520 55 3 0.1058 35256 3.3086 07/03/2022 521 61 3 0.1171 39028 3.2621 08/03/2022 525 68 3 0.1295 43175 3.2150 09/03/2022 527 66 3 0.1252 41746 3.2308 10/03/2022 524 62 3 0.1183 39440 3.2572 11/03/2022 522 60 3 0.1149 38314 3.2706 12/03/2022 522 62 3 0.1188 39591 3.2554 13/03/2022 525 70 3 0.1333 44444 3.2013 14/03/2022 524 61 3 0.1164 38804 3.2647 15/03/2022 530 74 3 0.140 46541 3.1794 16/03/2022 522 64 3 0.1226 40868 3.2407 17/03/2022 529 71 3 0.1342 44739 3.1982 18/03/2022 530 69 3 0.1302 43396 3.2126 19/03/2022 529 65 3 0.1229 40958 3.2397 20/03/2022 530 80 3 0.1509 50314 3.1418 21/03/2022 522 60 3 0.1149 38314 3.2706 22/03/2022 528 73 3 0.1383 46086 3.1841 23/03/2022 527 68 3 0.1290 43011 3.2168 24/03/2022 528 71 3 0.1345 44823 3.1973 25/03/2022 528 68 3 0.1288 42929 3.2177 26/03/2022 526 66 3 0.1255 41825 3.2299 27/03/2022 529 81 3 0.1531 51040 3.1349 28/03/2022 525 85 3 0.1619 53968 3.1075 29/03/2022 526 66 3 0.1255 41825 3.2299 30/03/2022 519 58 3 0.1118 37251 3.2835 31/03/2022 520 58 3 0.1115 37179 3.2844 01/04/2022 522 67 3 0.1284 42784 3.2193 02/04/2022 522 61 3 0.1169 38953 3.2630 03/04/2022 523 64 3 0.1224 40790 3.2416 04/04/2022 525 61 3 0.11619 38730 3.2656 05/04/2022 527 71 3 0.1347 44908 3.1964 06/04/2022 518 59 3 0.1139 37967 3.2748 07/04/2022 524 64 3 0.1221 40712 3.2425 Average 524 64.76 3 0.1235 41172.88 3.2391 Total 26200 3238
Measuring the DPMO Level (Defects Per Mil ion Opportunities):
𝑇ℎ𝑒 𝑛𝑢𝑚𝑏𝑒𝑟 𝑜
𝑓 𝑑𝑒𝑓𝑒𝑐𝑡𝑖𝑣𝑒 𝑝𝑟𝑜𝑑𝑢𝑐𝑡𝑠 𝐷𝑃𝑂 =
𝑁𝑢𝑚𝑏𝑒𝑟 𝑜𝑓 𝑢𝑛𝑖𝑡𝑠 𝑖𝑛𝑠𝑝𝑒𝑐𝑡𝑒𝑑 𝑥 𝑛𝑢𝑚𝑏𝑒𝑟 𝑜𝑓 𝑝𝑜𝑡𝑒𝑛𝑡𝑖𝑎𝑙 𝑓𝑎𝑖𝑙𝑢𝑟𝑒𝑠 DPMO = DPO x 1.000.000
Based on the calculation table of DPMO and sigma level values from instant noodle production
during the period from February 2022 to April 2022, the Defects Per Mil ion Opportunities (DPMO) 234 4th ICESET
value obtained is 41,172.88, which is then converted to a sigma level of 3.23. This indicates that the
sigma level is at the industry average in Indonesia.
It can be explained that there is a possibility of 41,172.88 defects per one mil ion productions. This
suggests an inconsistent pattern of DPMO and sigma achievement, indicating that the production
process has not been managed accurately and stil requires improvement. If not addressed properly, it
wil result in losses for the company because the more defective products there are, the higher the
cost escalation in the production process. Although the company has achieved an above-average sigma
value in the Indonesian industry, the company should strive to reach a sigma level of 6. If a company
cannot reach a sigma level of 6, it may be categorized as not yet a competitive company (Jirasukprasert et al., 2014). Analyze
Based on the measurements in the previous stage, it can be determined that there are 3 types of
defects that need to be improved, namely torn noodle packaging, crushed noodles, and torn seasoning
packaging. Among these three defects, torn seasoning packaging is the one to be prioritized for
improvement because it occupies the first rank in the Pareto diagram from February 2022 to April
2022, with a percentage of 37%, 33%, 30% and a cumulative percentage of 100%.
Table 3. Critical to Quality (CTQ) Type of Defect Total Cumulative % % Cumulative Torn Noodle Packaging 1214 1214 37% 37% Crushed Noodles 1050 2264 33% 70% Torn Seasoning Packaging 974 3238 30% 100% Total 3238 100% Torn Noodle Packaging Crushed Noodles Torn Seasoning Packaging Figure 1. Pareto diagram
From the identification and observations of Indomie Instant Noodles products, it can be concluded
that the defect caused by torn noodle packaging is 37%, the defect caused by crushed noodles is 33%,
and for the defect caused by torn seasoning packaging is 30%. Therefore, it can be determined that
the largest defect is caused by torn noodle packaging. From these three causes of defects, based on
the observations, it can be concluded that addressing the defect of torn noodle packaging should be
given the highest priority for reduction because successfully reducing it wil have an impact on the other causes. 235 4th ICESET
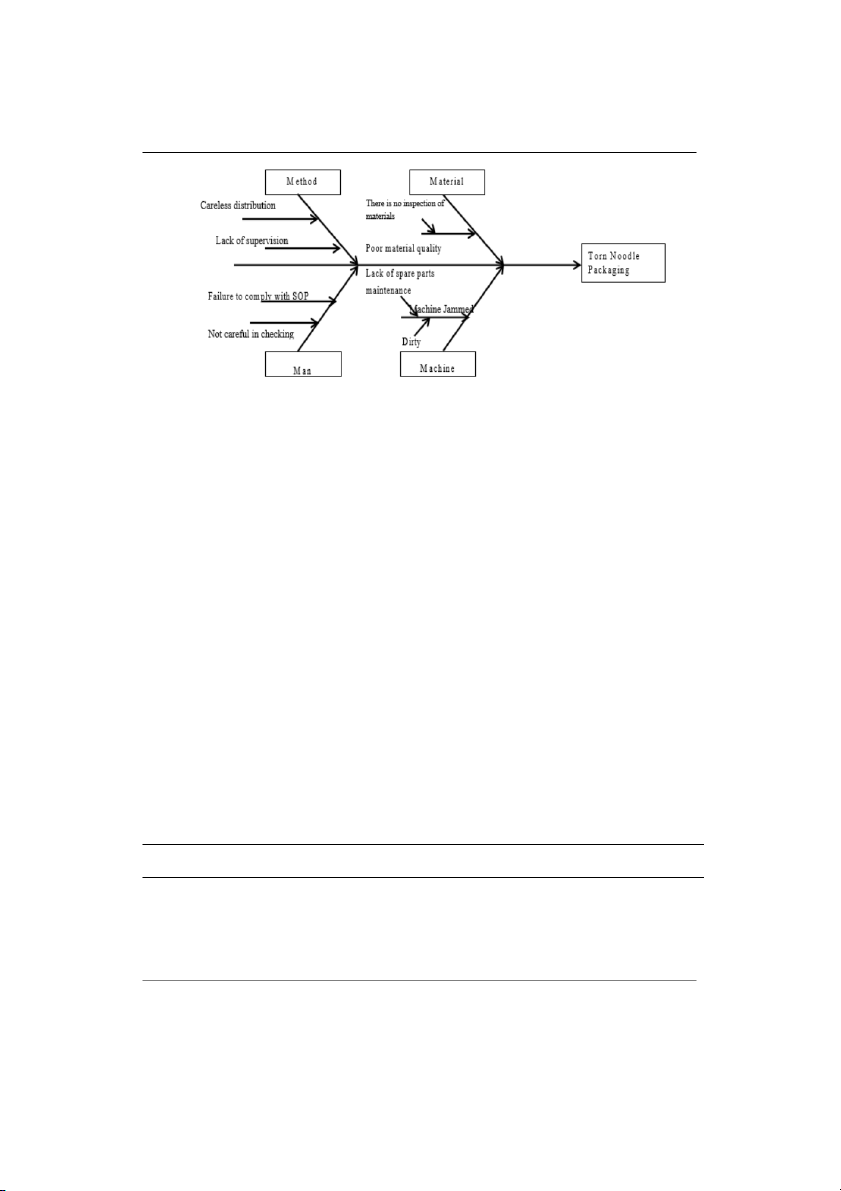
Figure 2. Fishbone diagram for the largest defect: Torn noodle packaging
In the diagram above, the non-conformity of torn noodle packaging is caused by four factors:
method, material, man, and machine. In the method, it's due to an inattentive distribution process and
lack of supervision during the work. Material or raw materials have a significant impact on the
packaging production process; defects occur due to poor material quality and lack of material
inspection. In the machine, defects are caused by unstable machine operation due to a lack of spare
part maintenance, resulting in ineffective sealing of noodle packaging and making it easy to tear.
Meanwhile, in the man or human factor, it's due to a lack of attentiveness during the production
process and inspection, which is caused by a lack of focus while working and not adhering to the
applicable Standard Operating Procedures (SOP). Improve
After identifying the sources of the problem, the next step is to establish an action plan to reduce
the number of defects. The purpose of developing this improvement plan is to enhance quality. In
essence, the improvement plan describes the al ocation of resources and the priority of alternatives
implemented in the execution of the improvement plan.
The improvement plan is derived by combining the company's brainstorming results with the
conditions at the location of the research on the instant noodle production process. The tool used to
determine the priority of the improvement plan is Failure Mode and Effect Analysis (FMEA). Through
FMEA, we can propose improvements to the company. Technical y, the assessment of the severity of
potential errors on the process and consumers (S), the frequency of errors occurring due to potential
errors (O), and the impact on control tools due to potential cause detection (D) are determined through
brainstorming. From this determination, the Risk Potential Number (RPN) is obtained by multiplying S
x O x D (severity, occurrence, and detection). The standard reference table for severity (S), occurrence
(O), and detection (D) is used. Here are the results of FMEA (Table 1). Table 4. FMEA and kaizen No Factor Potential Root Cause S O D RPN Improvement Actions Problem 1 Torn Material Poor material 8 5 4 160 Purchase higher-quality Noodle quality materials for instant noo- dle packaging. To be continued… 236 4th ICESET No Factor Potential Root Cause S O D RPN Improvement Actions Problem Packag- Method Failure to seal the 8 4 3 96 Monitor during the in- ing noodle packaging stant noodle packaging tightly pressing process. Machine Machine jam- 6 5 5 150 Perform regular mainte- ming nance of machine spare parts. Man Lack of thorough 8 2 3 48 Monitor during the in- inspection spection process. 2
Crushed Material Poor quality ma- 7 5 3 105 Purchasing higher-qual- Noodles terials ity raw materials for in- stant noodles. Method Careless noodle 8 6 6 288 Encouraging careful noo- arrangement dle arrangement to pre- vent breakage. Machine Machine jam- 6 5 5 150 Performing regular ming. maintenance of machine spare parts. Man Failure to adhere 6 5 4 120 Imposing sanctions on to the applicable employees who do not SOP. adhere to SOP. 3 Torn Material Poor quality ma- 6 4 4 96 Purchasing higher-qual- Season- terials ity raw materials for in- ing stant noodle seasoning Packag- packaging ing Method Inaccurate sea- 7 6 3 126 Encouraging accurate soning measure- seasoning measurement ment according to the volume of instant noodle season- ing packaging Machine Machine jam- 7 6 2 84 Performing regular ming maintenance of machine spare parts. Man Lack of diligence 9 5 5 225 Monitoring during the in- in inspection spection process. Control
This stage is the final operational stage. However, this research, couldn't implement control
because the Improve stage only extends to suggestions. Therefore, in this stage, the measurement
results are documented to serve as working guidelines. This is the last operational stage. As part of the
Six Sigma approach, supervision is necessary to ensure that the desired results are in the process of
being achieved. The results from the Improve stage must be implemented within a specific timeframe
to observe their impact on the quality of the resulting products. In the Control stage, the results of
quality improvement are documented and disseminated, successful best practices in process
improvement are standardized and disseminated, procedures are documented and used as standard
working guidelines and ownership or responsibility is transferred from the Six Sigma team to the process owner. 237 4th ICESET Conclusion
The results were obtained using the Six Sigma method for the issue at PT. XYZ, specifical y in the
DMAIC analysis (Define, Measure, Analyze, Improve, Control), showed that product quality testing
during the instant noodle production process resulted in 3238 failures. The Defects Per Mil ion
Opportunities (DPMO) value was 41,172.88, which, when converted to a sigma level, was 3.23,
indicating that the sigma level was at the industry average in Indonesia. This suggests that there is a
potential for 41,172.88 defects per one mil ion productions, showing an inconsistent pattern of DPMO
and sigma achievement. This indicates that the production process has not been managed accurately
and requires improvement, particularly in the quest for zero defects.
To achieve zero defects, it is recommended to conduct regular checks every two weeks on
maintenance and components, perform routine inspections of al materials, methods, workers, and
machines, and calculate DPMO and sigma values regularly to understand the production process in
terms of defect-free products per one mil ion opportunities and implement Standard Operating
Procedures (SOP) to prevent human errors that could disrupt the screen printing production process.
It is hoped that the quality of instant noodle production at PT. XYZ wil improve after the
implementation of these improvements. References
Bordin, M. F., Dal 'Agnol, A., Dal 'Agnol, A., Lantelme, E. M., & Costel a, M. F. (2018). Kaizen–analysis of the implementation of the A3 reporting
tool in a steel structure company. In Proc. 26th Annual Conference of the International, 294-304.
Cheng, L. J. (2018). Implementing six sigma within kaizen events, the experience of AIDC in Taiwan. The TQM Journal, 30(1), 43-53.
Fonseca, L. M. (2017). In search of six sigma in portuguese SMEs. International journal of industrial engineering and management, 8(1), 31-
38. https://doi.org/10.24867/IJIEM-2017-1-104
Hendy, T. (2015). Pengendalian kualitas six sigma. Yogyakarta: Penerbit Graha Ilmu
Hil , V. (2014). A Kaizen approach to food safety: Quality management in the value chain from wheat to bread. Springer Science & Business Media.
Jirasukprasert, P., Arturo Garza-Reyes, J., Kumar, V., & K. Lim, M. (2014). A Six Sigma and DMAIC application for the reduction of defects in a
rubber gloves manufacturing process. International journal of lean six sigma, 5(1), 2-21. https://doi.org/10.1108/IJLSS-03-2013-0020
Kholil, M. (2023). Implementation of lean manufacturing to reduce hold types of mission case products using DMAIC and KAIZEN Approach.
International Journal of Scientific and Academic Research (IJSAR), 3(2), 34-43. https://doi.org/10.54756/IJSAR.2023.V3.2.4
Latifah, Y. N., Susanto, I. P., Mulia, N. I., & Nugraha, I. (2022). Analisis pengendalian kualitas produk roti UD. XYZ dengan Total Quality Control
(TQC). Waluyo Jatmiko Proceeding, 15(1), 180-185.
Mahmod, R., Mashahadi, F., & Ashari, N. A. (2017). The influence of lean six sigma and Kaizen to reduce defect products in automotive
industry. Journal of Emerging Economies & Islamic Research, 5(4), 1-10. https://doi.org/10.24191/jeeir.v5i4.8839
Nandakumar, N., Saleeshya, P. G., & Harikumar, P. (2020). Bottleneck identification and process improvement by lean six sigma DMAIC
methodology. Materials Today: Proceedings, 24(2), 1217-1224. https://doi.org/10.1016/j.matpr.2020.04.436
Nugraha, I., Hisjam, M., & Sutopo, W. (2020, October). Aggregate planning method as production quantity planning and control to minimizing
cost. In IOP Conference Series: Materials Science and Engineering, 943(1), 012045. https://doi.org/10.1088/1757-899X/943/1/012045
Nugraha, I. (2022). Quality control analysis of steel plates products at PT. ABC using seven tools and Kaizen Method. Nusantara Science and
Technology Proceedings, 206-213.
Qothrunnada, A., Putra, D. H., & Nugraha, I. (2022). Analisis pengendalian kualitas produk konveksi dengan menggunakan metode six sigma
pada PT. XYZ. Waluyo Jatmiko Proceeding, 15(1), 139-145.
Rochmoeljati, R., Nugraha, I., & Mulia, N. A. C. (2022). Welding quality control using Statistical Quality Control (SQC) methods and Failure
Mode Effect Analysis (FMEA) at PT. XYZ. Nusantara Science and Technology Proceedings, 39-45.
Saleh, A. (2022). Analysis of quality control of T-Shirt screen printing products with six sigma DMAIC method on CV. Macca Clothing. Journal
of Industrial System Engineering and Management (JIEM), 7(1), 76-82.
Shania, M., Andryani, R. J., Jesselyn, C., & Nugraha, I. (2022). Analisis total quality control sebagai upaya meminimalisasi resiko kerusakan
produk otomotif pada PT. XYZ. Waluyo Jatmiko Proceeding, 15(1), 146-152.
Smętkowska, M., & Mrugalska, B. (2018). Using six sigma DMAIC to improve the quality of the production process: a case study. Procedia-
Social and Behavioral Sciences, 238, 590-596.
Wahyuni, H. C., Sulistiyowati, W., & Khamim, M. (2015). Pengendalian kualitas: aplikasi pada industri jasa dan manufaktur dengan Lean. Six
Sigma dan Servqual. Yogyakart: Graha Ilmu 238
Tài liệu liên quan:
-
Đề cương môn học Toán rời rạc | Đại học Hoa Sen
72 36 -
Bất đẳng thức Bunhiacopxki và ứng dụng - Toán rời rạc | Đại học Hoa Sen
523 262 -

Hệ thống khóa học IMO Toán - Toán rời rạc | Đại học Hoa Sen
341 171 -
Các thành tựu của Internet- Internet - Tài liệu tham khảo | Đại học Hoa Sen
308 154 -
Bai tap chuong 2 (p2) - tai lieu quan tron - Tài liệu tham khảo | Đại học Hoa Sen
199 100