A Multiobjective Optimization Approach for CCS Infrastructure Considering Cost and Environmental Impact
A Multiobjective Optimization Approach for CCS Infrastructure Considering Cost and Environmental Impact. Tài liệu được sưu tầm giúp bạn tham khảo, ôn tập và đạt kết quả cao. Mời bạn đọc đón xem.
Môn: Tài liệu Tổng hợp 3.6 K tài liệu
Trường: Tài liệu khác 3.9 K tài liệu
Tác giả:


Preview text:
Article pubs.acs.org/IECR
A Multiobjective Optimization Approach for CCS Infrastructure
Considering Cost and Environmental Impact
Jae-Uk Lee, Jee-Hoon Han,* and In-Beum Lee
Department of Chemical Engineering, POSTECH, Pohang, Korea
ABSTRACT: In this study, we address the design of a carbon capture and storage (CCS) infrastructure with economic and
environmental concerns. Given a set of available technologies to capture, sequestrate, and transport CO2, the problem consists of
determining the optimal planning of the CCS infrastructure capable of satisfying a predefined CO2 reduction target. The
planning task is formulated as a multiobjective mixed-integer linear programming (moMILP) problem, which simultaneously
accounts for the minimization of cost and environmental impact. The environmental impact is measured through all
contributions made by operation and installation of the CCS infrastructure. The emissions considered in the environmental
impact analysis are quantified according to the principles of Life Cycle Assessment (LCA), specifically the Eco-indicator 99
method. The multiobjective optimization problem was solved by using the ε-constraint method. The capability of the proposed
modeling framework is illustrated and applied to a real case study based on Korea, for which valuable insights are obtained. 1. INTRODUCTION
The two advantages of the LCA approach are that (i) it concerns
Carbon capture and storage (CCS) is receiving increasing
the entire life cycle from CO2 capture procedures to CO2 storage
interest as a key technology for reducing greenhouse gas (GHG)
procedures and (ii) it induces a damage model that cover the
emissions.1 A major challenge for the use of CCS is the need for a
emissions released, raw materials extracted, and waste generated
widespread infrastructure to capture, sequestrate, and transport
from the overall CCS infrastructure installation and system CO operation.
2. As the requirement of reducing CO2 emissions grows, cost-
effective strategies should be found to construct the CCS
Therefore, this study aims to address a holistic approach to infrastructure.
suggest the optimal planning of the CCS infrastructure with
Several papers have considered the design and operation of
environmental and economic concerns. Specifically, the main
cost-effective CCS infrastructure, including a mathematical
objective of this study is to develop a multiobjective
model for various activities such as capture, sequestration, and
mathematical model that considers the total cost and life cycle transportation of CO
impact of CCS infrastructure simultaneously. Hence, the ε-
2,2−4 a stochastic model considering uncertainty in CO
constraint method is also presented to expedite the search for the
2 emission,5 and a multiperiod model which addresses the variation of CO
Pareto solutions of the model. First, we will state the formal 2 emissions over a long time interval.6
definition of the problem. Then, the detailed mathematical Although CO
model follows. Finally, the capability of the proposed model is
2 emissions are reduced by operation of a CCS
system, previous studies confirmed that large amounts of raw
illustrated through its application to a real case study based on
materials and energy are used and pollutant substances are Korea.
emitted when the CCS system is established and operated.7−9 In
other words, other environmental pollutions excepting global 2. PROBLEM DESCRIPTION
warming are caused by the CCS system. Thus, the concern of
The objective of this paper is to address the optimal planning of a
environment impact of the CCS system has been an important
CCS infrastructure for reducing CO
factor to design the overall CCS system. 2 emissions with the goal of
Several recent studies also indicate that both economic and
minimizing the total cost and life cycle impact simultaneously.
environmental concerns have been essential decision-making
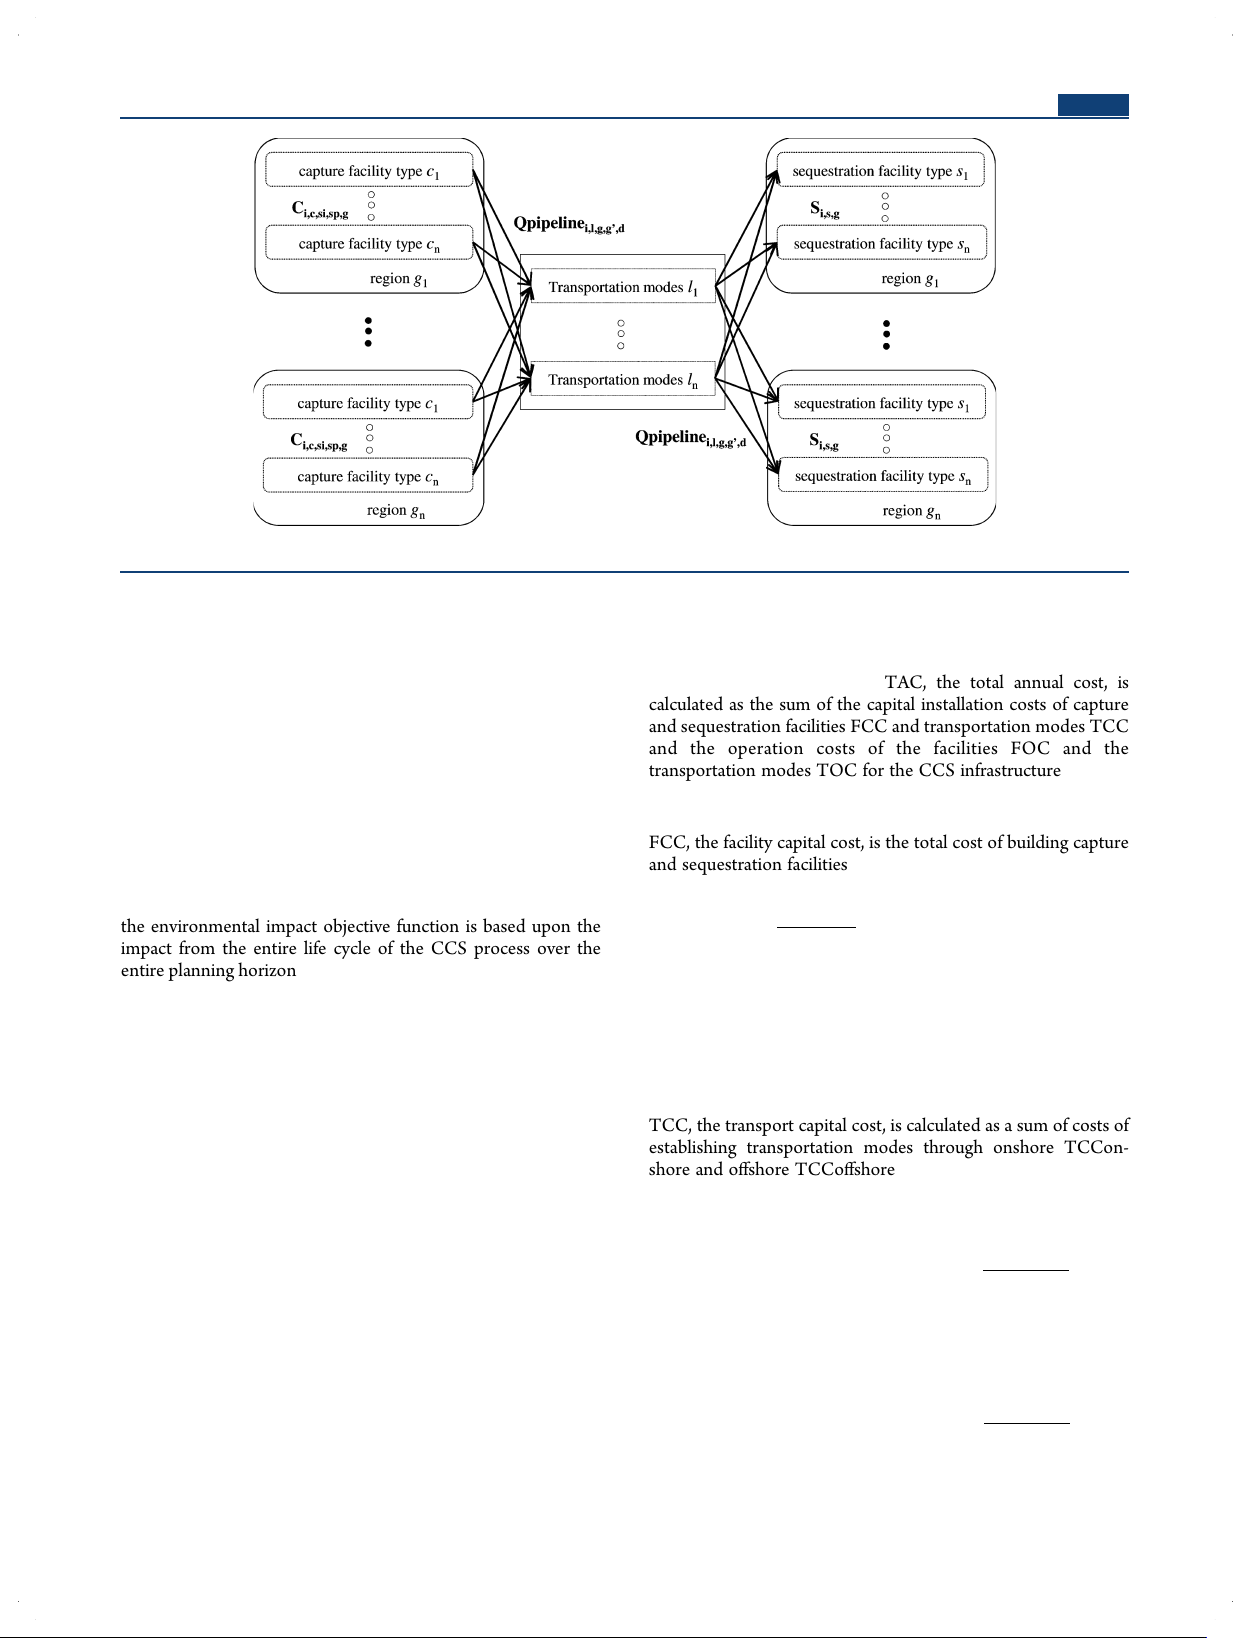
This infrastructure network model includes three main
factors in establishing investment strategies with planning a new
components: capture facilities, sequestration facilities, and
process design. Hugo and Pistikopoulos proposed an environ-
transport modes (see Figure 1.). The planning network includes
mentally conscious planning model of supply chain networks
a set of c facility types which capture CO2, and a set of s
with multiobjective programming.10 Guillén-Gosálbez and
sequestration facilities where CO2 is sequestrated finally being
Grossmann suggested a bicriterion optimization for planning
delivered by a set of l transportation means to other sequestration
of hydrogen supply chains with environmental and economic
facilities in other regions. All capture and sequestration types can
concerns.11 Cristóbal, J. performed a similar approach to
be included in this superstructure. On the other hand, the only
compare carbon capture technologies considering economic
transport mode is the pipeline because it is more economical than
and environmental criteria with multiobjective program- ming.12,13 Received: April 12, 2012
In this work, the environmental effect of a whole CCS system Revised: September 5, 2012
is assessed by the following principles of Life Cycle Assessment Accepted: October 10, 2012
(LCA) employed from Hugo and Guillén-Gosálbez’s works.10,11 Published: October 10, 2012
© 2012 American Chemical Society 14145
dx.doi.org/10.1021/ie3009583 | Ind. Eng. Chem. Res. 2012, 51, 14145−14157
Industrial & Engineering Chemistry Research Article
Figure 1. CCS infrastructure planning superstructure.
other means.1 Specifically, this network planning superstructure
3.1. Total Annual Cost. The detailed explanations for the
is based on the work by Han and Lee,4 which proposed the
first objective and its constraints were described by Han and
design of a CCS infrastructure for Korea.
Lee,4 but those which are relevant to this part of the paper are
The CCS technologies concerned in the superstructure can be summarized below.
established in a set g of potential regions which are distributed all
3.1.1. Objective function. TAC, the total annual cost, is
over the nation of interest. Among these regions, the regions
calculated as the sum of the capital installation costs of capture
which have CO2 emission sources can have the CO2 capture
and sequestration facilities FCC and transportation modes TCC
facilities only. Similarly the CO2 sequestration facilities can be
and the operation costs of the facilities FOC and the
established in regions which can sequestrate CO2 geologically.
transportation modes TOC for the CCS infrastructure.
The decision-maker must provide the technological capability of TAC = FCC + TCC + FOC +
the CCS of each region. The environmentally concerned CCS TOC (1)
infrastructure planning can be stated as follows: (1) The goal is to
FCC, the facility capital cost, is the total cost of building capture
design an optimal CCS infrastructure configuration that and sequestration facilities.
minimizes the cost and environmental impact. The cost objective
function includes the investment and operating costs. In contrast, ⎡ CCRfacility
the environmental impact objective function is based upon the FCC = ∑ ⎢⎢
impact from the entire life cycle of the CCS process over the g ⎣ LR
entire planning horizon. The principles of the LCA approach are
used in this model. (2) Given conditions are a fixed time horizon, ∑ (∑ ∑ ∑ CCC BC
i,c,si,sp ,g
i,c,si,sp ,g total mandated reduction of CO i c si sp 2 over all the time period,
investment costs, operating costs, the capacity limitation of each ⎤
CCS technology, and its environmental data. (3) The major + ∑ ⎥ SCC NS ) i,s i,s,g
decisions are the number, location, type, and capacity of capture s ⎦⎥ (2)
and sequestration facilities; the total amount of CO2 captured,
transported and sequestrated in each region and the size and type
TCC, the transport capital cost, is calculated as a sum of costs of of transportation means.
establishing transportation modes through onshore TCCon-
The mathematical formulation proposed to solve this problem
shore and offshore TCCoffshore.
is described in the next section. TCC = TCConshore + TCCoffshore (3) 3. MODEL FORMULATION ⎛ CCRpipeline
The mathematical formulation of the CCS infrastructure model
TCConshore = ∑ ∑ ∑ ∑ ∑ ⎜⎝ LR
will be presented as two objective functions and several i l∈{pipe} g g′ d
constraints. The addressed model is based on the work in ref 4 ⎞
in which the authors proposed a “deterministic” formulation for (TPICon Lon NTPon ) d l,g ,g
i,l,g ,g ,d ⎟ ′ ′
CCS infrastructure planning focused on economic concerns. ⎠ (4)
Specifically, the mathematical formulation of this study extends
the original one in order to include the environmental concerns. ⎛ CCRpipeline
This consideration led to a multiobjective optimization approach
TCCoffshore = ∑ ∑ ∑ ∑ ∑ ⎜⎝ LR
to the problem and made a solution set of Pareto optimal points i l∈{pipe} g g′ d
that show trade-offs between cost and environmental impact. ⎞
The detailed model will be described below. The notation of the (TPICoff Loff NTPoff d l,g ,g
i,l,g ,g ,d ⎟ ′ ′ )⎠
model is summarized in Table 1. (5) 14146
dx.doi.org/10.1021/ie3009583 | Ind. Eng. Chem. Res. 2012, 51, 14145−14157
Industrial & Engineering Chemistry Research Article
Table 1. Model Notation of CCS Infrastructure indices parameters b ω Tr 1
environment burdens from operation ib
entry of emission inventory from installation kg·km−1 2 l d b
b2 per unit of distance from installing 2
environment burdens from installation pipelines with diameter d c type of capture facility ωiSq
entry of emission inventory from installation kg d b pipeline diameter 2 s
b2 from installing one sequestration facility g geographical region of type s g′
geographical region (g′ ≠ g) υn x b
damage factor of environment burden b kg 2 2 in i
terms of damage category n and impact physical form of CO2 category x k technology set ηn
normalization factor for damage categories l type of transport mode belonging to set n n damage category ϑr n
weighting factor for each normalized damage p
type of utilization facility or production facility
category n according to perspective categories r s type of sequestration facility binary variables si type of source industry sp source plant name BCi c si sp g
investment of capture facility type c capturing CO2 in
physical form i in source plant sp of industry type si in x impact category region g parameters Xi l g g′
1 if CO2 in physical form i is to be transported from region CCC
g to g′ by transport mode l, 0 otherwise i c si sp g
capital cost of building CO2-capture facility $
type c capturing in source plant sp of integer variables industry type si in region g NS CCR i s g
number of well or injection facilities of type s pipeline
capital charge rate of pipelinesthe rate or 0 ≤ sequestering CO
return required on invested capital cost CCR 2 in region g pipeline ≤ 1 NTPoni l g g′ d
number of pipelines with diameter d for transporting CO CCR
2 in physical form i between regions g and g′ facility
capital charge rate of facilitiesthe rate or 0 ≤ onshore
return required on invested capital cost CCRfacility ≤ 1 NTPoffi l g g′ d
number of pipelines with diameter d for transporting CO Loff
2 in physical form i between regions g and g′ l g g′
average delivery distance between regions km·trip−1 offshore
g and g′ by transport mode l offshore continuous variables Lonl g g′
average delivery distance between regions km·trip−1
g and g′ by transport mode l onshore C · i c si sp g
amount of CO2 in physical form i t CO2 y−1 LR
learning rate−cost reduction as technology 0 ≤ LR ≤ 1
captured by capture facility type c in
manufacturers accumulate experience
source plant sp of industry type si in region g MCCi m g
capital cost of establishing intermediate $
storage facility type m storing CO FCC facility capital cost $·y−1 2 in physical form i in region g FOC facility operating cost $·y−1 SCC M t CO ·y−1 i s g
capital cost of establishing CO2 sequestration $ i m g
inventory of CO2 in physical form i 2
facility type s sequestrating CO
stored by intermediate storage facility 2 in physical form i in region g type m in region g TPICoff Qpipeline t CO ·y−1 d
total capital cost of installing pipeline with $·km−1 i l g g′ d
flow rate of CO2 in physical form i 2 pipe diameter d offshore transported by pipelines with TPICon
diameter d between regions g and g′ d
total capital cost of installing pipeline with $·km−1 diameter d onshore S · i s g
Amount of CO2 in physical form i t CO2 y−1 TPOCoff
sequestered by sequestration facility d
total operating cost of pipeline with pipe $·km−1·t diameter d offshore CO −1 type s in region g 2 TPOCon TAC total annual cost $·y−1 d
total operating cost of pipeline with pipe $ km−1·t diameter d onshore CO −1 TCC transport capital cost $·y−1 2 UCC −1 TCCoffshore transport capital cost for CO i c si
unit capture cost for CO2 captured in physical $·t CO2 2 offshore $·y−1
form i by capture facility type c in source TCConshore transport capital cost for CO industry si 2 onshore $·y−1 TOC transport operating cost $·y−1 UMC −1 i m
unit storage cost for CO2 in physical form i $·t CO2
stored by intermediate storage facility type m TOCoffshore
total transportation operating cost of $·y−1 pipeline offshore USC −1 i s
unit sequestration cost for CO2 sequestered in $·t CO2
physical form i by sequestration facility TOConshore
total transportation operating cost of $·y−1 type s pipeline onshore ω k oCa −1 IOn x g
environment impact of operation of Impact·y−1 b
entry of emission inventory from operation b kg·tCO 1 c 1 2
associated with the capture per one unit of
technology set k in terms of damage CO
category n and impact category x in 2 by capture facility type c ω region g oTr b
entry of emission inventory from operation b kg·km−1 1 l d 1 k per one unit of CO · −1 IInx g
environment impact of installation of Impact·y−1 2 mass transported one tCO2
unit of distance by pipelines with diameter d
technology set k in terms of damage ω
category n and impact category x in oSq −1 b
entry of emission inventory from operation b kg·tCO 1 s 1 2 region g
associated with the sequestration of one unit of CO Dg n
environment damage score of the damage Damage·y−1
2 by sequestration facility type s υ category n in region g n x b
damage factor of environment burden b 1 1 in
terms of damage category n and impact Eco99 total environment impact score Score·y−1 category x ωiCa b
entry of emission inventory from installation kg 2 c
b2 from installing one capture facility of type c 14147
dx.doi.org/10.1021/ie3009583 | Ind. Eng. Chem. Res. 2012, 51, 14145−14157
Industrial & Engineering Chemistry Research Article
The facility operating cost FOC is determined by multiplying the
The sequestration rate Si,s,g is bounded by the minimum
unit operating costs of capture and sequestration by the
sequestration capacity Scapmini,s and the and maximum corresponding amounts of CO2:
sequestration capacity Scapmaxi,s: min max FOC = ∑ ∑ ∑ ( ∑ ∑ UCC C Scap NS ≤ S ≤ Scap NS
∀ i, s, g
i,c,si i,c,si,sp ,g i s i,s,g i,s,g i,s i,s,g , (15) g i c si sp
A minimum flow rate Qmini,l and a maximum flow rate of CO2 + ∑ USC S )
i,s i,s,g
Qmaxi,l are needed to justify the establishment of a transportation s (6) mode between two regions:
Like in eq 3, the transport operating cost TOC is classified into Q X min ≤ Q ≤ Q maxX
∀ i, l, g , g′; g ≠ g′ , , , ′ i,l i l g g
i,l,g ,g′ , , , ′ i,l i l g g
operating cost of transport modes onshore TOConshore and (16) offshore TOCoffshore.
The transportation of CO2 in physical form i must occur only TOC = TOConshore + TOCoffshore (7)
from a source to a sequestration facility or utilization facility:
TOConshore = ∑ ∑ ∑ ∑ ∑ TPOCon
u − u + nX ≤ n − 1 d g′ g
i,l,g ,g′ i l∈{pipe} g g′ d
∀ i, l, g , g′; g = 2, ···, n, g′ = 2, ···, n; g ≠ g′ (17)
Qpipelinei,l,g,g′,d (8)
All transport modes with all physical forms of CO2 leaving or
entering region g are bounded by the constraints:
TOCoffshore = ∑ ∑ ∑ ∑ ∑ TPOCoffd i l∈{pipe} g g′ d ∑ ∑ X ≤ 1
∀ g , g′; g ≠ g′
i,l,g ,g′ i l (18)
Qpipelinei,l,g,g′,d (9) ∑ ∑ X ≤ 1
∀ g , g′; g ≠ g′
3.1.2. Mass Balance Constraints. The target amount T of
i,l,g′,g i l (19)
CO2 to be reduced by CCS facilities is the product of the mandated reduction of CO
3.2. Total Environmental Impact. The environmental
2 emissions LMRi, the utilization UCCS
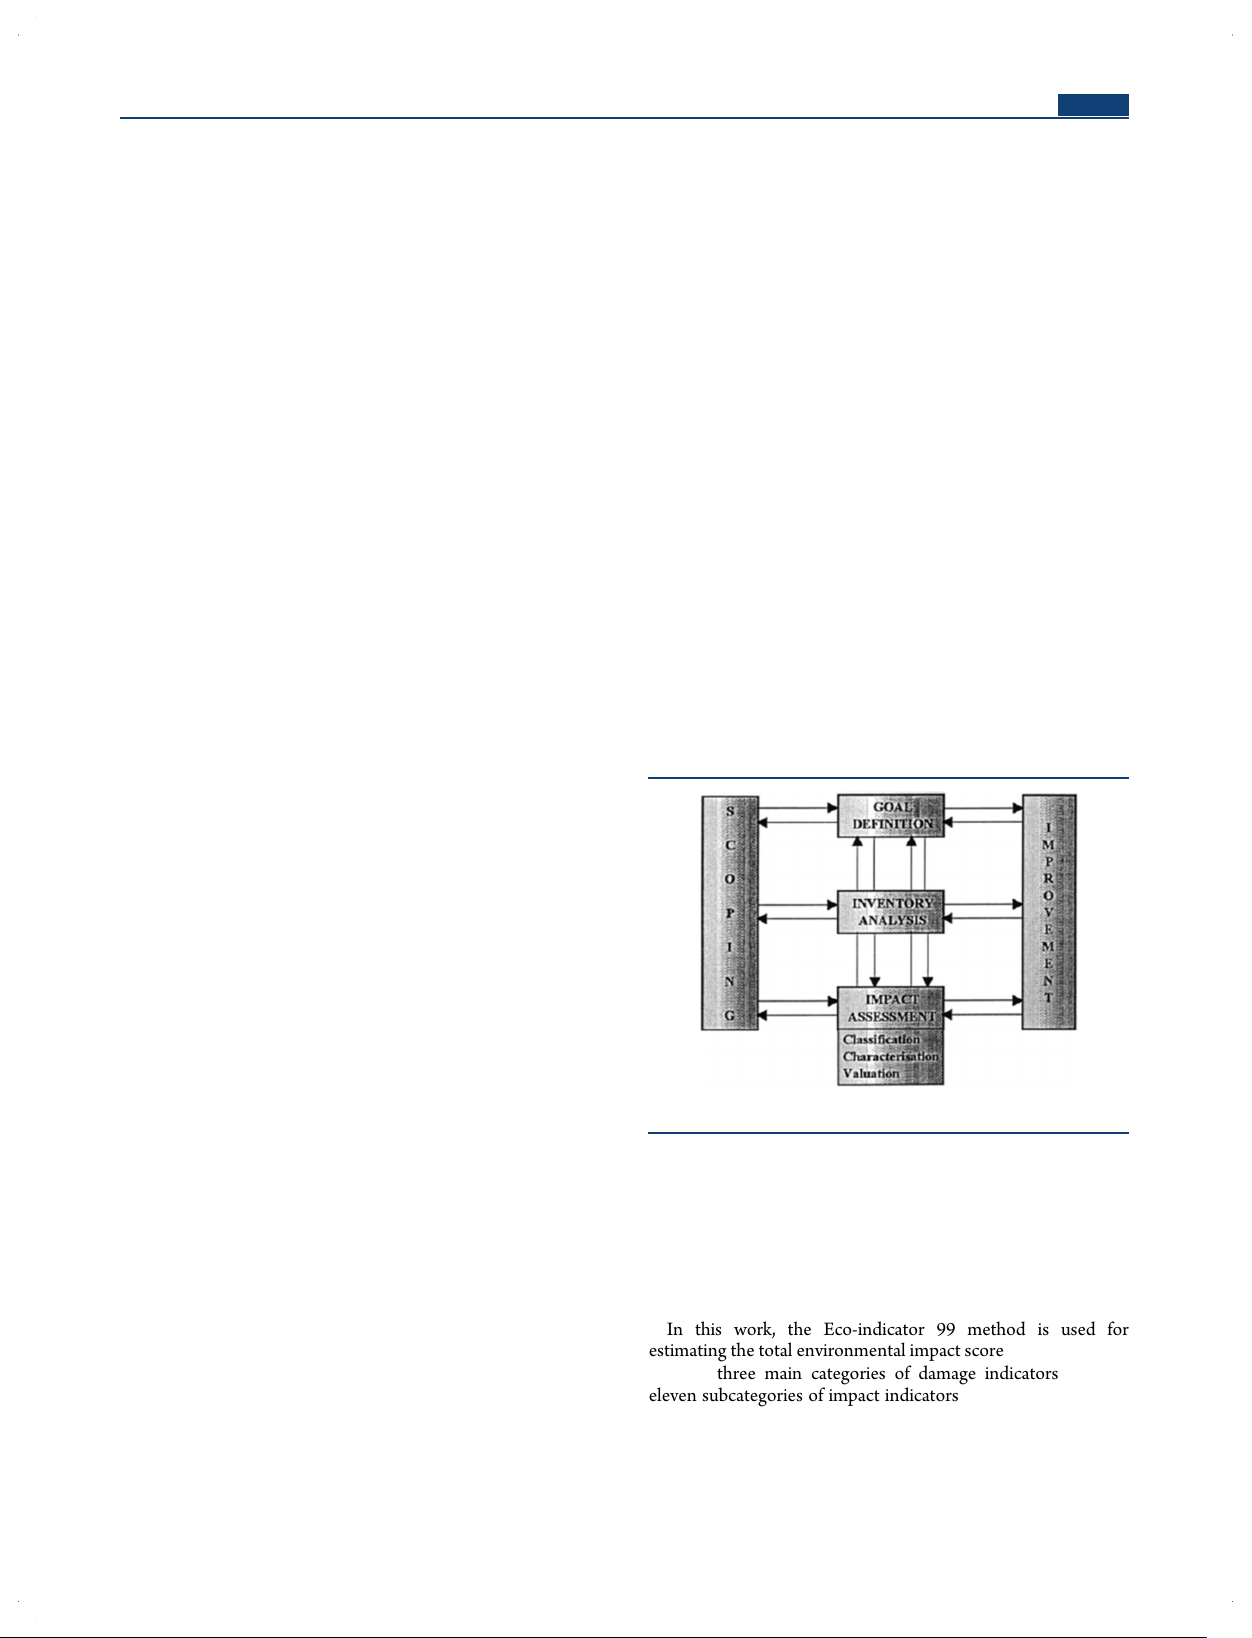
impact of a whole CCS system is estimated by principles of LCA
i of CCS as CO2 reduction technology, and the total amount E
(Figure 2). LCA consists of three steps as follows: Goal and
i,si,sp,g of CO2 emissions from all sources:
T = ∑ ∑ ∑ ∑ LMR UCCS E i i i,si,sp ,g i si sp g (10)
Mass balance of individual regions should consider rates of total
annual capture Ci,c,si,sp,g, transport Qi,l,g,g′, and sequestration Si,s,g: ∑ ∑ ∑ C = ∑ ∑ (Q − Q )
i,c,si,sp ,g
i,l,g ,g′
i,l,g′,g c si sp l g′ + ∑ S ∀ i, g i,s,g s (11)
Moreover, the total inventory Mi,m,g of CO2 in physical form i of
all storage facilities in region g is a function of the total flow rate
Qi,l,g,g′ of CO2 in physical form i leaving region g multiplied by a safety stock factor SSF:
Figure 2. Life cycle assessment procedure. ∑ M = SSF( i,m,g ∑ ∑ Q ) ∀ i, g
i,l,g ,g′ m
l∈{truck,railcar,ship} g′ (12)
Scope Definition, Inventory Analysis, and Impact Assessment. In
the goal and scope definition step, system boundary and
3.1.3. Capacity Constraints. The total amount of CO2
functional unit are determined. Next, in inventory analysis
sequestered Si,s,g in all regions cannot be less than T:
step, materials and energy uses of the system are investigated. In ∑ ∑ ∑
impact assessment step, the environmental impact is aggregated S ≥ T i,s,g
into one single score or calculated in several impact scores i g s (13) according to their categories.
All facilities and transportation modes must be constrained by
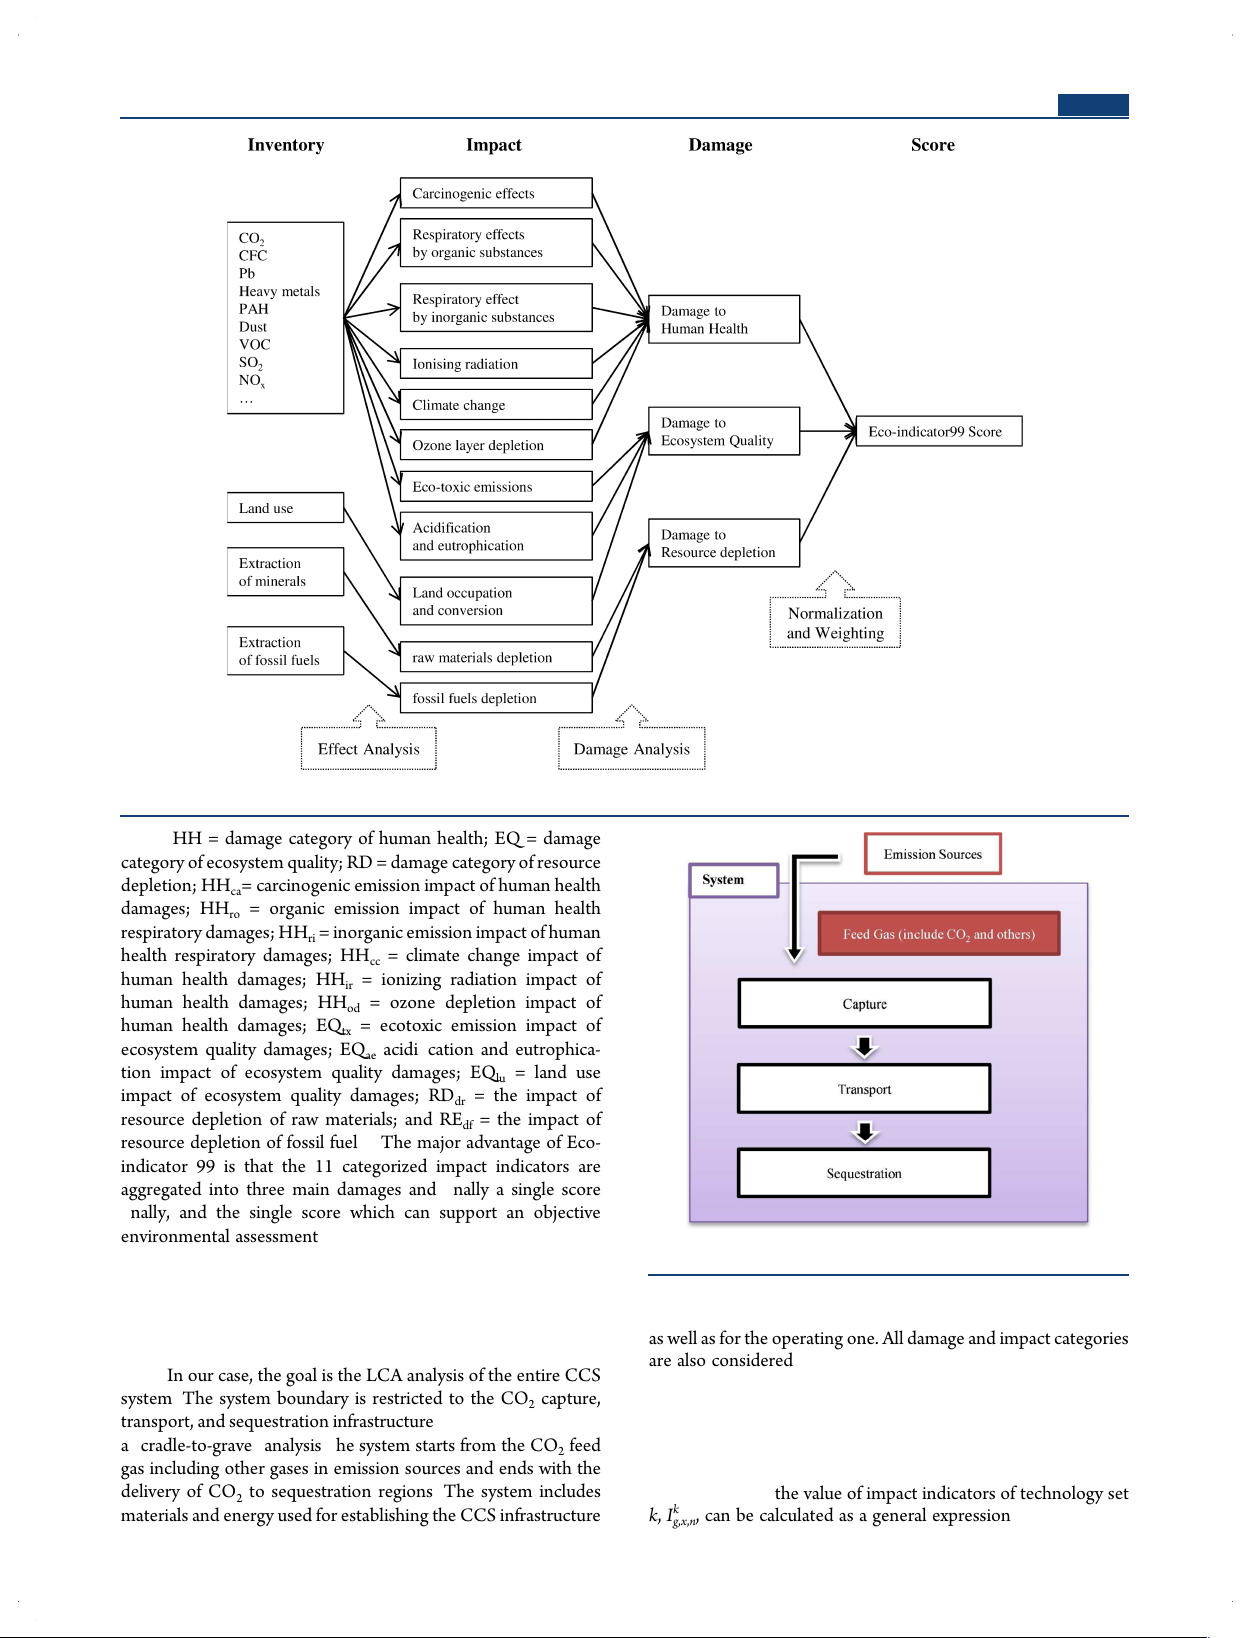
In this work, the Eco-indicator 99 method is used for
upper and lower boundaries. Therefore, the capture rate C
estimating the total environmental impact score. It is categorized i,c,si,sp,g
is bounded by the minimum capture capacity Ccapmin
into (i) three main categories of damage indicators and (ii) i,c,si,sp,g and
the maximum capture capacity Ccapmax
eleven subcategories of impact indicators: i,c,si,sp,g of all facilities
established in a particular region: n ∈ 5: = {HH, EQ, RD] Ccapmin BC ≤ C
i,c,si,sp ,g
i,c,si,sp ,g
i,c,si,sp ,g x ∈ ? =
: {HH , HH , HH , HH , HH , HH , ca ro ri cc ir od ≤ Ccapmax BC
∀ i, c, si, sp , g
i,c,si,sp ,g
i,c,si,sp ,g (14) EQ , EQ , EQ , RD , RE ] tx ae lu dr df 14148
dx.doi.org/10.1021/ie3009583 | Ind. Eng. Chem. Res. 2012, 51, 14145−14157
Industrial & Engineering Chemistry Research Article
Figure 3. Eco-indicator 99 procedure.
where HH = damage category of human health; EQ = damage
category of ecosystem quality; RD = damage category of resource
depletion; HHca= carcinogenic emission impact of human health
damages; HHro = organic emission impact of human health
respiratory damages; HHri = inorganic emission impact of human
health respiratory damages; HHcc = climate change impact of
human health damages; HHir = ionizing radiation impact of
human health damages; HHod = ozone depletion impact of
human health damages; EQtx = ecotoxic emission impact of
ecosystem quality damages; EQae acidification and eutrophica-
tion impact of ecosystem quality damages; EQlu = land use
impact of ecosystem quality damages; RDdr = the impact of
resource depletion of raw materials; and REdf = the impact of
resource depletion of fossil fuel.14 The major advantage of Eco-
indicator 99 is that the 11 categorized impact indicators are
aggregated into three main damages and finally a single score
finally, and the single score which can support an objective
environmental assessment (Figure 3).
For the computation of the single Eco-indicator 99 score, the
Figure 4. System boundary for LCA of CCS infrastructure.
three steps of LCA procedure are followed as mentioned above.
These steps are described in detail in the next subsections.
Goal and Scope Definition. The goal and system boundaries
as well as for the operating one. All damage and impact categories
of LCA are identified and the impact categories are chosen in this are also considered.
stage. In our case, the goal is the LCA analysis of the entire CCS
Inventory Analysis. The inventory analysis step uses the list of
system. The system boundary is restricted to the CO2 capture,
Life Cycle Inventory (LCI) such as the inputs and outputs of
transport, and sequestration infrastructure (Figure 4). Applied to
materials and energy to calculate the environmental impact.
a “cradle-to-grave” analysis, the system starts from the CO2 feed
If one considers the set of k ∈ 2 technologies such as capture
gas including other gases in emission sources and ends with the
and sequestration, each of which relates to a region g through
delivery of CO2 to sequestration regions. The system includes their CO fl 2
ows, the value of impact indicators of technology set
materials and energy used for establishing the CCS infrastructure
k, Ikg,x,n, can be calculated as a general expression.15 14149
dx.doi.org/10.1021/ie3009583 | Ind. Eng. Chem. Res. 2012, 51, 14145−14157
Industrial & Engineering Chemistry Research Article
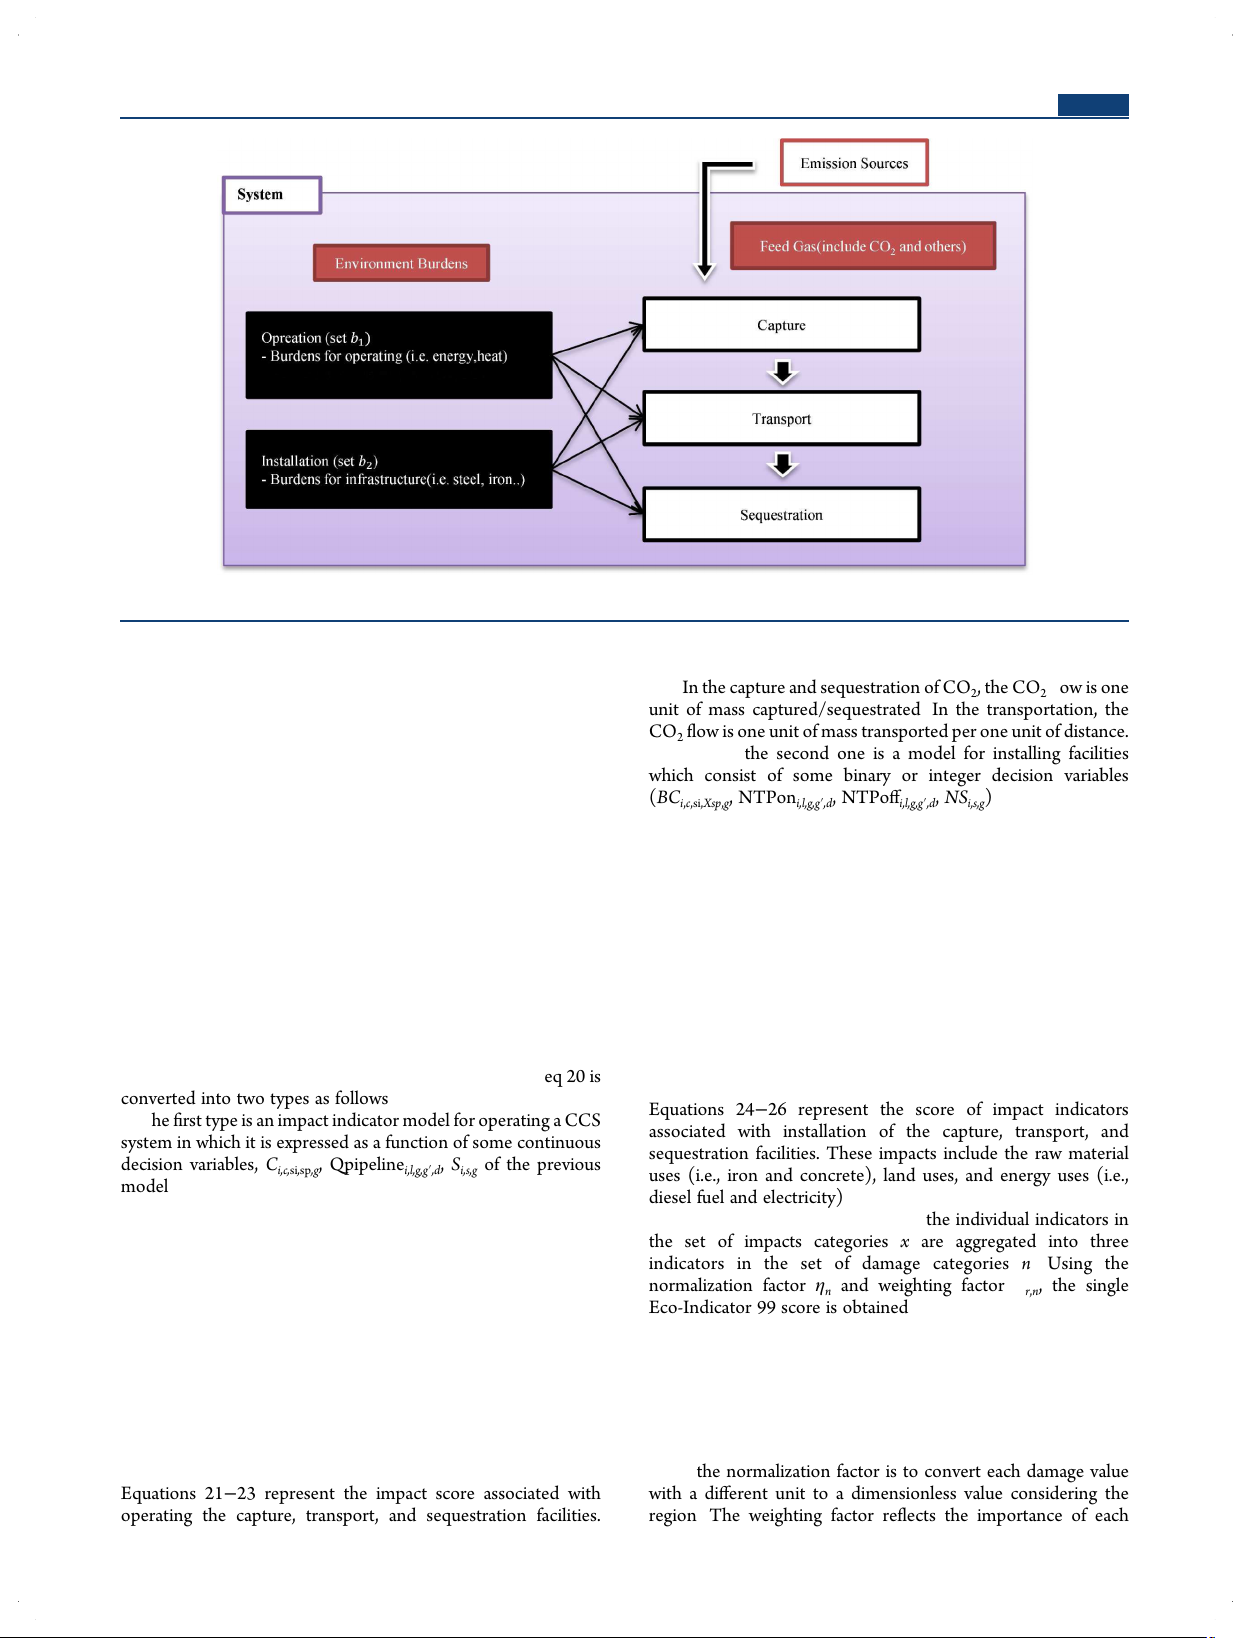
Figure 5. System boundary and inventory for LCA of CCS infrastructure. Ik = k k
These impacts include the energy usage (i.e., steam and g ,x,n ∑ v ω M
∀ n, x, k, g b,n,x b g
electricity) and direct emission of pollutants to air, water, and b (20)
soil. In the capture and sequestration of CO fl 2, the CO2 ow is one
where (i) b ∈ B is the set of the life cycle inventory; (ii) vb,n,x is the
unit of mass captured/sequestrated. In the transportation, the
damage factor that life cycle inventory b contributes to impact CO fl 2
ow is one unit of mass transported per one unit of distance.
category x of damage category n; (iii) ωkb is the entry of emissions
Similarly, the second one is a model for installing facilities
inventory b per 1 unit of CO fl 2
ow of CCS technology k; and (iv)
which consist of some binary or integer decision variables Mk fl g is the amount of CO2
ow required for technology k by region
(BCi,c,si,Xsp,g, NTPoni,l,g,g′,d, NTPoffi,l,g,g′,d, NSi,s,g).
g (such as ton of CO2 captured, load and distance of substances transported). The Ik Ca Ca
g,x,n values of Human Health damage indicator II
= ∑ ∑ ∑ ∑ ∑ ωi υ BC nx,g
b ,c n,x,b
i,c,si,sp ,g
are expressed as Disability Adjusted Life Years (DALY). On the 2 2 i c si sp b2
other hand, the Ecosystem Quality damage indicator is the
Potentially Disappeared Fraction per square meter per year
∀ n, x, g (24)
(PDF·m−2 y−1) and MJ is used for Resources Depletion damage k Tr
indicator to represent the surplus energy needed for future II = ∑ ∑ ∑ ωi υ ∑ ∑ (NTPon n,x,g
b ,l,d n,x,b
i,l,g ,g′,d 2 2 resource extraction. i l b g′ d 2
In the context of the CCS infrastructure system boundary, the Lon + NTPoff Loff ) ∀ , ,
generation of emission inventories depends on the amount of l,g ,g′
i,l,g ,g′,d l,g ,g′ n x g (25)
captured, transported, and sequestrated CO2. Moreover, the Sq Sq
emission inventories are concerned with installing a facility of II = n,x,g
∑ ∑ ∑ ωi υ NS
∀ n, x, g
b ,s n,x,b i,s,g 2 2
certain technology in a possible region (Figure 5). Thus, eq 20 is i s b (26) 2
converted into two types as follows.
Equations 24−26 represent the score of impact indicators
The first type is an impact indicator model for operating a CCS
associated with installation of the capture, transport, and
system in which it is expressed as a function of some continuous
sequestration facilities. These impacts include the raw material
decision variables, Ci,c,si,sp,g, Qpipelinei,l,g,g′,d, Si,s,g of the previous
uses (i.e., iron and concrete), land uses, and energy uses (i.e., model. diesel fuel and electricity). IOCa
= ∑ ∑ ∑ ∑ ∑ ωoCa υ C
Impact Assessment. In this step, the individual indicators in n,x,g
b ,c n,x,b
i,c,si,sp ,g 1 1
the set of impacts categories x are aggregated into three i c si sp b1
indicators in the set of damage categories n. Using the
∀ n, x, g (21)
normalization factor ηn and weighting factor ϑr,n, the single
Eco-Indicator 99 score is obtained. IOTr
= ∑ ∑ ∑ ωoTr υ ∑ (Qpipeline n,x,g
b ,l,d n,x,b
i,l,g ,g′,d 1 1 k k i l b g D = η ′ g ,n ∑ ∑ ∑ IO + II , ∀ n, g 1 n n,x,g n,x,g x v k (27) Lon + Qpipeline Loff ) ∀ l,g ,g′
i,l,g ,g′,d l,g ,g′ n, x, g (22)
Eco99 = ∑ ∑ ∑ ϑ D r ,n g ,n IOSq = Sq n,x,g
∑ ∑ ∑ ωo υ S
∀ n, x, g
b ,s n,x,b i,s,g g r n (28) 1 1 i s b (23) 1
Here, the normalization factor is to convert each damage value
Equations 21−23 represent the impact score associated with
with a different unit to a dimensionless value considering the
operating the capture, transport, and sequestration facilities.
region. The weighting factor reflects the importance of each 14150
dx.doi.org/10.1021/ie3009583 | Ind. Eng. Chem. Res. 2012, 51, 14145−14157
Industrial & Engineering Chemistry Research Article
damage value. Both factors are determined from three different 4. CASE STUDY
perspectives based upon the principles of Cultural Theory. For
The case study proposed by Han and Lee4 is used to illustrate the
instance, the Hierarchist perspective weights the human health
applicability of our multiobjective modeling framework.
and ecosystem quality each 40% and the resource depletion
Although the detailed design problem and input data are 20%.14
described in the original work, some minor details and changes
Therefore, the optimal solutions for economic and environ-
must be discussed in the commented next paragraph.
ment concerns will be provided by two objective functions, TAC
The case considers CO2 mitigation in Korea in 2020. The
and Eco99. The detailed multiobjective optimization method will
Korean government announced a plan to reduce CO2 emissions
be described in the next section.
by 30% from the current levels. Moreover, we consider gas-fired
3.3. Multiobjective Optimization Method. The overall
and coal-fired power plants (Table 2) in Korea as major CO2
multiobjective formulation can be expressed as follows: ⎧ TA y C( , Y , Z) total annul cost ⎫
Table 2. Estimated CO2 emissions of each plant in 2020 ⎪ = ⎪ min⎨ ⎬ ⎪ emission source emission plant CO y,Y ,Z y
Eco99( , Y , Z) = E ‐ ⎪ ⎩ co Indicator 99⎭ 2 emissionsa region type name (tCO · 2 y−1) Busan gas KOSPO1 8 597 058 s.t. Chungnam gas KOMIPO8 6 207 077
capture facility capacity constraints coal KOWEPO4 33 570 239 h y
( , Y , Z) = 0⎫ coal KOMIPO5 2 520 465 ⎪
⎬overall mass balance constraints coal KEWESPO5 30 558 157 g y
( , Y , Z) ≥ ⎪ 0⎭transportation constraints coal KOMIPO6 28 999 240 sequestration constraints coal KOMIPO7 840 155 Gangwon gas KOSPO4 3 742 870
y ∈ , Y ∈ {0, 1}, Z ∈ coal KEWESPO4 2 645 610 coal KOSEP5 1 199 135
where y represents the continuous variables of the problem (the Gyeonggi gas KOWEPO3 667 705
amount of CO2 captured, transported, and sequestrated), Y gas KOSEP3 2 746 008
denotes the binary variables (the installation of CO2 capture gas KEWESPO3 2 584 264
facilities), and Z is the integer variables representing the number gas KOSEP4 1 512
of installation of sequestration facilities and transportation Gyeongnam coal KOSPO5 27 083 384
modes of each type selected. The multiobjective mixed integer coal KOSPO6 9 027 795
linear programming (moMINP) problem can be solved with a coal KOSEP7 28 022 995
set of Pareto optimal solutions to show trade-offs between the Incheon gas KOWEPO1 7 975 978
environmental and economic concerns in the analysis. The gas KOSEP1 13 132 559
Pareto optimal solutions represent different CCS infrastructure coal KOSPO2 9 418 250
configurations with capacity expansion plans and combinations coal KOSEP2 13 132 559
of economic performance and environment damage. This type of gas KOMIPO2 333 019
problem is treated with two typical methods: the weighted-sum gas KOMIPO3 2 635 129
method and ε-constraint method.16 The ε-constraint method is gas KOMIPO4 2 663 707
proper for our case, which is rigorous for the nonconvex case. Jeonbuk gas KOWEPO5 3 633 927
Therefore, the moMILP is expressed via the ε-constraint Jeonnam coal KEWESPO6 4 224 707
method, and the solutions are obtained for different values of the seoul gas KOMIPO1 750 254 parameter ε.17 Ulsan gas KEWESPO2 3 221 690 Busan gas KOSPO1 8 597 058
min TAC(y, Y , Z) aHan and Lee3 y,Y ,Z s.t.
capture facility capacity constraints
emission sources because their CO2 emissions will be a h y
( , Y , Z) = 0⎫ ⎪
⎬overall mass balance constraints
considerable portion of the total CO2 emissions at time.18 g y
( , Y , Z) ≥ ⎪ 0⎭transportation constraints
Several capture, transport, and sequestration technologies were
selected to test the proposed model (Table 3). sequestration constraints
Table 3. Types of Emission Sources, Capture, Transport and
Eco99(x, X , N) ≤ ε
Sequestration Technologies of the Case Study
ε̲ ≤ ε ≤ ε̅ classification type emission source gas-fired power plant
y ∈ , Y ∈ {0, 1}, Z ∈ coal-fired power plant
The major advantage of this approach is that the decision- capture
the absorption using aqueous monoethanolamine (MEA)
maker can investigate trade-offs and select a particular CCS transport liquid CO2 via pipeline
infrastructure plan that satisfies his/her purpose from the set of sequestration depleted gas reservoir (DGR) Pareto solutions. saline aquifer storage (SAS) 14151
dx.doi.org/10.1021/ie3009583 | Ind. Eng. Chem. Res. 2012, 51, 14145−14157
Industrial & Engineering Chemistry Research Article
Table 4. Environment Impact Data of CCS Operation technology type damage impact value unit capture coal−MEA human health respiratorya 3.582 × 10⁻⁵ DALYs·tCO −1 2 ecosystem quality acidificationa 4.241 PDF·m2·yr·tCO −1 2 resource depletion fossil fuelsa 34.36 MJ·tCO −1 2 gas−MEA human health respiratoryb 4.349 × 10⁻⁵ DALYs·tCO −1 2 ecosystem quality acidificationb 2.801 PDF·m2·yr·tCO −1 2 resource depletion fossil fuelsc 216.0 MJ·tCO −1 2 transport pipe (16 in) resource depletion fossil fuelsa 0.02929 MJ·tCO −1 2 pipe (21.6 in) resource depletion fossil fuelsa 0.03954 MJ·tCO −1 2 sequestration DGR resource depletion fossil fuelsd 0.8844 MJ·tCO −1 2 SAS resource depletion fossil fuelsd 0.2066 MJ·tCO −1 2
aEstimated based on Koornneef and Keulen et al.9 bEstimated based on Odeh and Cockerill.19 cEstimated based on IPCC.1 dEstimated based on Wildbolz.8
Table 5. Environment Impact Data of Capture Facility Installation emission source power plant region damage impact valuea unit gas−MEA KEWESPO2 Ulsan Resources depletion Minerals 9553.8697 MJ per a capture facility gas−MEA KEWESPO3 Gyeonggi Resources depletion Minerals 7663.5932 MJ per a capture facility coal−MEA KEWESPO4 Gangwon Resources depletion Minerals 7845.5139 MJ per a capture facility coal−MEA KEWESPO5 Chungnam Resources depletion Minerals 90619.7217 MJ per a capture facility coal−MEA KEWESPO6 Jeonnam resources depletion minerals 12528.3005 MJ per a capture facility gas−MEA KOMIPO1 seoul resources depletion minerals 2224.8661 MJ per a capture facility gas−MEA KOMIPO2 Incheon resources depletion minerals 987.5625 MJ per a capture facility gas−MEA KOMIPO3 Incheon resources depletion minerals 7814.4325 MJ per a capture facility gas−MEA KOMIPO4 Incheon resources depletion minerals 7899.18015 MJ per a capture facility coal−MEA KOMIPO5 Chungnam resources depletion minerals 7474.3983 MJ per a capture facility coal−MEA KOMIPO6 Chungnam resources depletion minerals 85996.7785 MJ per a capture facility coal−MEA KOMIPO7 Chungnam resources depletion minerals 2491.4661 MJ per a capture facility gas−MEA KOMIPO8 Chungnam resources depletion minerals 18406.9867 MJ per a capture facility coal−MEA KOSEP1 Incheon resources depletion minerals 38944.3919 MJ per a capture facility coal−MEA KOSEP2 Incheon resources depletion minerals 38944.3919 MJ per a capture facility gas−MEA KOSEP3 Gyeonggi resources depletion minerals 8143.2424 MJ per a capture facility gas−MEA KOSEP4 Gyeonggi resources depletion minerals 4.4838 MJ per a capture facility coal−MEA KOSEP5 Gangwon resources depletion minerals 3556.0155 MJ per a capture facility coal−MEA KOSEP7 Gyeongnam resources depletion minerals 83101.7397 MJ per a capture facility gas−MEA KOSPO1 Busan resources depletion minerals 25494.4368 MJ per a capture facility gas−MEA KOSPO2 Incheon resources depletion minerals 27929.6685 MJ per a capture facility gas−MEA KOSPO4 Gangwon resources depletion minerals 11099.4206 MJ per a capture facility coal−MEA KOSPO5 Gyeongnam resources depletion minerals 80315.3384 MJ per a capture facility coal−MEA KOSPO6 Gyeongnam resources depletion minerals 26771.7805 MJ per a capture facility gas−MEA KOWEPO1 Incheon resources depletion minerals 23652.6341 MJ per a capture facility gas−MEA KOWEPO3 Gyeonggi resources depletion minerals 1980.0684 MJ per a capture facility coal−MEA KOWEPO4 Chungnam resources depletion minerals 99552.0023 MJ per a capture facility gas−MEA KOWEPO5 Jeonbuk resources depletion minerals 10776.3519 MJ per a capture facility
aEstimated based on Koornneef and Keulen et al.9
On the other hand, we estimated the data of the environment
Table 6. Environment Impact Data of Transport Facility
inventories associated with the installation and operation of the Installation
CCS infrastructure from several sources in the literature which diameter
performed LCA of CCS systems.1,7−9,19 Moreover, the impact type (in) damage impact valuea unit
factor of each environmental burden was found in the Eco- liquid CO2 16 ecosystem land use 68941.3 PDF·m2·
indicator 99 method,14 assuming the weighting and normalizing via quality yr·km−1
set of the Hierarchist perspective. The input data for the case pipeline resource minerals 2977.5 MJ·km−1 depletion
study of the LCA analysis are summarized as the following four 21.6 ecosystem land use 93070.8 PDF·m2·
assumptions (Tables 4−7): (i) A capture facility of a certain quality yr·km−1
power plant in a certain region utilizes heat energy supplied from resource minerals 4019.7 MJ·km−1
that power system only. (ii) The operation of transportation and depletion
sequestration considers only the electric energy consumption. aEstimated based on Wildbolz.8
(iii) For a certain capture facility, the amount of installation
material changes linearly with its capacity. (iv) Installation of 14152
dx.doi.org/10.1021/ie3009583 | Ind. Eng. Chem. Res. 2012, 51, 14145−14157
Industrial & Engineering Chemistry Research Article
Table 7. Environment Impact Data of Sequestration Facility Installation type damage impact valuea unit DGR ecosystem quality land use 18876 PDF·m2·yr SAS ecosystem quality land use 18876 PDF·m2·yr
aEstimated based on Wildbolz.8.
capture facilities does not use land because they are established within existing power plants.
In fact, there is a limit to the system boundary of the LCA we
can consider because the case study in our previous work4 was
adopted as a benchmark. For example, this model cannot be
compared to other cases with no CCS system or a system which
uses CO2 for tertiary oil recovery. Moreover, the LCA of
extraction and transport of coal and gas, power generation and
transmission and power plant construction is not included.
These limitations will be supplemented in future works. 5. RESULTS AND DISCUSSION
The proposed multiobjective model is solved by the ε-constraint
method for optimal planning of the CCS infrastructure of Korea
in 2020 with minimizing total cost and Eco-indicator 99 score.
The model was implemented in GAMS and solved using the
CPLEX 9.0 solver on an Intel 2.80 GHz machine. All solutions
were obtained quickly with low optimality gaps. In all case
Table 8. Capital, Operating Costs, and Eco-indicator 99 Damage Score of CO
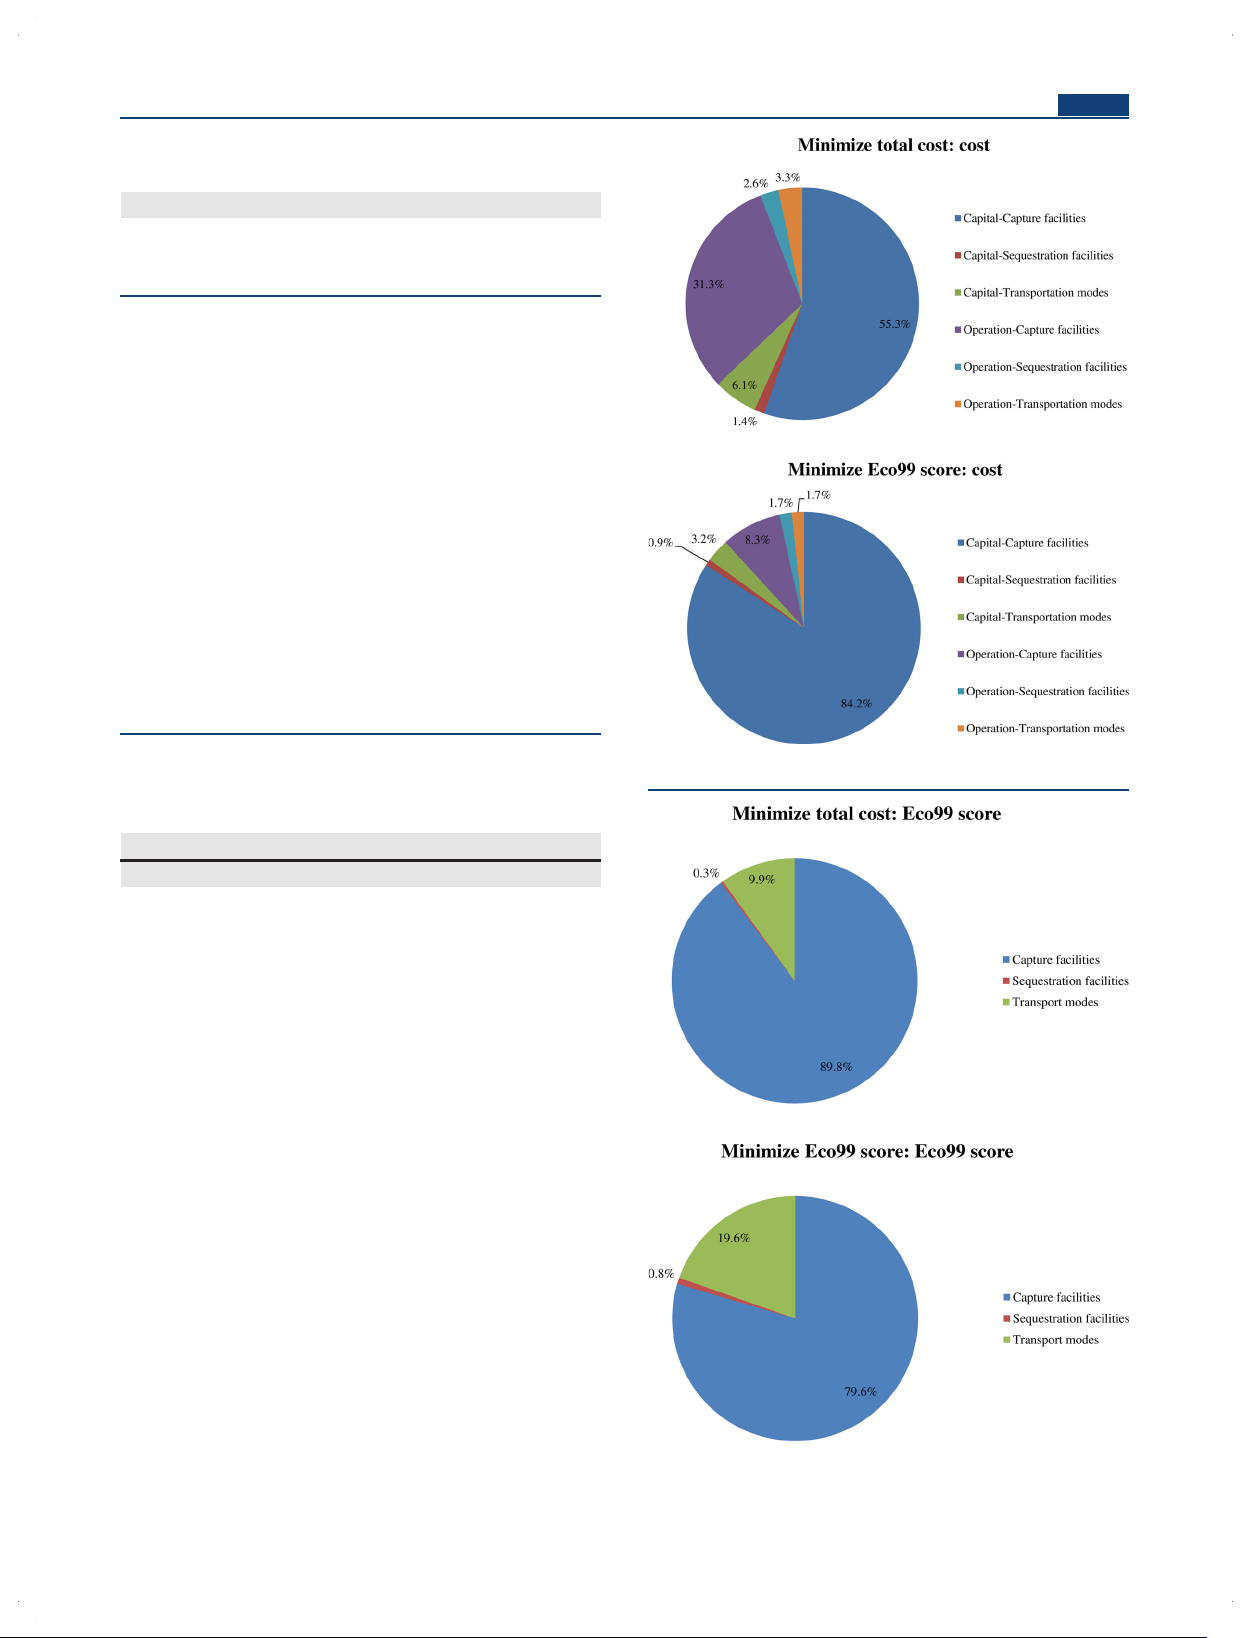
Figure 6. Breakdown of cost for the extreme Pareto solutions.
2 Infrastructure Planning for Two Extreme Cases CO ·
2 reduction target: 1.5 × 10⁷ tCO2 y−1) (million $/y) minimize cost minimize Eco99 Capital Cost (million $/y) capture facilities 609.7 1457.53 sequestration facilities 15.34 15.34 transportation modes 67.46 56.02 total capital cost 692.1 1529 Operating Cost (million $/y) capture facilities 345.08 138.37 sequestration facilities 28.36 28.36 transportation modes 36.3 27.96 total operating cost 409.75 194.7 total cost 1102 1723
Eco-indicator 99 Impact (Points) human health, capture 16 953 200 13 964 800 human health, transport human health, sequestration total human health 16 953 200 13 964 800
eco quality capture (million points) 3 277 600 4 963 200 eco quality transport 5 179 200 3 927 600 eco quality sequestration 2 800 2 800 total ecosystem quality 8 459 600 8 893 600
resources capture (million points) 77 095 000 12 266 800 resources transport 5 560 000 3 760 000 resources sequestration 315 600 315 600 total resources 82 970 600 16 342 400
Figure 7. Breakdown of Eco99 score for the extreme Pareto solutions.
total environment impact, Eco99 108 384 600 39 202 100 14153
dx.doi.org/10.1021/ie3009583 | Ind. Eng. Chem. Res. 2012, 51, 14145−14157
Industrial & Engineering Chemistry Research Article
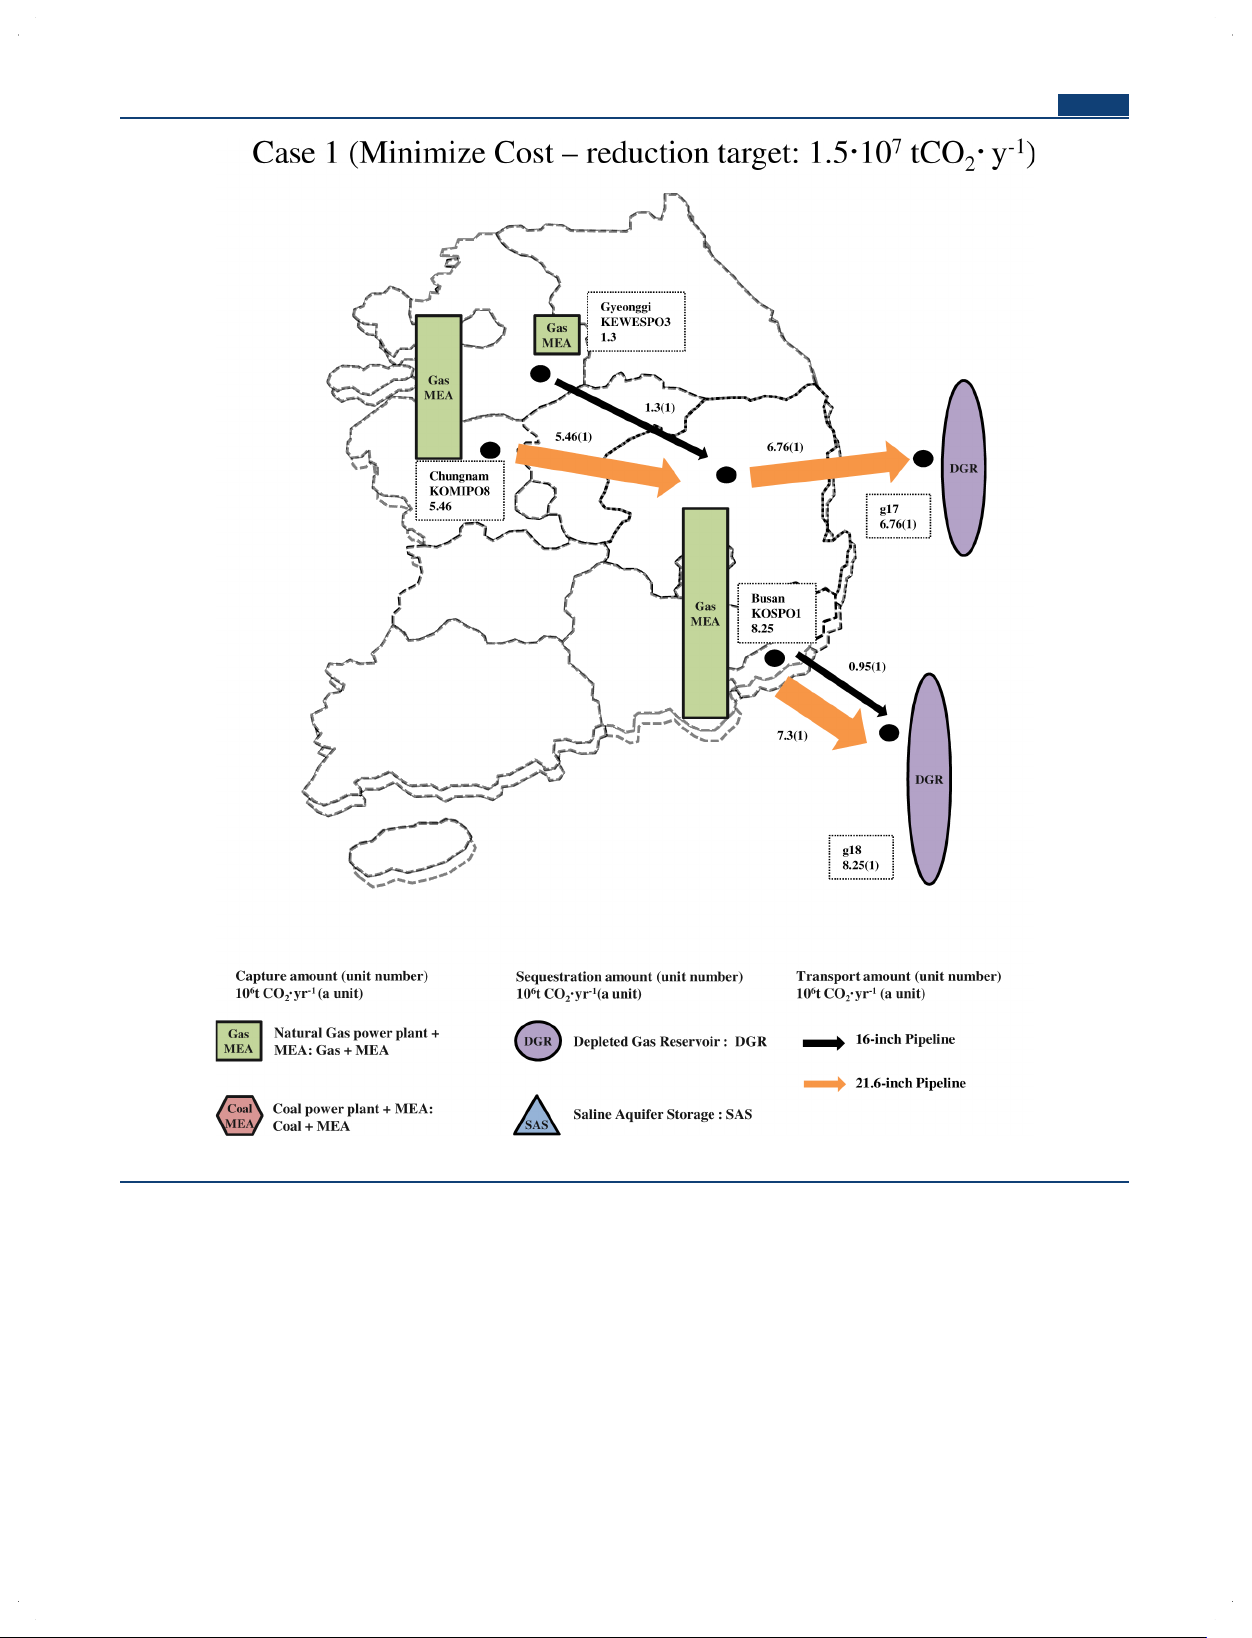
Figure 8. Minimize cost solution.
studies, the number of constraints, integer variables, and
both cases. These results show that the overall CCS infra-
continuous variables are 5621, 838, and 15261 with zero
structure planning is sensitive to the economic and environ-
optimality gap. Each solving time is less than one second.
mental level of CO2 capture technologies.
First, the total cost and Eco-indicator 99 score results of two
Figures 8 and 9 illustrate the optimized CCS configurations of
extreme case studies were provided (Table 8). In the case of
these cases. The configurations show the number and type of
minimization of total cost, the total cost is $ 1,102 million and the
capture and sequestration facilities installed in each region along
Eco99 score is 1.083 × 10⁸. On the other hand, the total cost is $
with the selected transportation modes between them. Note that
1,723 million and the Eco99 score is 3.92 × 10⁷ in the case of
the former case mainly uses aqueous monoethanolamine (MEA)
minimization of Eco99 score. These results imply that a trade-off
capture facilities in gas power plants, whereas they are installed in
exists between total cost and Eco99 score. The detailed Pareto
coal power plants only in the latter case. This implies that the
solution set will be presented later. Moreover, Figure 6 shows
gas−MEA facility is better than coal−MEA facility economically.
that the largest portion of total cost is the capital cost of CCS
This is because the plant size and CO2 emission of a coal power
capture facilities in both cases, and the operating cost of capture
plant are larger than those of a gas power plant. The larger plant
facilities is the second largest portion. Similarly, Figure 7 shows
needs a larger capture facility, which causes the total capital cost
that the largest damages are also caused by capture facilities in
to be more expensive. On the other hand, the coal−MEA facility 14154
dx.doi.org/10.1021/ie3009583 | Ind. Eng. Chem. Res. 2012, 51, 14145−14157
Industrial & Engineering Chemistry Research Article
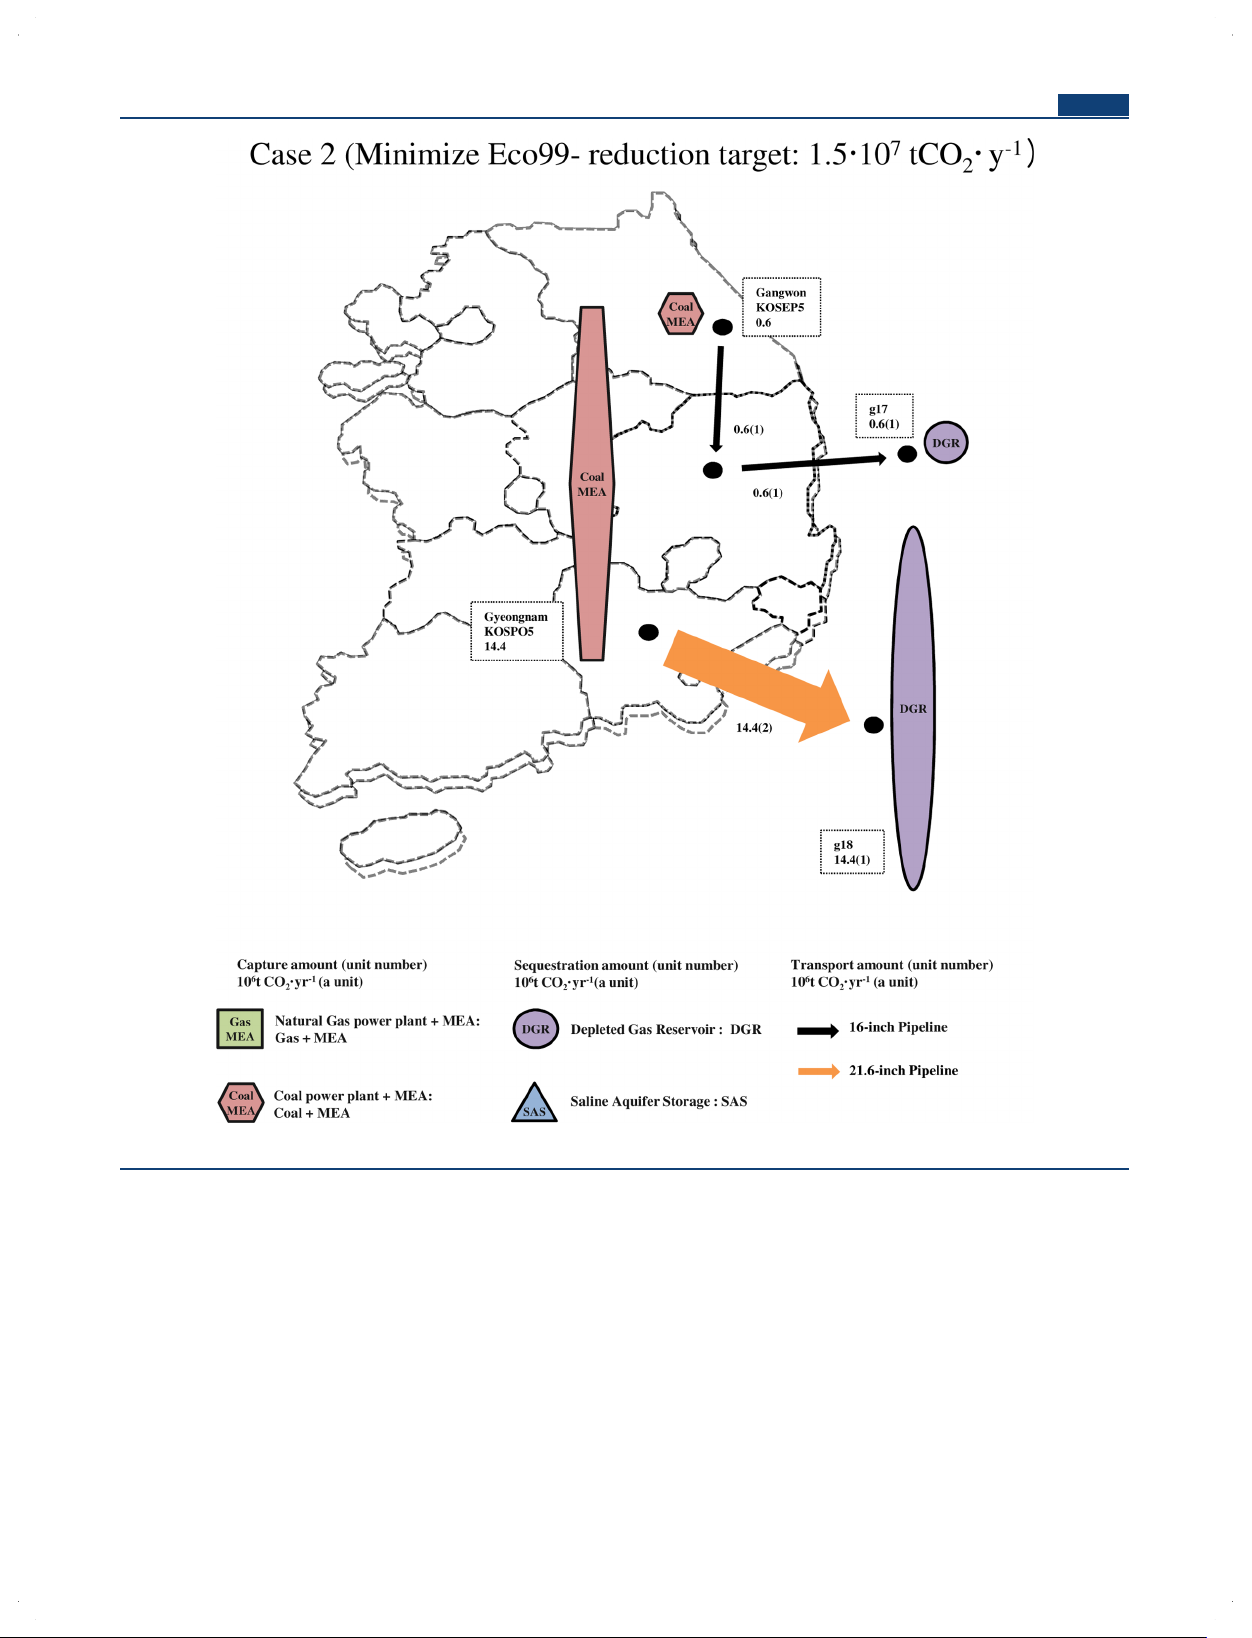
Figure 9. Minimize Eco99 score solution.
is more eco-friendly than the gas−MEA facility. This result
mainly for their capacity. This is because the cost and Eco-
makes sense because (i) the energy consumption, specifically
indicator 99 score of transportation modes and sequestration
heat energy, is the main contributor of Eco-indicator 99 scores
facilities are regarded as less important factors than those of
and (ii) the damage factor of energy uses from gas-resources for
capture facilities, as mentioned before.
operating the MEA facility is 17.5 times higher than that of coal-
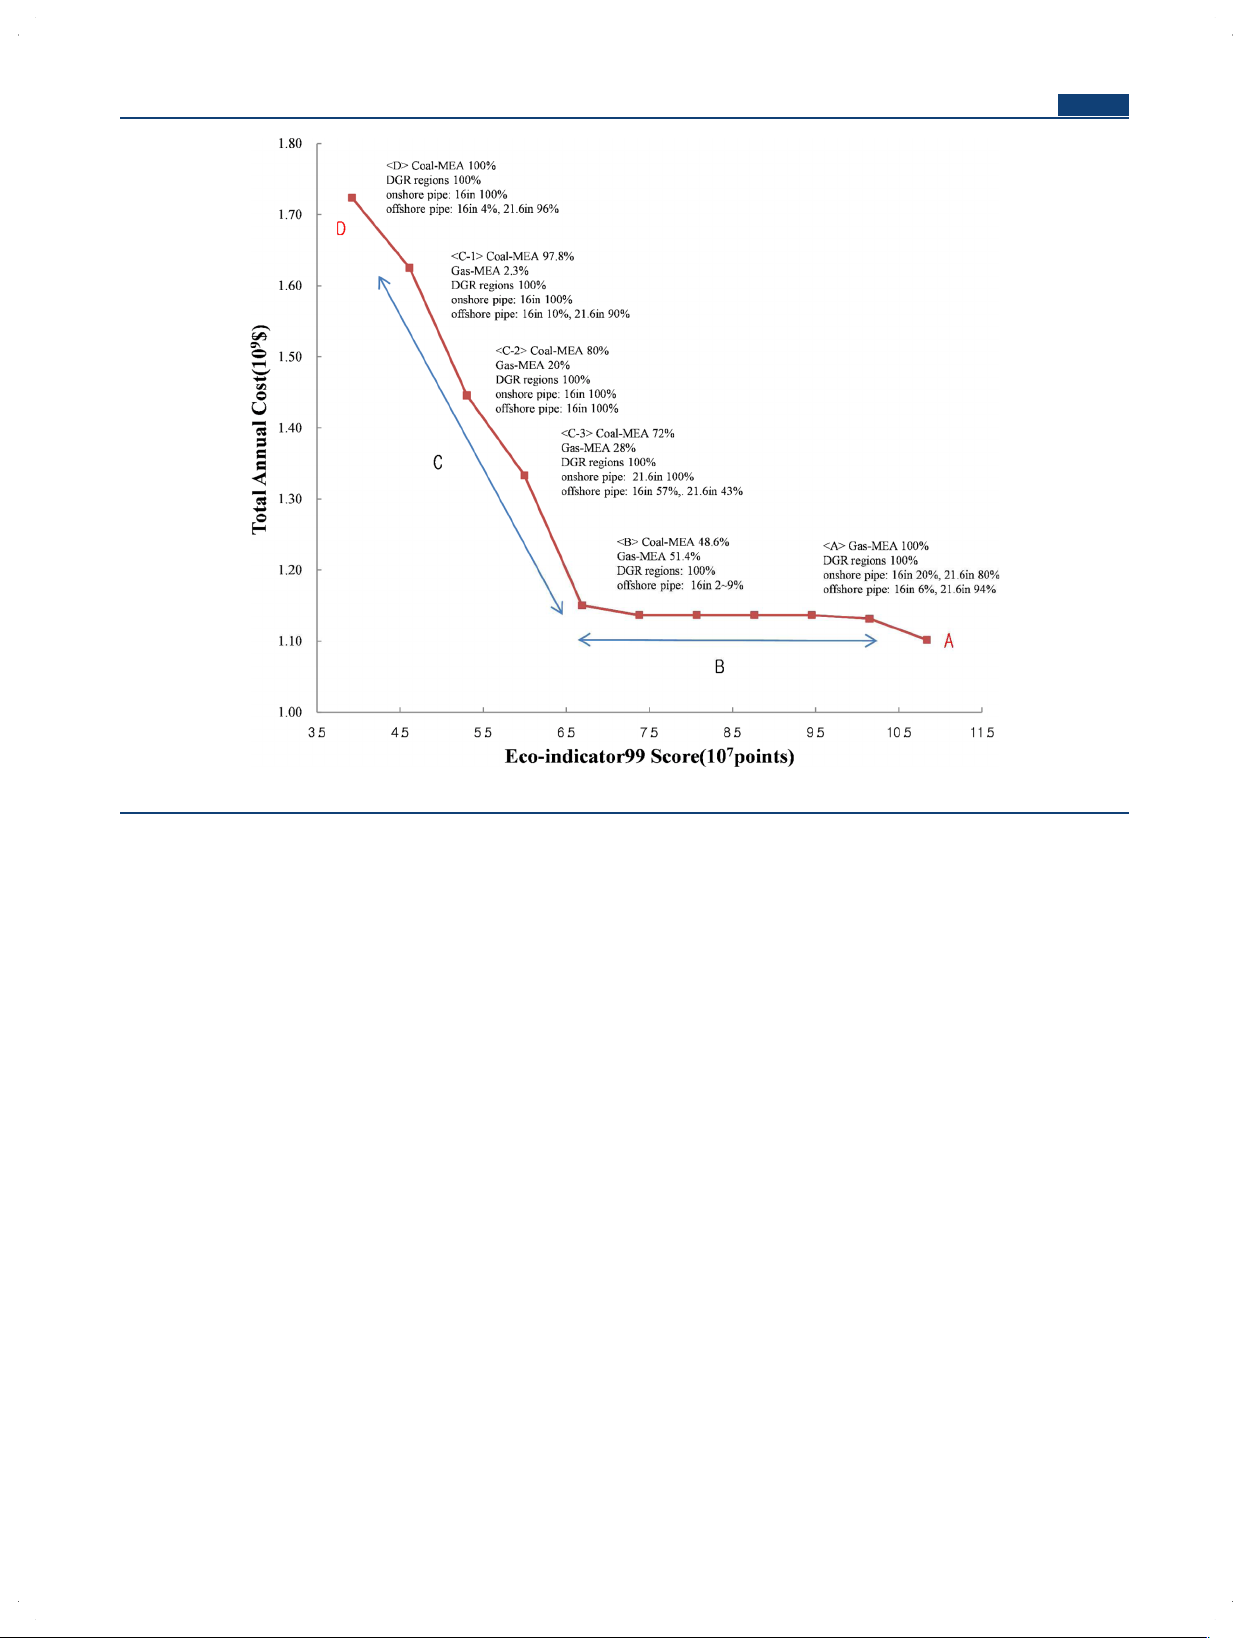
Applying the multiobjective optimization approach to the case resources.14
study results in the set of trade-off solutions presented in Figure
On the other hand, the optimal solution for sequestration
10. This figure clearly shows that the trade-off exists between
regions and transportation modes has no significant differences
total annual cost and environment impact score. Specifically, the
between these cases. Both cases prefer the 21.6 in. pipeline as the
solutions are classified into four regions: A, minimum cost
means of delivery to transport large quantities of CO2 and the 16
solution, has CO2 captured from the gas−MEA facilities only and
in. pipeline to transport moderate amount of CO2. Similarly, the
uses the 21.6 in. pipeline and DGR as the major means of
depleted gas reservoir (DGR) sequestration region in Korea,
transportation and sequestration; B uses coal−MEA and gas−
which has more available sequestration capacities than the saline
MEA facilities to capture increase similar amounts of CO2. The
aquifer storage (SAS) region4 is mainly selected. This implies the
21.6 in. pipelines and DGR are also mainly used; C-1 to C-3
optimal transportation and sequestration means are selected
increase CO2 captured in coal−MEA facilities to decrease 14155
dx.doi.org/10.1021/ie3009583 | Ind. Eng. Chem. Res. 2012, 51, 14145−14157
Industrial & Engineering Chemistry Research Article Figure 10. Pareto set.
environment impact and use 16 in. pipelines more and more; and
The capabilities of the proposed model were demonstrated
D, the minimum Eco99 solution, has CO2 captured in coal−
through a case study based on the real scenario of Korea in 2020.
MEA facilities only and transports CO2 through both 16 in. and
First, simulation results show that improving the capture
21.6 in. pipelines and sequestrates it in DGR regions. These
technology economically and environmentally is more important
results show that the type of emission source dominates the CCS
than others. Specifically, the CO2 capture in coal-fired power infrastructure planning.
plants is more preferred than in the gas-fired power plant since
Moreover, whereas the solution curve is smooth in the A to B
the coal−MEA capture facility is a more eco-friendly solution.
region, the C to D region has a significant slope. These results
This is because energy consumption, specifically heat energy, for
suggest that MEA facilities in coal power plants should be
CO2 capture processes is the main contributor of Eco-indicator
operated rather than gas plant facilities to reduce the environ-
99, and energy uses in a gas−MEA capture facility are more
ment impact (planning solution from B to D). On the other significant.
hand, replacing more than 50% of coal−MEA plants with gas−
Furthermore, the Pareto solutions which show trade-offs
MEA plants seems to be a bad choice since this solution increases
between cost and environmental impact suggest meaningful
the total environment impact to a large extent without reducing
insights into the planning problem that may lead to improve-
the total cost. For example, although the total cost of solution A is
ments of costs and environmental impacts. These decision
only 3% lower than that of B, its environment impact score is
strategies are recommended to adopt more sustainable 150% that of B.
alternatives for the CCS infrastructure. ■ 6. CONCLUSION AUTHOR INFORMATION
This paper addressed the economically and environmentally Corresponding Author
considered CCS infrastructure planning model. The model
*Tel.: +82-54-279-5967. Fax: +82-54-279-5528. E-mail: jhhan@
supports the decisions of selecting optimal CO postech.ac.kr. 2 capture,
transport, and sequestration technologies, allocating these Notes
selected technologies to potential regions and determining
The authors declare no competing financial interest.
their operating capacity to satisfy the CO2 reduction target. The
planning task was formulated as a multiobjective mixed-integer ■ REFERENCES
linear programming problem that finds minimized cost and
(1) Metz, B. IPCC Special Report on Carbon Dioxide Capture and
environmental impact. The environmental impact was measured
Storage; Cambridge University Press: Cambridge, UK, 2005
by applying the Eco-indicator 99 method, which is a LCA
(2) Middleton, R. S.; Bielicki, J. M. A scalable infrastructure model for
measure method. The ε-constraints method was applied to
carbon capture and storage: SimCCS. Energy Policy 2009, 37 (3), 1052−
confirm the trade-off between the two objective functions. 1060. 14156
dx.doi.org/10.1021/ie3009583 | Ind. Eng. Chem. Res. 2012, 51, 14145−14157
Industrial & Engineering Chemistry Research Article
(3) Han, J. H.; Lee, I. B. Development of a scalable infrastructure
model for planning electricity generation and CO2 mitigation strategies
under mandated reduction of GHG emission. Appl. Energy 2011, 88 (12), 5056−5068.
(4) Han, J. H.; Lee, I. B. Development of a scalable and comprehensive
infrastructure model for carbon dioxide utilization and disposal. Ind. Eng.
Chem. Res. 2011, 50 (10), 6297−6315.
(5) Han, J.-H.; Lee, I.-B. Two-stage stochastic programming model for
planning CO2 utilization and disposal infrastructure considering the
uncertainty in the CO2 emission. Ind. Eng. Chem. Res. 2011, 50 (23), 13435−13443.
(6) Han, Jee-Hoon; Lee, Jae-Uk; Lee, I.-B. Development of a
multiperiod model for planning CO2 disposal and utilization infra-
structure. Ind. Eng. Chem. Res. 2012, 51 (7), 2983−2996.
(7) Pehnt, M.; Henkel, J. Life cycle assessment of carbon dioxide
capture and storage from lignite power plants. Int. J. Greenhouse Gas Control 2009, 3 (1), 49−66.
(8) Wildbolz, C. Life Cycle Assessment of Selected Technologies for CO2
Transport and Sequestration. Thesis, Swiss Federal Institute of Technology, Zurich, 2007.
(9) Koornneef, J.; van Keulen, T.; Faaij, A.; Turkenburg, W. Life cycle
assessment of a pulverized coal power plant with post-combustion
capture, transport and storage of CO2. Int. J. Greenhouse Gas Control 2008, 2 (4), 448−467.
(10) Hugo, A.; Pistikopoulos, E. N. Environmentally conscious long-
range planning and design of supply chain networks. J. Clean. Prod. 2005, 13 (15), 1471−1491.
(11) Guillén-Gosálbez, G.; Mele, F. D.; Grossmann, I. E. A bi-criterion
optimization approach for the design and planning of hydrogen supply
chains for vehicle use. AIChE J. 2010, 56 (3), 650−667.
(12) Cristóbal, J.; Guillén-Gosálbez, G.; Jiménez, L.; Irabien, A. Multi-
objective optimization of coal-fired electricity production with CO2
capture. Appl. Energy 2012, 98, 266−272.
(13) Cristóbal, J.; Guillén-Gosálbez, G.; Jiménez, L.; Irabien, A.
Optimization of global and local pollution control in electricity
production from coal burning. Appl. Energy 2012, 92, 369−378.
(14) Spriensma, R.; Goedkoop, M. The Eco-indicator 99. A Damage
Oriented Method for Life Cycle Impact Assessment; PRe Consultants B.V.:
Amersfoort, The Netherlands, 2000.
(15) Heijungs, R.; Sun, S. The computational structure of life cycle
assessment. Int. J. Life Cycle Assess. 2002, 7 (5), 314−314.
(16) Ehrgott, M. Multicriteria Optimization; Springer Verlag: Berlin, 2005; Vol. 491.
(17) Steuer, R. E. Multiple Criteria Optimization: Theory, Computation
and Application; Wiley: New York, 1986.
(18) , The 1st National Energy Master Plan: The 3rd National Energy
Committee Report 2008; National Energy Committee (NEC): Beijing, China, 2008.
(19) Odeh, N. A.; Cockerill, T. T. Life cycle GHG assessment of fossil
fuel power plants with carbon capture and storage. Energy Policy 2008, 36 (1), 367−380. 14157
dx.doi.org/10.1021/ie3009583 | Ind. Eng. Chem. Res. 2012, 51, 14145−14157
Tài liệu liên quan:
-

Ung dung game hoa trong cac chien dich MKT
17 9 -

Bao cao Chi so TMDT Viet Nam 2025
15 8 -

Thông tư quy định về việc phân quyền, phân cấp và phân định thẩm quyền quản lý nhà nước về giáo dục cho chính quyền địa phương
22 11 -

Nghị quyết về phát huy các giá trị di sản văn hóa gắn với phát triên du lịch bền vững tỉnh Khánh Hòa đến năm 2025, định hướng đến năm 2030
12 6 -

Quyết định phê duyệt Chiến lược phát triển du lịch Việt Nam đến năm 2030
12 6