A novel intercooling carbon dioxide capture process using ionic liquids with ultra-low energy consumption
A novel intercooling carbon dioxide capture process using ionic liquids with ultra-low energy consumption. Tài liệu được sưu tầm giúp bạn tham khảo, ôn tập và đạt kết quả cao. Mời bạn đọc đón xem.
Môn: Tài liệu Tổng hợp 3.6 K tài liệu
Trường: Tài liệu khác 3.9 K tài liệu
Tác giả:


Preview text:
Energy 301 (2024) 131670
Contents lists available at ScienceDirect Energy
journal homepage: www.elsevier.com/locate/energy
A novel intercooling carbon dioxide capture process using ionic liquids with ultra-low energy consumption
Hong Huang a, Ralf Peters b,f, Remzi Can Samsun b, Detlef Stolten c,d,e, Chang He a,*, Xiantai Zhou a,**
a School of Chemical Engineering and Technology, Sun Yat-sen University, Zhuhai, 519082, China
b Electrochemical Process Engineering (IEK-14), Forschungszentrum Jülich GmbH, Jülich, 52425, Germany
c Techno-Economic Systems Analysis (IEK-3), Forschungszentrum Jülich GmbH, 52425, Jülich, Germany
d JARA-ENERGY, 52056, Aachen, Germany
e Chair for Fuel Cells, RWTH Aachen University, 52072, Aachen, Germany
f Synthetic Fuels, Ruhr Universit¨at Bochum, 44780, Bochum, Germany A R T I C L E I N F O A B S T R A C T Keywords:
This study focuses on the use of ionic liquids as solvents for carbon dioxide capture due to their low energy Ionic liquid
demand. We screened an ideal ionic liquid, 1-ethyl-3-methylimidazolium bis[trifluoromethylsulfonyl]imide Process simulation ([emim][Tf Energy consumption
2N]), based on its excellent absorption capacity and low viscosity. We performed thermodynamic
modeling of the gas-liquid phase equilibrium to lay the foundation for process simulation. A basic process was Economic analysis
designed for benchmarking performance, and various cases were compared by adjusting key operating param-
eters such as pressure and temperature. The results showed that the lowest specific capture energy achieved was
1.12 GJ/t at 20 bar and 5 ◦C. However, further improvements in energy performance were constrained by
reduced absorption capacity and increased viscosity resulting from lower operating pressures and temperatures.
To address these constraints, we proposed a novel process that optimized the temperature profile in the ab-
sorption column by dividing it into two sections with intercooling. This approach did not require significant
changes to the base case but offered multidimensional benefits, including reduced energy demand and associated
equipment costs. The specific capture energy was further reduced to 1.04 GJ/t. Economic analysis indicated that
the capture cost at a production scale of 13.7 kt/a was 206 $/t but had the potential to be reduced to 82 $/t. The
costs associated with compressors were found to be the major contributors to both equipment and capture costs.
The proposed novel process demonstrates promising benefits and highlights the importance of further investi-
gation into low-pressure operation. 1. Introduction
have proposed efficient approaches. On one hand, conventional tech-
nologies can be improved through process intensification and integra-
To address the challenge of reducing CO2 emissions, various tech-
tion. On the other hand, new capture techniques are being explored,
nology options have emerged for CO2 capture through physiochemical
such as the use of innovative solvents with high CO2 absorption capacity
methods. These technologies can be broadly classified into solvent ab- and low regeneration energy.
sorption, solid adsorption, and membrane separation [1], each with its
Ionic liquids are a class of solvents that have demonstrated excellent
own advantages and disadvantages depending on the specific scenarios.
properties for CO2 capture. They exhibit high absorption capacity and
For instance, amine scrubbing is widely recognized as the industry’s
selectivity, negligible volatility, and a significant advantage of not
leading technology for capturing CO2 from flue gases. However, it still
necessarily requiring thermal regeneration. As a result, they offer the
exhibits high energy demand of around 2.5–4.0 GJ/t during solvent
potential for achieving ultra-low specific energy consumption. In a study
thermal regeneration [2,3]. To overcome this challenge, researchers
conducted by Ma et al. [4], the energy demand of two ionic liquids was * Corresponding author. ** Corresponding author.
E-mail addresses: hechang6@mail.sysu.edu.cn (C. He), zhouxtai@mail.sysu.edu.cn (X. Zhou).
https://doi.org/10.1016/j.energy.2024.131670
Received 22 December 2023; Received in revised form 24 March 2024; Accepted 14 May 2024 Available online 17 May 2024
0360-5442/© 2024 Elsevier Ltd. All rights are reserved, including those for text and data mining, AI training, and similar technologies. H. Huang et Energy al. 301 (2024) 131670
found to be only 2.63 and 2.70 GJ/t-CO2, compared to the frequently
2. Process design and analysis
used monoethanolamine (MEA) solvent, which had an energy demand
of 3.58 GJ/t-CO2. The lower energy demand of ionic liquids makes them
In the initial stage of the study, the selection of an appropriate ionic
a promising alternative for more efficient and sustainable CO2 capture
liquid is carried out, taking into account factors such as its molecular processes.
structure, viscosity, and CO2 solubility. This step ensures that the chosen
Motivated by the inherent low energy demand of ionic liquids,
ionic liquid possesses the desired properties for effective CO2 capture.
extensive studies are being performed from different perspectives. Basha
Following the selection, a thorough analysis of the physical properties of
et al. [5] developed a conceptual process for CO2 capture from flue gases
the chosen ionic liquid is conducted. This analysis provides valuable
using the ionic liquid of [hmim][Tf2N]. The physical properties of the
insights into its behavior and characteristics, which are crucial for un-
ionic liquid were first analyzed and then the operating parameters and
derstanding its performance in CO2 capture processes. Additionally, a
the CO2 capture efficiency were investigated. The results suggested that
thermodynamic model is employed to accurately describe the phase
the ionic liquid is a suitable solvent for CO2 capture with high efficiency
equilibrium of the gas-liquid system, further enhancing the under-
of 95.12 %. Wang et al. [6] employed an ionic liquid of [bmim][Tf2N]
standing of the system’s behavior. With the knowledge gained from the
for the simultaneous removal of CO2 and H2S. The capture rates of the
physical properties analysis and the thermodynamic model, process
two acid gases were analyzed by changing the ionic liquid flowrate,
simulations are performed using the Aspen Plus simulator. These sim-
operating pressure and temperature. The capture rates were also
ulations enable the generation of material and energy balances, which
compared with the Rectisol process using low-temperature methanol as
serve as the foundation for subsequent evaluations of energy con-
the solvent, and the results showed that the ionic liquid process achieved
sumption and economic feasibility.
97.6 % CO2 capture rate while the Rectisol was 89.7 %. A similar study
employed a low-viscosity ionic liquid of [C6mim][TCM] [7]. Novel
2.1. Ionic liquid selection
pressure and temperature swing schemes were systematically compared
based on the same operating conditions and rigorous process simula-
An ideal ionic liquid should possess desirable characteristics such as
tions. It was concluded that the combination of pressure and tempera-
high CO2 solubility, selectivity, and low viscosity. To date, a wide range
ture swing is the most feasible configuration for solvent regeneration.
of ionic liquids have been synthesized, as a cation can be combined with
Xie et al. [8] also performed an energy consumption analysis for eigh-
different anions and vice versa. Previous research has indicated that
teen imidazolium-based ionic liquids considering pressure swing and/or
anions play a key role in the solubility of CO2. Free volume space and the
temperature swing. For the pressure swing, the optimal ionic liquid with
number of flour groups in the anion are two important parameters
the lowest capture energy was identified to be [emim][EtSO4], but in the
affecting CO2 solubility [12]. In this respect, the [Tf2N] and [PF6] are
temperature swing, the optimal candidate changed to be [emim][PF6]
suitable anions. Cations are the secondary factor to the CO2 solubility.
with a much higher energy demand, which was a result of heat losses
Imidazolium-based rings are the most frequently used cations. In gen-
during regeneration caused by the large heat capacity. To overcome the
eral, the CO2 solubility slightly increases with the alkyl chain length in
limitations of high viscosity, Ma et al. [9] performed a combined
cations but significantly increases the viscosity of ionic liquids [12].
experimental and simulation study by using binary mixtures of [bmim]
Palomar et al. [13] explicitly pointed out that low viscosity and molar
[OAc] with polyethylene glycol, propylene carbonate, and water. The
weight are the keys to minimizing solvent consumption, energy duty,
optimal hybrid solvent could achieve a 11 % reduction in specific cost
and equipment size. Therefore, a shorter alkyl chain length is preferred.
compared to aqueous amine solution due to the halved utility demand.
A study by de Riva et al. [14] compared eight ionic liquids containing
In the respect of economic performance, Hospital-Benito et al. [10]
different cations under various operating conditions. It was found that
performed a techno-economic feasibility analysis for CO2 capture by
[emim][Tf2N] outperformed other candidates in both energy and cost.
chemical absorption using ionic liquids. Three ionic liquid candidates of
García-Guti´errez et al. [15] performed a techno-economic feasibility
[P2228][CNPyr], [P66614][CNPyr] and [Bmim][acetate] were considered
study for three ionic liquids. The [emim][Tf2N] was also found to be the
in their study for the scenario of post-combustion capture. The lowest
optimal ionic liquid. Based on these previous studies, [emim][Tf2N] is
capture cost was calculated to be 81.32 $/t with [P2228][CNPyr] under
selected in this study as an ideal solvent for CO2 capture.
optimized operating conditions. In a following study, Moya et al. [11]
designed a process for CO2 capture from biogas using the above iden-
2.2. Physical properties
tified optimal ionic liquid. The best specific energy consumptions were
found at 50 ◦C in the absorber and 95 ◦C in the stripper at atmospheric
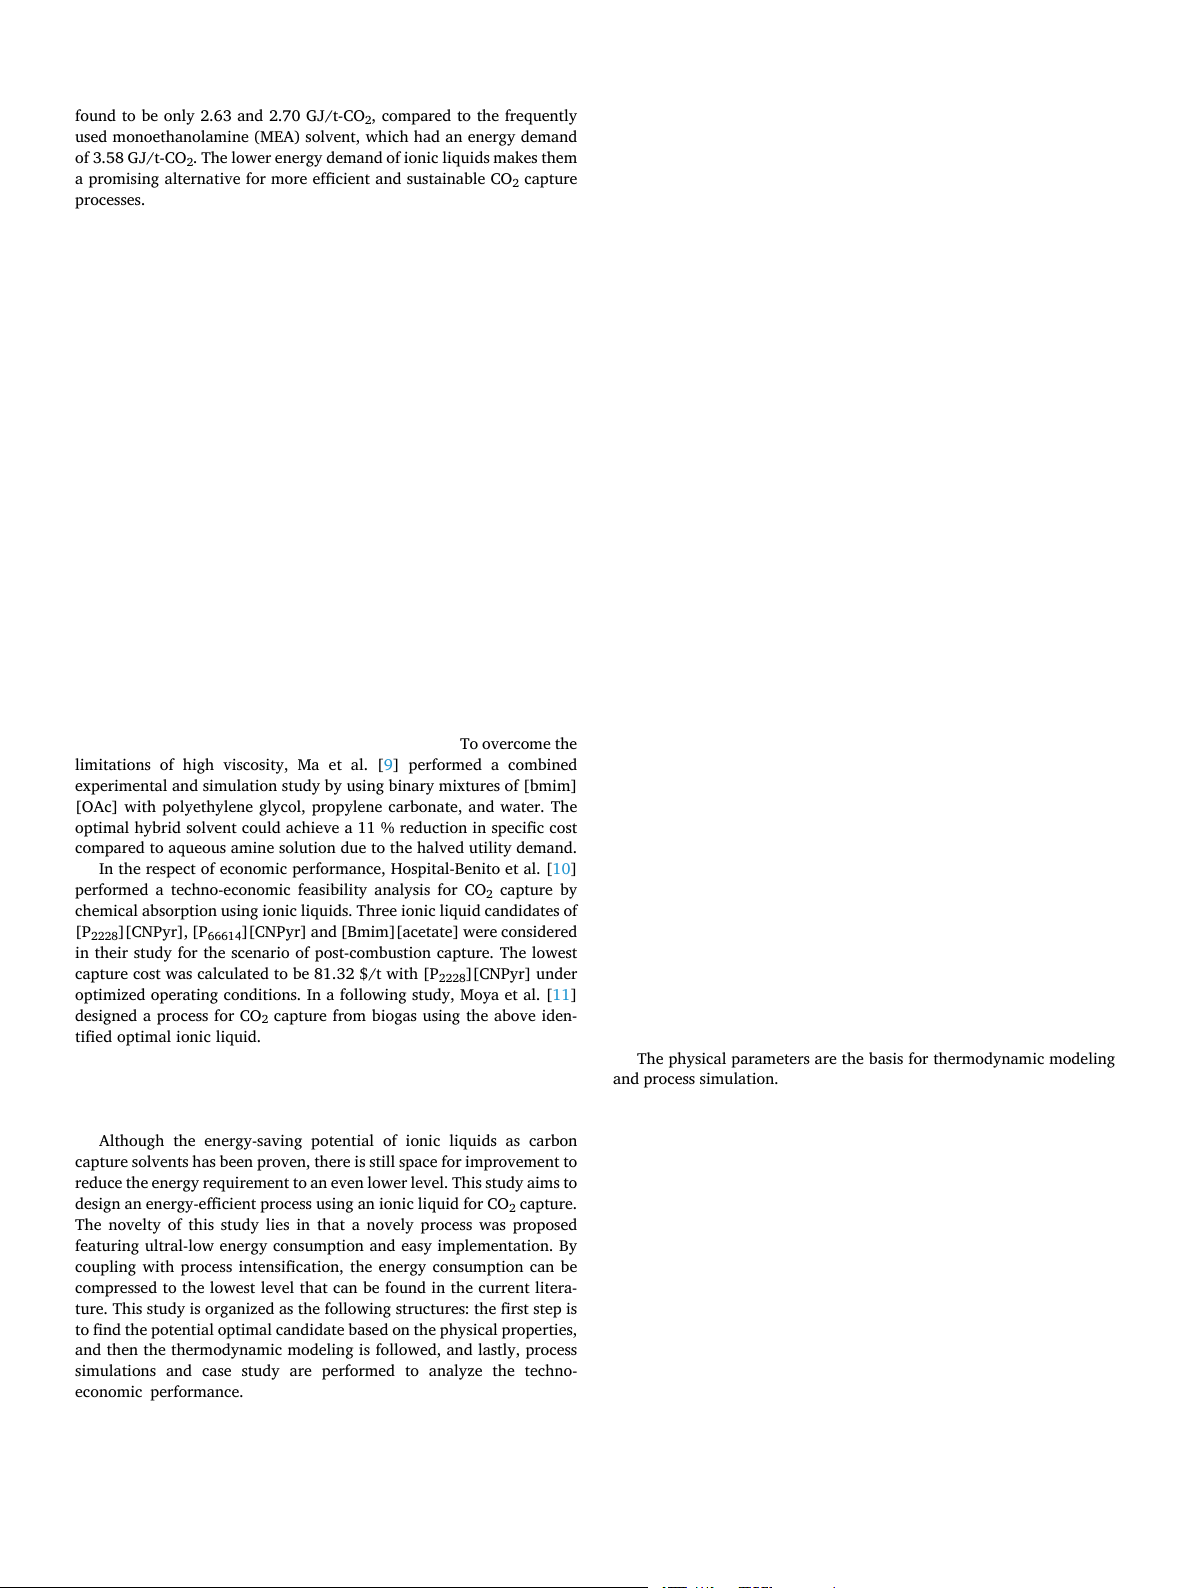
The physical parameters are the basis for thermodynamic modeling
pressure. Increasing the operating pressure of the absorber to 6 bar
and process simulation. It will be seen that the ionic liquid shows many
reduced the energy consumption from 0.8 kWh/Nm3 to 0.2 kWh/Nm3
unique properties compared to organic solvents. The density of [emim]
and the equipment cost from 1.06 to 0.98 MM$.
[Tf2N] is a function of temperature and is shown in Fig. 1a. The density
Although the energy-saving potential of ionic liquids as carbon
is higher than common organic solvents and almost linearly decreases
capture solvents has been proven, there is still space for improvement to
with temperature. The heat capacity is shown in Fig. 1b and is compared
reduce the energy requirement to an even lower level. This study aims to
with that of methanol. The heat capacity of both [emim][Tf2N] and
design an energy-efficient process using an ionic liquid for CO2 capture.
methanol linearly increased temperature, and the value of the former is
The novelty of this study lies in that a novely process was proposed
four to six times that of the latter, as shown in Fig. 1b. The viscosity is
featuring ultral-low energy consumption and easy implementation. By
also compared in Fig. 1c. The viscosity decreases rapidly with temper-
coupling with process intensification, the energy consumption can be
ature but is still several times higher than that of methanol. Therefore,
compressed to the lowest level that can be found in the current litera-
the high viscosity of ionic liquids is a disadvantage for CO2 capture.
ture. This study is organized as the following structures: the first step is
From a mass transport perspective, a higher temperature is preferred but
to find the potential optimal candidate based on the physical properties,
this, in turn, reduces the CO2 absorption capacity. Therefore, the oper-
and then the thermodynamic modeling is followed, and lastly, process
ating temperature must be balanced between these two aspects.
simulations and case study are performed to analyze the techno-
economic performance. The proposed process can be generalized to
2.3. Thermodynamic modeling
any other solvents for CO2 capture to realize low energy consumption.
According to the thermodynamic theory for phase equilibrium, the
fugacity of a component in the gas phase should be equal to its fugacity
in the liquid phase, and is formulated in the equation below [4]: 2 H. Huang et Energy al. 301 (2024) 131670
Fig. 1. Temperature dependence of density (a); heat capacity (b); and viscosity (c). ( / )
φViyip = xiHi γi γ∞i γ∞ i = limγ x i i→0 (1) Table 2
ln Hi = ai + bi/T
Critical properties of [emim][Tf2N]. Component MW T
where p is the total pressure, b/K Tc/K Vc/m3/kmol
φVi is the component fugacity in the gas phase, y [emim][Tf2N] 391.3 805.93 1244.7 0.893
i and xi are the molar fractions in the gas and liquid phases,
respectively, γi is the activity coefficient, and γ∞i is the infinite dilution
activity coefficient. The Henry constants of CO2 are obtained through ∑ ⎛ ∑ ⎞
fitting experimental data from Finotello et al. [16] and those of CH x x 4 are jτjiGji mτmjGmj j ∑ x ⎜ ⎟
given by Liu et al. [17], as presented in Table 1. ln jGij γ m i = ∑x +
∑x ⎝τij − ∑x ⎠ The kGki j kGkj kGkj (3)
φVi and γi are calculated by the equation of state and activity in k k k
the coefficient model, namely the NRTL-RK method: ( ) / G − α τ T α
The RK model for the gas phase [4]: ij = exp ijτij
ij = aij + bij
ij = cij(i ∕ = j) where a p RT a
ij, bij and cij are binary interaction parameters, αij non-random
= V − b − T0.5V(V + b)
factor, an Gij is interaction energy between components i and j. 2
The binary interaction parameters of the NRTL model between CO .5 2
a = 0.42748 R2Tc p
b = 0.08664 RTc
and [emim][Tf2N] are directly retrieved from the Aspen Plus v12 c pc (2)
databank. However, the parameter for the pair of CH4 and [emim] Z = pV/RT
[Tf2N] is missing. The UNIFAC model was used to estimate these missing ln a
parameters by the group contribution method. The Group-group inter-
φ = Z − 1 − ln(Z − bp/RT) − bRT1.5 + ln(1 + bp/ZRT)
action parameters are based on the results of Chen et al. [18] and is
given in Table A2 in the Apendices. The estimated binary interaction
where pc is critical pressure, Tc is critical temperature, Z is compress-
parameters are placed in Table 3.
ibility factor, V is molar volume, R is universal gas constant; and both the
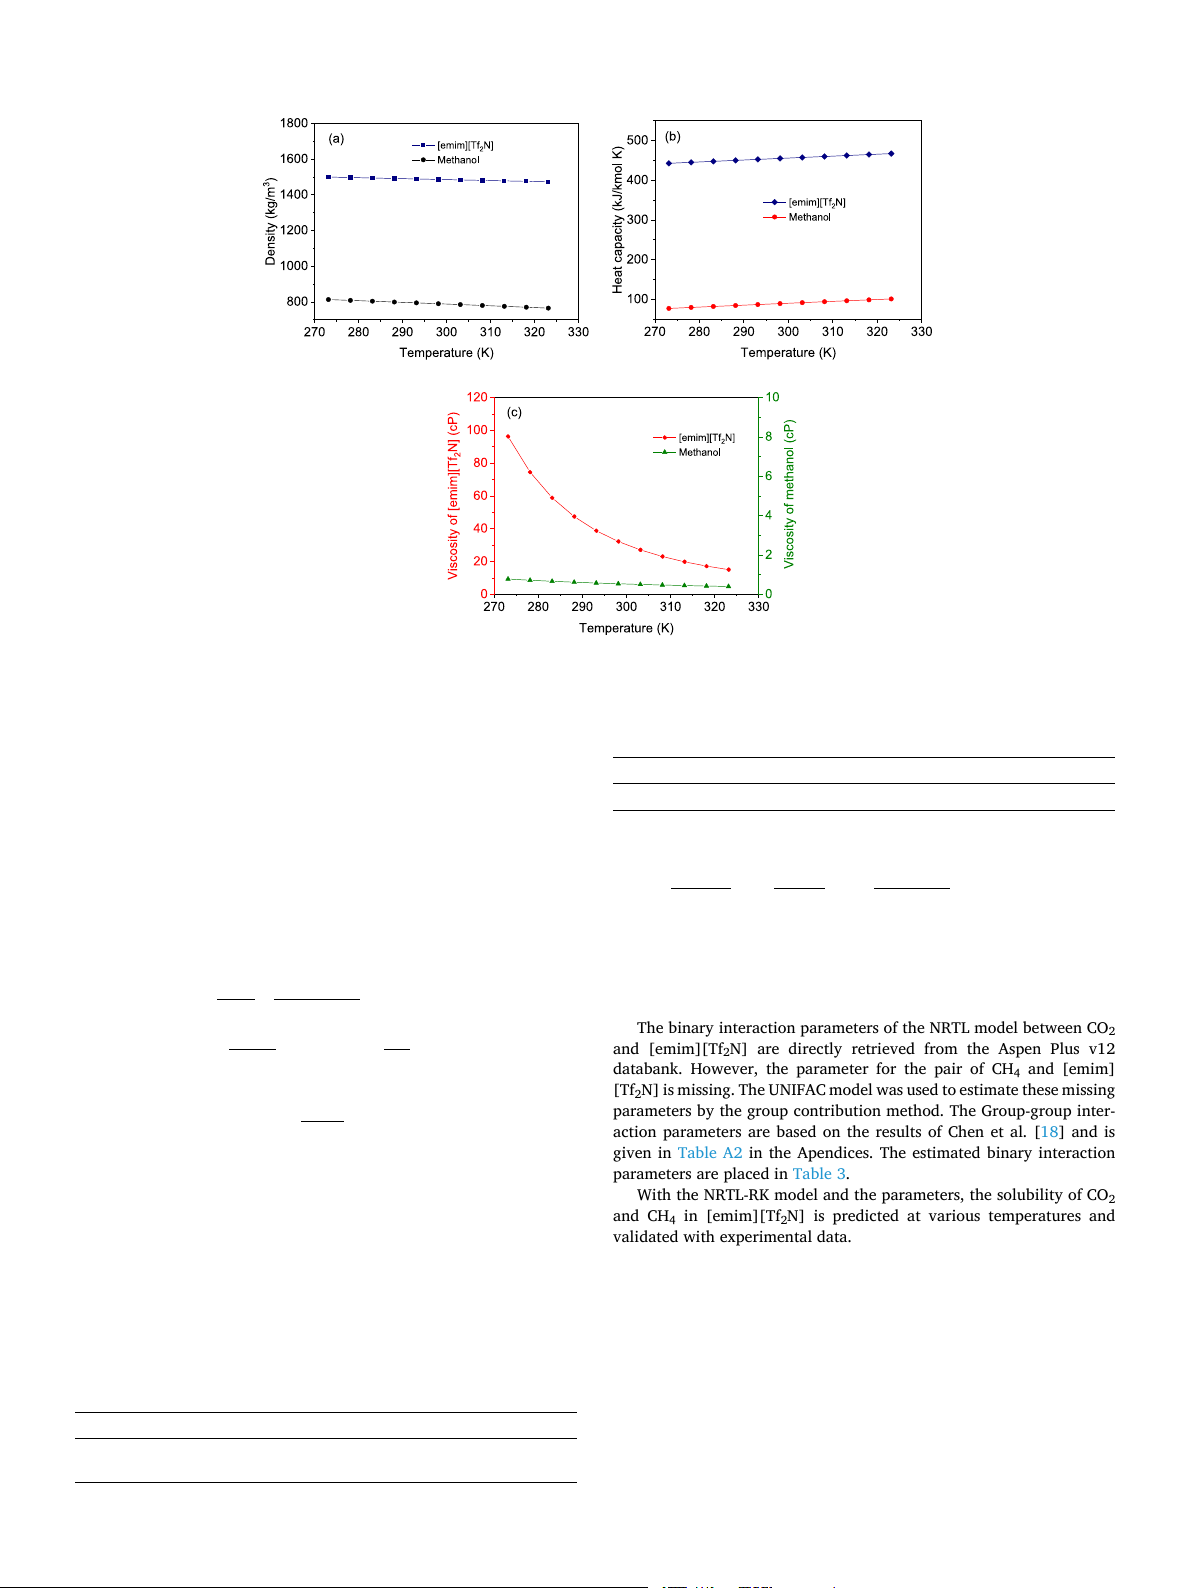
With the NRTL-RK model and the parameters, the solubility of CO
a and b are constants in the RK equation for a specific component. The 2 and CH
critical properties are obtained from the databank of Aspen Plus and
4 in [emim][Tf2N] is predicted at various temperatures and
validated with experimental data. In Fig. 2a, the predicted solubility of shown in Table 2. CO
The NRTL model for the liquid phase (Ma et al., 2017):
2 is displayed by the lines with different colors while the corre-
sponding points are the experimental results. At each temperature
considered, the predicted values match the measured ones very well.
Compared to the solubility of CO2, the solubility of CH4 is much lower,
as shown in Fig. 2b, and it increases linearly with the molar fraction at
low CH4 concentration, which is consistent with Henry’s law. In addi- Table 1
tion, the calculated solubility is lower than the measured ones and the
Henry constants of CO2 and CH4 in [emim][Tf2N].
deviations increase with the molar fraction, as the Henry’s law is not Component i ai bi Temperature unit Pressure unit
applicable when the CH4 concentration becomes high. However, in later CO
process simulations, the CH4 molar fraction in the liquid phase will not 2 8.948 − 1576.1 K atm CH4 5.3591 − 425.57 K MPa
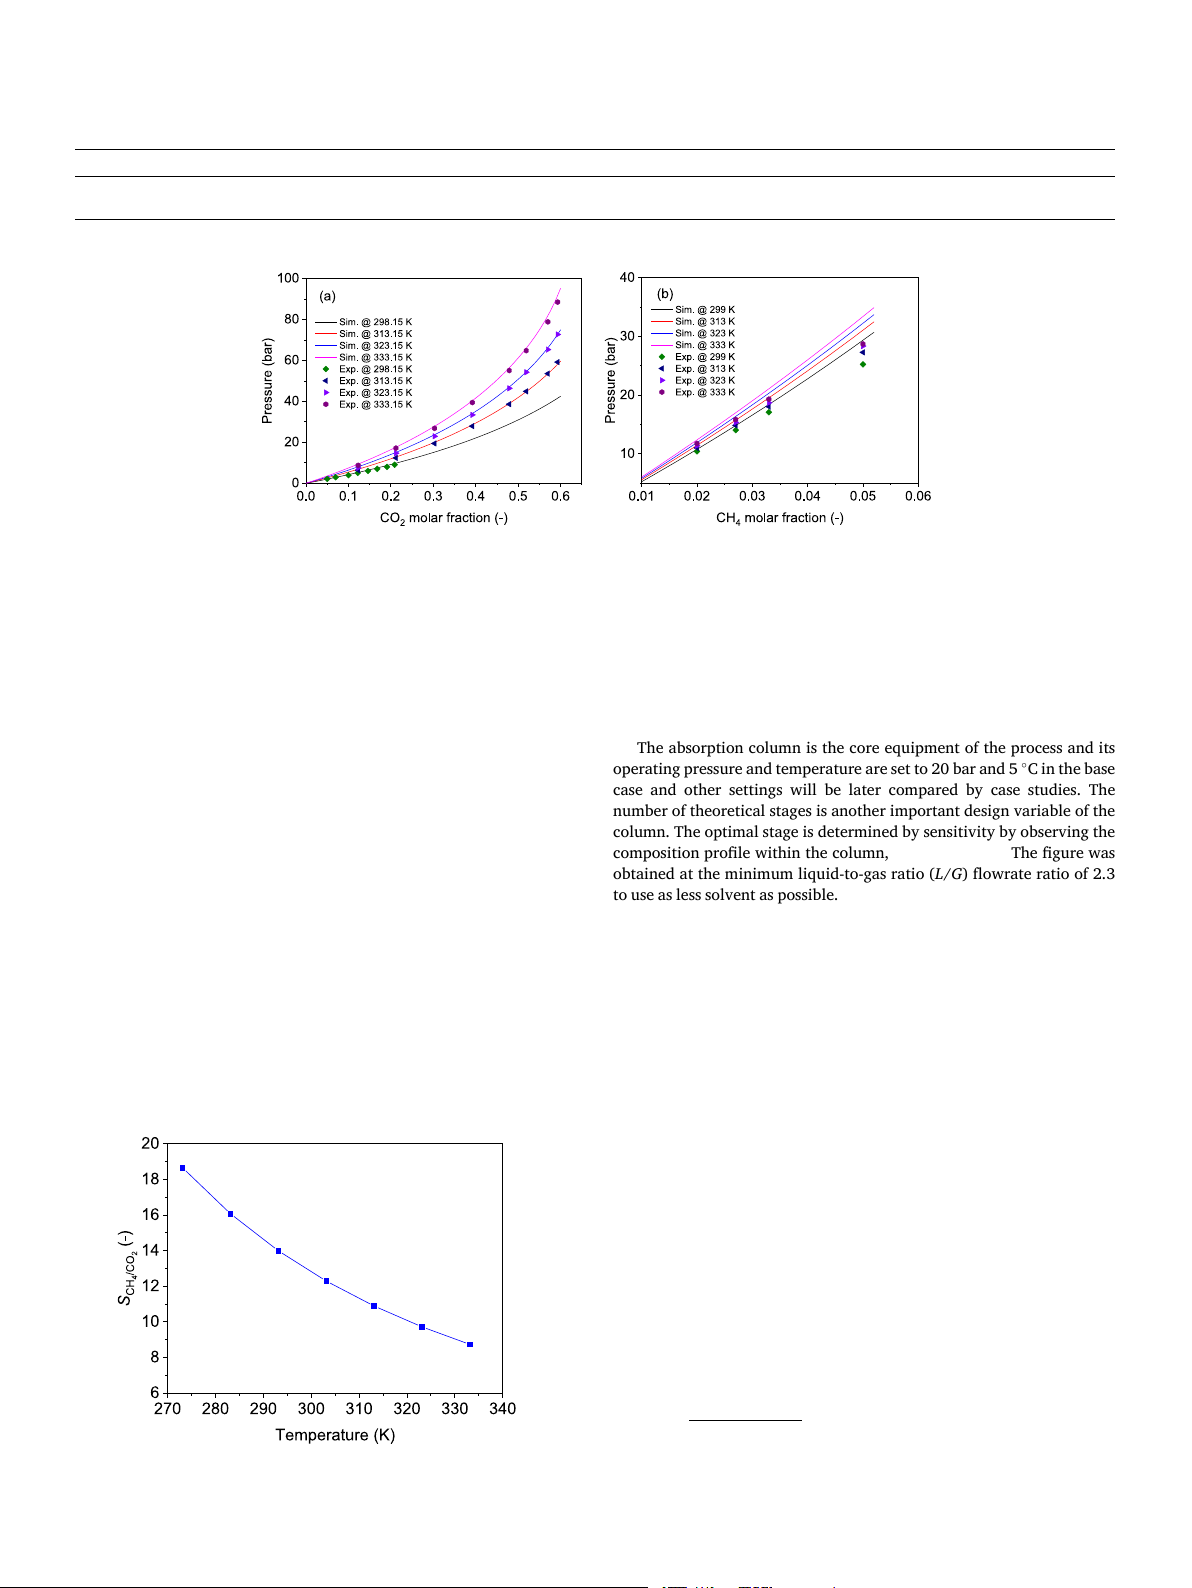
exceed 3 % in all cases, so the error will be small. The selectivity of CO2 3 H. Huang et Energy al. 301 (2024) 131670 Table 3
The binary interaction parameters of the NRTL model. Component i Component j aij aji bij bji cij Temperature unit CO2 [emim][Tf2N] 0.648272 − 0.837784 0 0 0.499721 C CH4 [emim][Tf2N] 0 0 506.364 − 333.242 0.3 K
Fig. 2. Solubility of CO2 (a); and CH4 (b) at different temperatures and validation with experimental data [17,19,20].
and CH4 is also analyzed, which is simply defined as the ratio of the
independent variable but is subject to the column pressure and product
Henry constants, as shown in Fig. 3. It is seen that the selectivity de-
purity specification. The pressure setting of the high-pressure flash tank
creases with temperature. In this respect, a lower temperature could
in this case is tuned to 5.4 bar. The gas stream is recycled back to the
achieve a better separation effect.
column after compression and refrigeration (Heater). The liquid stream
from the high-pressure flash tank goes to a low-pressure flash tank with a
2.4. Process simulation and case study
fixed pressure of 0.1 bar to recover capture CO2 (>99 mol.%). The re-
generated ionic liquid returns to the column by a circulating pump.
This sub-section introduces the process design procedures and con-
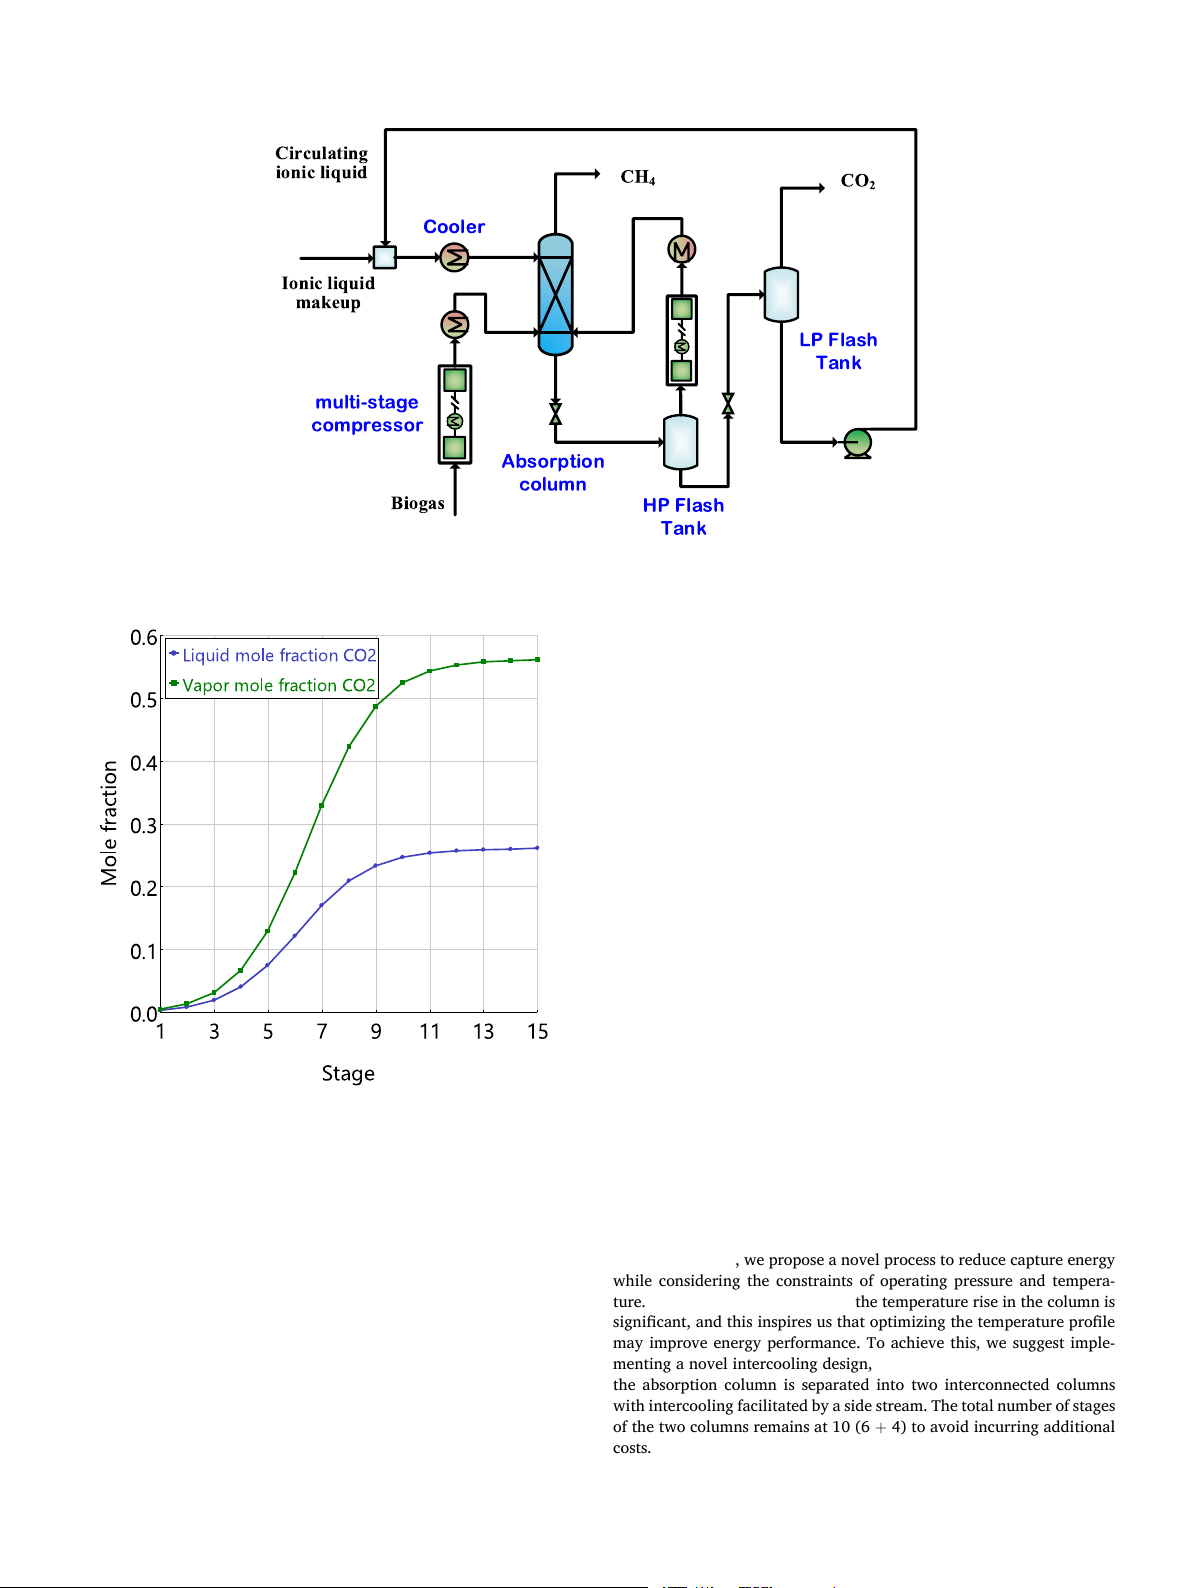
The absorption column is the core equipment of the process and its
siderations, and the energy and economic performance will be analyzed
operating pressure and temperature are set to 20 bar and 5 ◦C in the base and compared in detail.
case and other settings will be later compared by case studies. The
number of theoretical stages is another important design variable of the
2.4.1. Process description and simulation technique
column. The optimal stage is determined by sensitivity by observing the
This study considers CO2 capture from biogas with a model compo-
composition profile within the column, shown in Fig. 5. The figure was
sition of 40 % CO2 and 60 % CH4. The feed biogas flowrate is set to 100
obtained at the minimum liquid-to-gas ratio (L/G) flowrate ratio of 2.3
kmol/h. The detailed process flowsheet is displayed in Fig. 4. The biogas
to use as less solvent as possible. In this figure, the CO2 molar fraction in
is first compressed from 1 bar to 30 bar by a three-stage compressor
both gas and liquid phases increases fast in the beginning and becomes
(MCompr) and then cooled to 5 ◦C by refrigerated water before being
stable in the last. With ten stages, the purities of CH4 and captured CO2
sent to the absorption column (RadFrac). The ionic liquid with the same
can be ensured. Finally, ten stages are set for later process simulations.
temperature of 5 ◦C comes from the top of the column and the high
purity CH4 (>99 mol.%) is obtained at the top. The CO2-rich solvent
2.4.2. Material and energy balances
from the bottom of the column goes to a high-pressure flash tank
The absorption column is first analyzed to obtain deeper insights into
(Flash2) to release the absorbed CH4 from the solvent under adiabatic
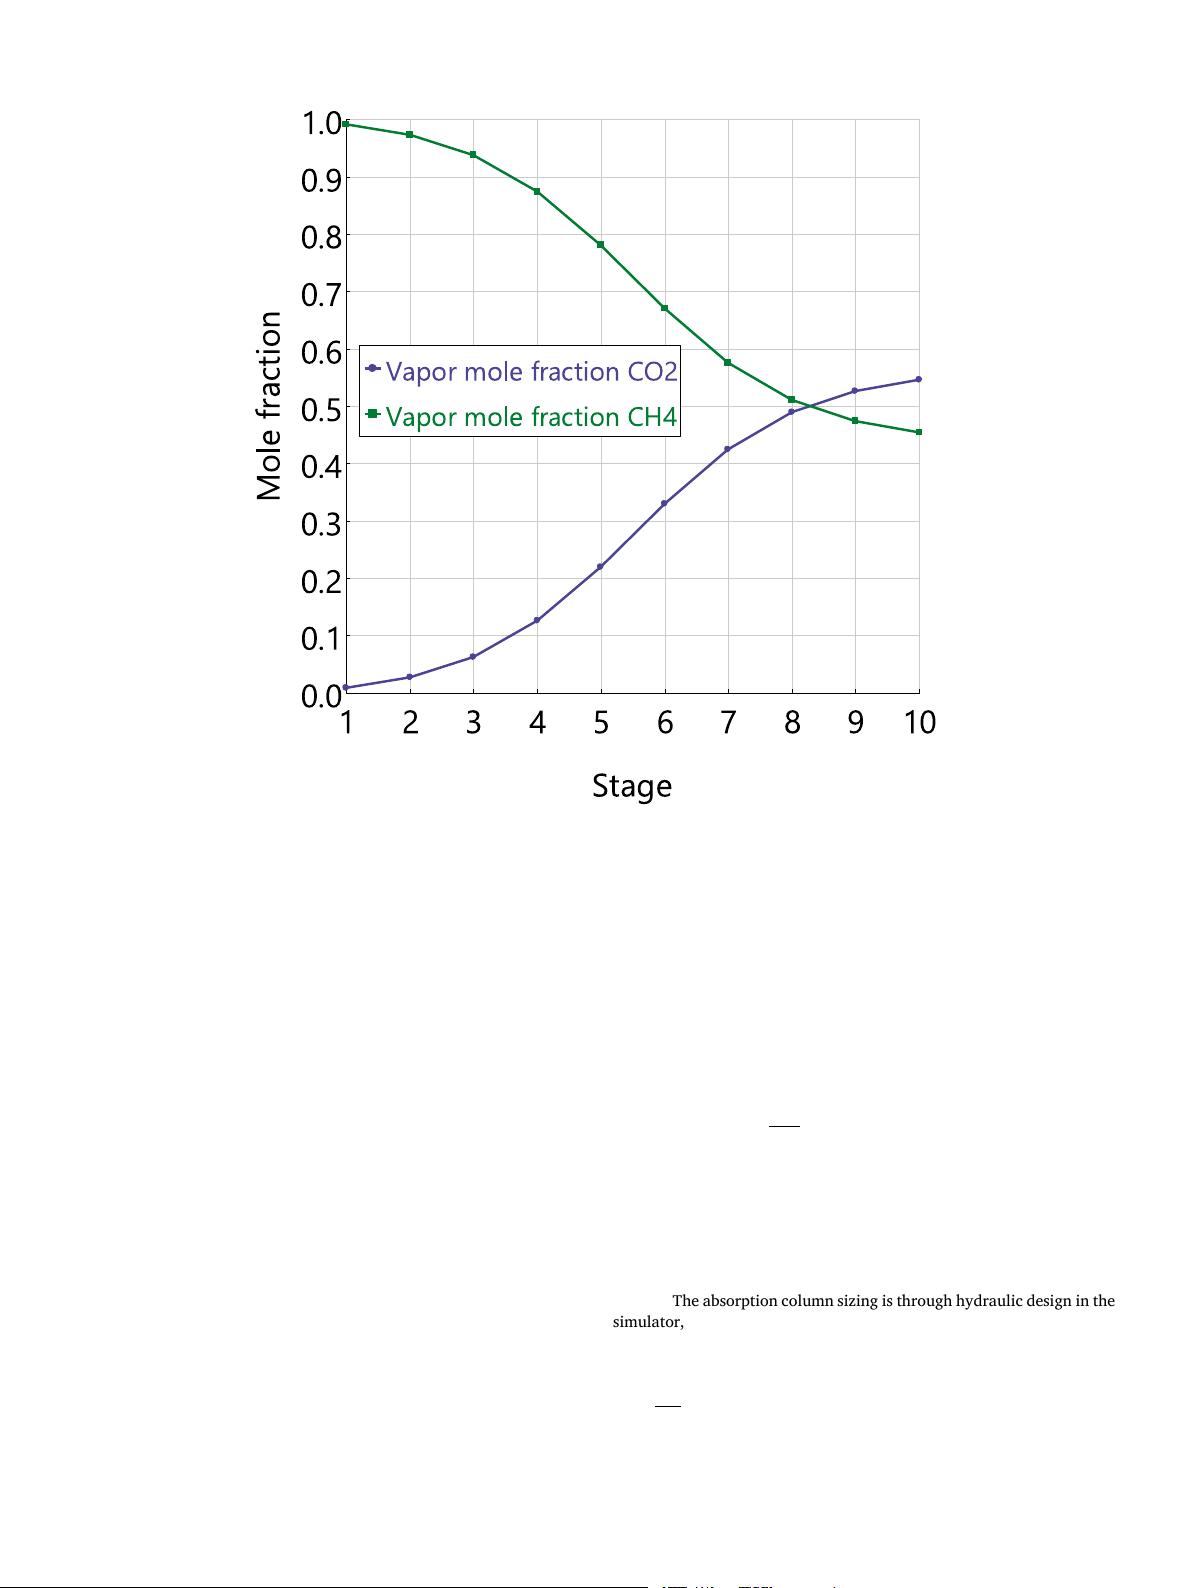
the core equipment. The composition profiles of CO2 and CH4 are shown
operation. The pressure setting of the high-pressure flash tank is not an
together in Fig. 6. In this figure, stage 1 is the top of the column and stage
10 is the column bottom. The CO2 molar fraction decreases from the
bottom to the top while that of CH4 shows the opposite trend. It is also
seen that the CO2 molar fraction at stage 10 is more than 50 %, which is
higher than the feed concentration. This is because CO2 in the recycling
stream is enriched by the high-pressure flashing and it is mixed with the feed biogas.
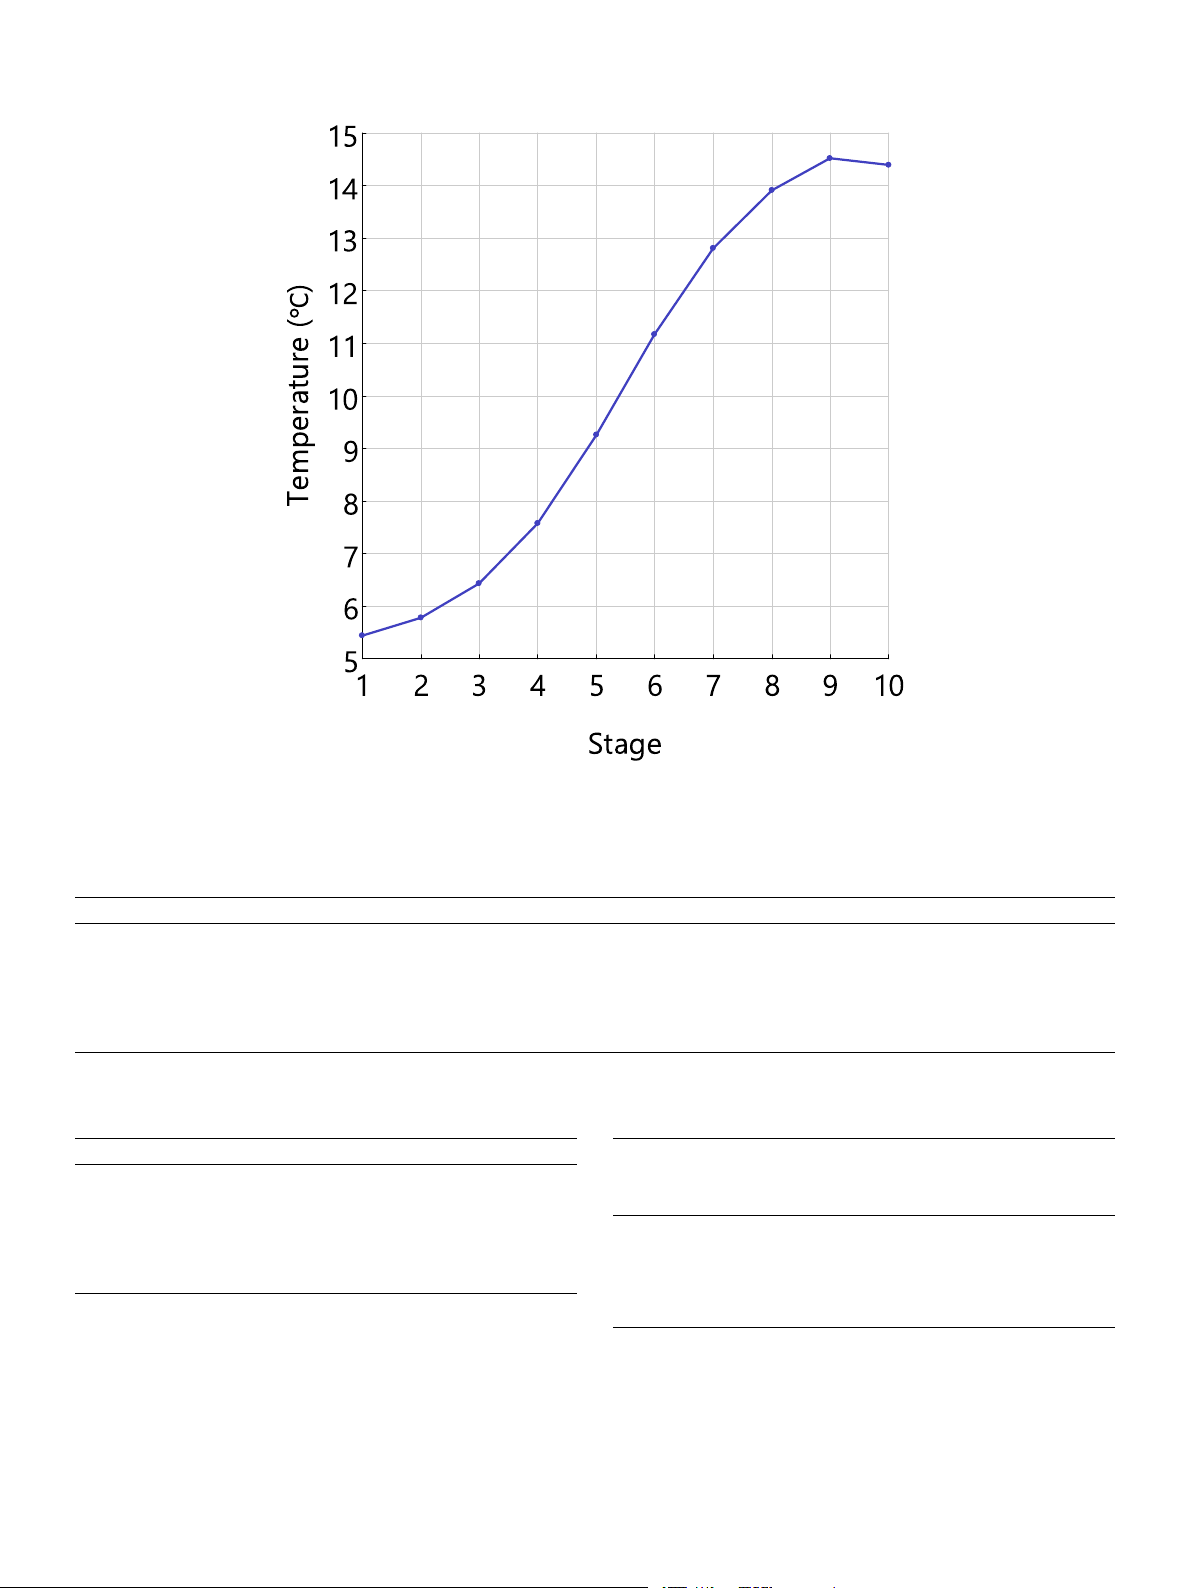
The temperature profile of the column is a critical aspect that re-
quires special attention, as shown in Fig. 7. It is observed that the
temperature of the liquid solvent rises rapidly along the column, from
5.4 to 14.4 ◦C. The temperature rise approaches 9 ◦C. The high ab-
sorption heat is the cause and is estimated according to the heat capacity
and temperature difference, as shown in the Equation. The calculated
absorption heat is − 24 kJ/mol-CO2 and this is significantly higher than
that of most organic solvents by physical absorption such as − 13 kJ/mol
by methanol and − 15.9 kJ/mol by propylene carbonate [12]. C / ΔH
p,IL × ΔTC × nIL abs = − n
≈ − 24 kJ mol − CO2 (4) CO2
The results of the complete process are also obtained and the key
Fig. 3. Selectivity of CO2 and CH4. 4 H. Huang et Energy al. 301 (2024) 131670
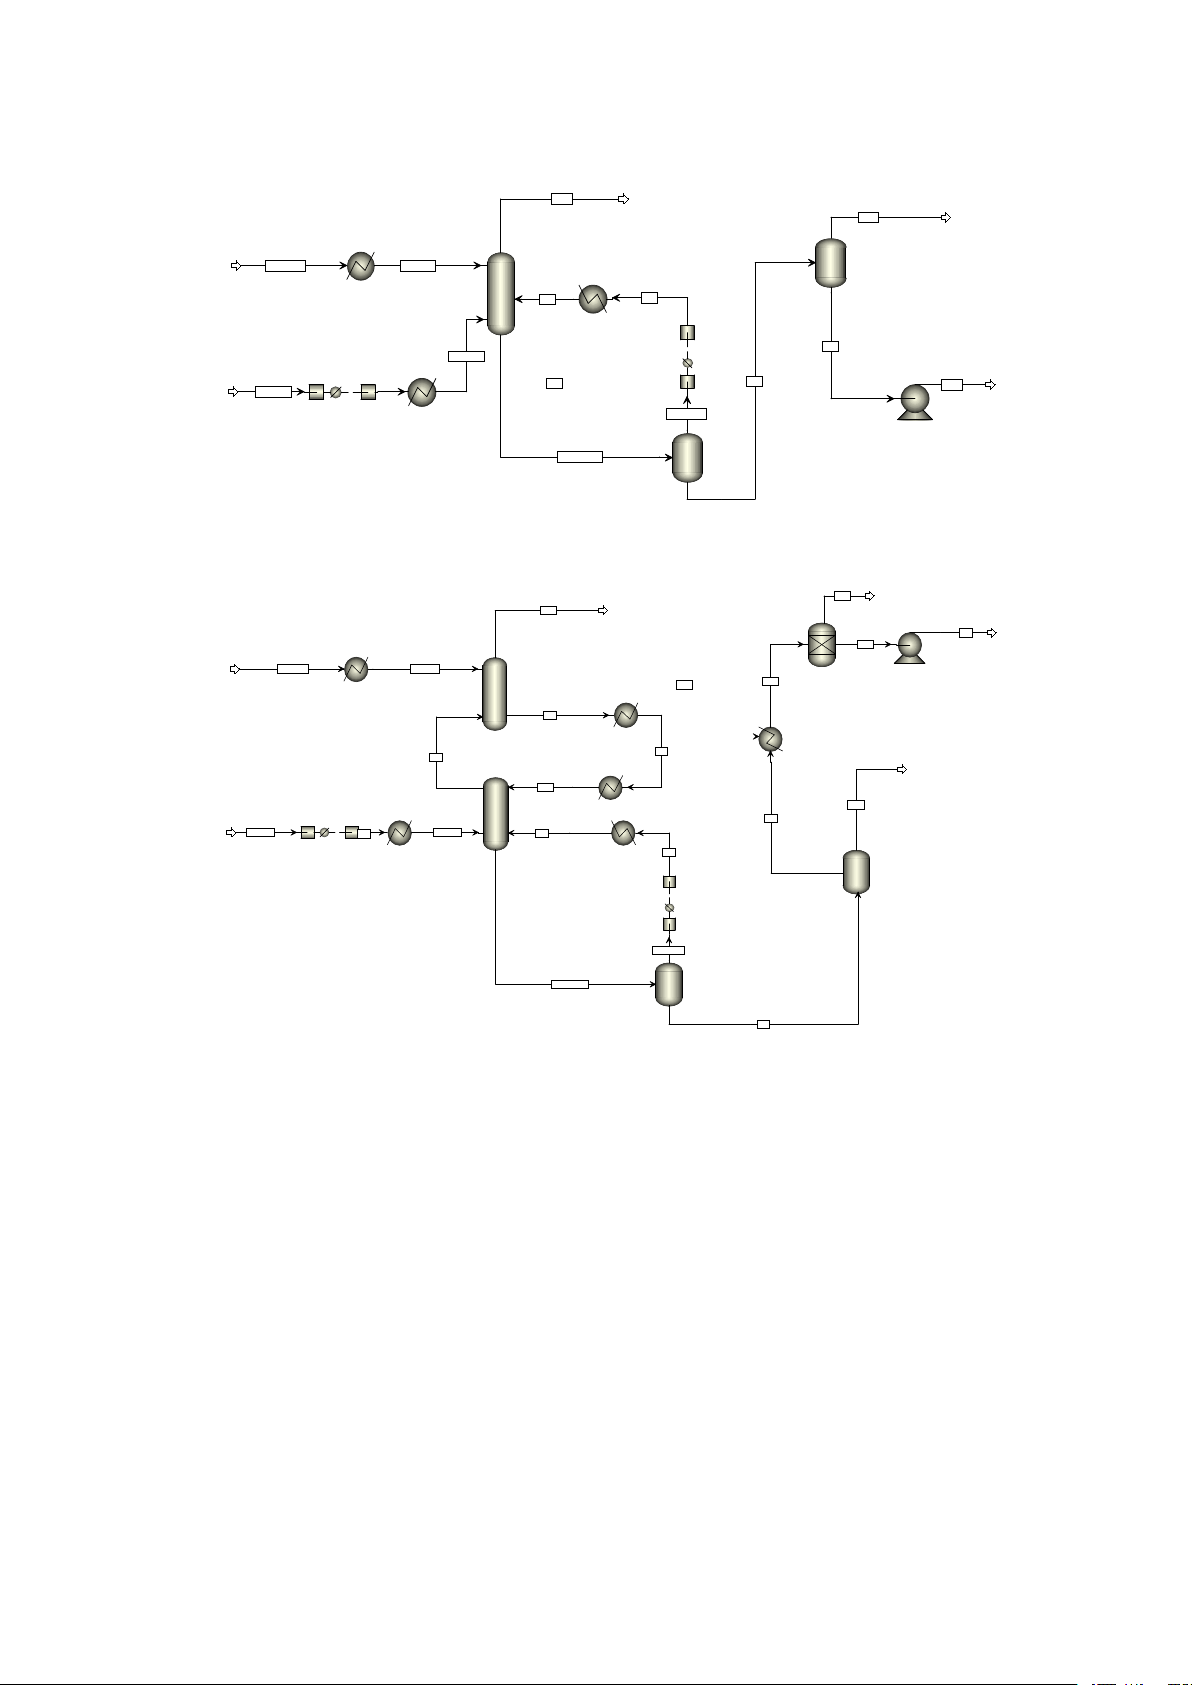
Fig. 4. Process flowsheet of CO2 capture from biogas using [emim][Tf2N].
reducing the overall energy requirements. Furthermore, the specific
capture energy which is the energy consumption per ton of CO2
captured, is determined to be 1.12 GJ/t-CO2. This result aligns with our
expectations and is significantly lower compared to the MEA-based
processes, which typically range from 2.5 to 3.5 GJ/t-CO2, mainly due
to the elimination of thermal regeneration.
As aforementioned, the effects of the absorption pressure and tem-
perature are analyzed. Here we consider two absorption pressures and
temperatures, respectively, and so there are four combinations in total.
Except for the absorption pressure and temperature, the four cases have
the same process designs, and other settings are kept identical to ensure
fair comparisons, except for the high-pressure flash tank pressure as it is
not an independent variable. The final results are directly shown in
Table 6. For cases 1 and 2, they only differ in temperature and the results
suggest that a lower temperature is good for the capture energy, and this
is also true for cases 3 and 4. Comparing cases 1 and 3 or cases 2 and 4 in
a similar way, it is easy to find that reducing the operating pressure
decreases the energy consumption because of the increased CO2 ab-
sorption capacity. Taking all four cases, it seems that reducing the
pressure and temperature could lead to better energy performance.
However, in a study by García-Guti´errez et al. [15] (2016), it was found
that the optimal pressure was 20 bar according to the trade-off between
absorption capacity and compression energy. Another option to consider
is reducing the operating temperature. While lowering the temperature
may seem beneficial in terms of reducing capture energy, it is limited by
Fig. 5. Composition profile of CO2 at the minimum L/G of 2.3, 20 bar and 5 ◦C.
the high viscosity of ionic liquids. Therefore, the challenge becomes
finding ways to enhance energy performance within these constraints. In
streams are placed in Table 4. It is seen that the product purities of CO2
the next section, we will propose a new process by straightforwardly
and CH4 are both higher than 99 mol.% as specified. The CO2 recovery retrofitting the base case.
and CH4 recovery are two important indicators to directly assess the
technical performance of the process. It is defined as the ratio of
2.4.3. Development of a novel process
recovered CO2 and CH4 to the total inputs in the biogas. In this case, the
In this section, we propose a novel process to reduce capture energy
calculated recovery rates are up to 97.2 % for CO2 and 99.5 % for CH4,
while considering the constraints of operating pressure and tempera-
suggesting efficient CO2 capture and biogas upgrading. Additionally, the
ture. It has been found above that the temperature rise in the column is
CO2 recycling rate provides useful information that indirectly reflects
significant, and this inspires us that optimizing the temperature profile
the equipment size and energy demand, which is determined to be 46.1
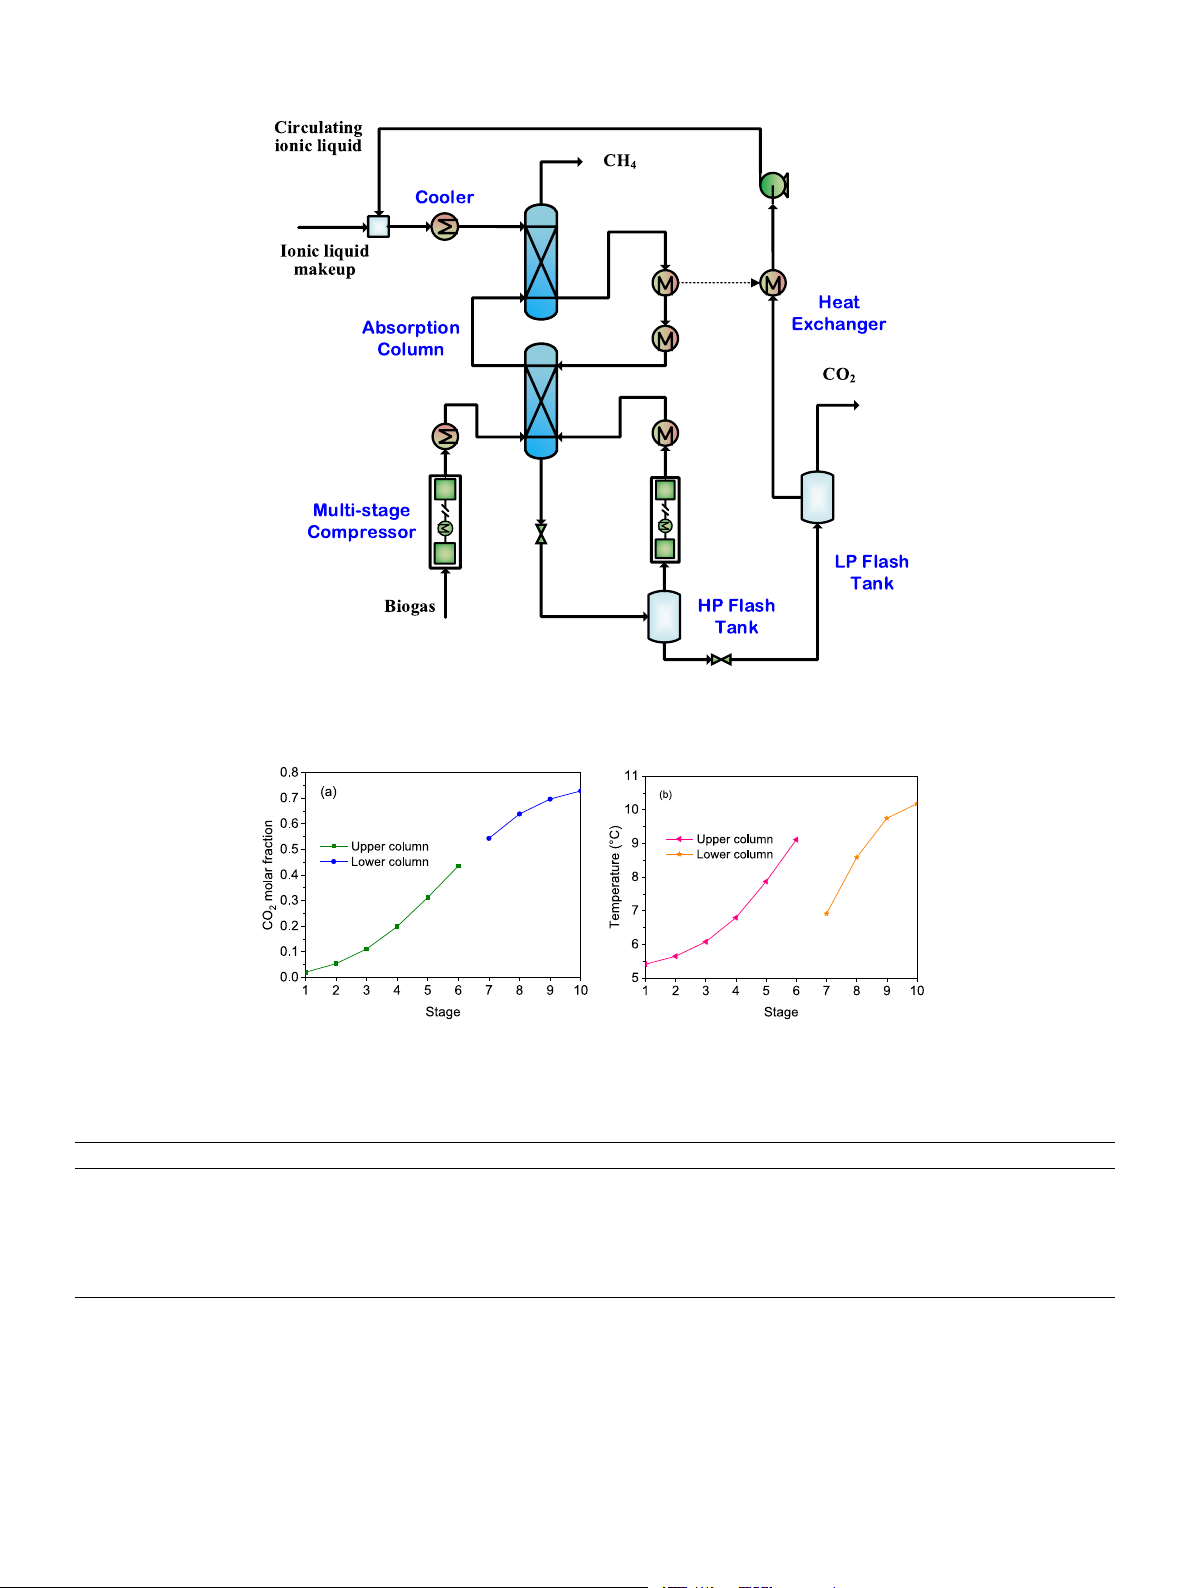
may improve energy performance. To achieve this, we suggest imple- % in this case.
menting a novel intercooling design, as shown in Fig. 8. In this design,
The energy duty of each equipment involved in the process is also
the absorption column is separated into two interconnected columns
obtained and shown in Table 5. The total energy demand is calculated to
with intercooling facilitated by a side stream. The total number of stages
be 532 kW. Among all the equipment, feed compression contributes the
of the two columns remains at 10 (6 + 4) to avoid incurring additional
most, accounting for 63.3 % of the total energy demand. It is worth
costs. To recover the cold energy of the regenerated ionic liquid, a heat
noting that operating at a lower pressure would be advantageous in
exchanger is utilized, making use of the low-pressure flash tank. The 5 H. Huang et Energy al. 301 (2024) 131670
Fig. 6. Composition profiles of CO2 and CH4 in the column at L/G of 2.3, 20 bar and 5 ◦C.
remaining cooling duty is satisfied by an additional cooler. By incor-
(COM). The CAPEX consists of fixed capital investment (FCI) and
porating these modifications, the temperature rise within each column
working capital [21], as shown in Eq. (5). The COM comprises feedstock,
can be effectively controlled within a small range. In all, this new pro-
utility, labor, and other miscellaneous items. To estimate equipment
cess structure offers several advantages, including a reduced demand for
cost, it is crucial to estimate the equipment cost using the module costing
solvent and smaller equipment size.
technique. This approach involves determining the purchased cost of
The CO2 concentration in the two columns is placed together in
equipment under working conditions and considering correction factors
Fig. 9a, compared to the single column, the CO2 molar fraction decreases
such as pressure, construction material, inflation, etc., as depicted in Eq.
more rapidly due to the stronger absorption capacity by the optimized
(6) [21]. The purchased cost of equipment is determined by its charac-
temperature profile, as confirmed in Fig. 9b. In this figure, the bottom
teristic size. For heat exchangers, the characteristic size refers to the
temperature of the lower column is decreased from 14.4 to 10.2 ◦C, and
effective area, while for compressors and pumps, it refers to the power
the temperature rise is 3.7 ◦C in the upper column and 3.3 ◦C in the
input. The characteristic sizes are obtained through process simulations.
lower column, much lower than 9 ◦C in the single column.
The process simulation results of the intercooling process are dis- CAPEX FCI = FCI + WC =
played in Table 7. As observed, the intercooling process yields high- 0.85 (5)
purity products. Besides, the CO2 recycling rate is reduced from 46.1 ∑ n ∑ n
% to 33.6 %. The solvent flowrate is also decreased from 230 to 200 FCI = 1.18 CBM + 0.5 C0BM (6)
kmol/h, resulting in a corresponding decrease in the L/G ratio from 2.3 i=1 i=1
to 2.0. These changes clearly demonstrate the positive effects of where C
implementing the intercooling scheme.
BM is the bare module cost. The superscript 0 represents the base condition.
The energy inventories of the process equipment are given in Table 8.
The characteristic size of the equipment and the cost are shown in
The total power input is reduced from 532 kW to 499 kW, which is
Table 9. The absorption column sizing is through hydraulic design in the
mainly contributed by the reduction of the gas recycling compression
simulator, and the heat exchangers
and the lower feed cooling duty. The specific capture energy is therefore
’ areas are calculated according to
the duty and temperature difference. For the flash tanks, the empirical
reduced to 1.04 GJ/t-CO2, representing a 7.1 % reduction compared to
equation is used for volume sizing [22], shown in Eq. (7).
the original process. Notably, a study by Riva et al., reported an opti-
mized capture energy of 1.4 GJ/t-CO2 using the same ionic liquid and V FL⋅τ = 2⋅ (7)
operating pressure, highlighting the energy superiority of this process. ρL
The economic performance of the process is further evaluated,
considering the capital expenditure (CAPEX) and cost of manufacturing
where FL is the mass flowrate of the liquid stream exiting the flash tank,
ρL is the density and τ is the residence time of 5 min. 6 H. Huang et Energy al. 301 (2024) 131670
Fig. 7. Temperature profile of the column at L/G of 2.3, 20 bar and 5 ◦C. Table 4
Input-output of the base case for some key streams of the process. Item Units Biogas CH4 CO2 CO2 recycling Rich solvent Solvent recycling Temperature ◦ C 30 5.4 5.5 10.1 14.4 6.2 Pressure bar 1 20 0.1 5.4 20 20 Mole Flows kmol/h 100 60.3 38.9 46.1 315.8 230.8 Mole Fractions CO2 40 % 0.92 % 99.25 % 89.80 % 25.59 % 0.36 % CH4 60 % 99.08 % 0.75 % 10.20 % 1.58 % 0 [emim][TF2N] 0 0 0 0 72.83 % 99.64 % Table 5 Table 6
Power consumption and specific capture energy of the process.
Case study at different pressures and temperatures. Item Value Unit Item Absorption Absorption High-pressure Specific Feed cooling 70 kW pressure/bar temperature/◦C flash tank capture Feed compression 337 kW pressure/bar energy GJ/t- Gas recycling cooling 13 kW CO2 Gas recycling compression 61 kW Case 1 20 5 5.4 1.12 Pump 51 kW (base Total 532 kW case) Specific capture energy 1.12 GJ/t-CO2 Case 2 20 15 5.4 1.14 Case 3 30 5 8.1 1.22 Case 4 30 15 7.2 1.31
Among the equipment costs, the compressors occupy the largest part
of the total cost, up to 74 %. This process would perform much better in
scenarios where the pressure of feed gas is high such as pre-combustion [21], as shown in Eq. (8).
capture and syngas purification. The high price of ionic liquid is another
COM = 0.28FCI + 2.73CL + 1.23CU (8)
disadvantage of ionic liquids but its not a big contributor to the total equipment cost.
where CL is the labor cost and CU is the utility cost including power and
Similarly, the COM is obtained by adding each contributing item
refrigeration. The refrigeration cost is estimated using the correlation in 7 H. Huang et Energy al. 301 (2024) 131670
Fig. 8. Flowsheet of the intercooling process.
Fig. 9. CO2 concentration (a); and temperature (b) profiles in the lower and upper columns. Table 7
The materials simulation results of the intercooling process. Item Units Biogas CH4 CO2 CO2 recycling Rich solvent Solvent recycling Temperature ◦ C 30.0 5.4 1.4 6.8 10.2 6.0 Pressure bar 1 20 0.1 6 20 20 Mole Flows kmol/h 100 60.1 39.1 33.6 273.5 200.0 Mole Fractions CO2 40.00 % 0.74 % 99.02 % 86.57 % 25.09 % 0 CH4 60.00 % 99.26 % 0.98 % 13.43 % 1.79 % 0 [emim][TF2N] 0 0 0 0 73.12 % 100.00 % Eq. (9) [23]:
with refrigeration and cooling are minimal due to energy recovery C
measures. The majority of utility demand is attributed to the electricity
refg = exp(2.4647 − 0.01812T(◦C)) (9)
consumed by the compressors. The total COM is calculated to be 2.82
The cost calculation reference year is 2022 with CEPCI of 801.3. The
MM$/a. Among the three contributing parts in Eq. (4), FCI constitutes
utility prices and the annual cost are detailed in Table 10. The prices of
the largest portion, accounting for 65 % of the total. In the FCI, the
utilities, such as industrial electricity and labor costs, are based on
compressor’s cost is the overwhelmingly dominant factor. The com-
surveys conducted in the American market. Notably, the costs associated
pressor’s cost is subject to the operating pressure, and reducing the 8 H. Huang et Energy al. 301 (2024) 131670 Table 8 Table 11
Energy consumption of the intercooling process.
Distributions and parameters for the uncertainty analysis. Item Value Unit Item Distribution Parameter Feed cooling 52 kW Refrigeration Normal Mean: 14.1, Std. Dev. 1.41 Feed compression 337 kW Cooling Normal Mean: 0.38, Std. Dev. 0.04 Gas recycling cooling 25 kW Electricity Normal [30] Mean: 0.07, Std. Dev. 0.01 Gas recycling compression 40 kW Labor Triangular
Min: 70,000, Likeliest: 80,000, Max: 100,000 Pump 45 kW FCI Triangular
Min: 4,569,624, Likeliest: 6,528,034, Max: Total 499 kW [30] 9,792,051 Specific capture energy 1.04 (− 7.1 %) GJ/t-CO2
standard deviations for the normal distributions, the three-sigma (3σ)
rule was applied to obtain the value distributions with a high probability Table 9
of 99.74 % [28]. The expected accuracy of capital investment at the
Characteristic size and cost of the equipment.
stage of the feasibility study can vary from − 30 % to 50 % [29]. Equipment Characteristic size Cost/$
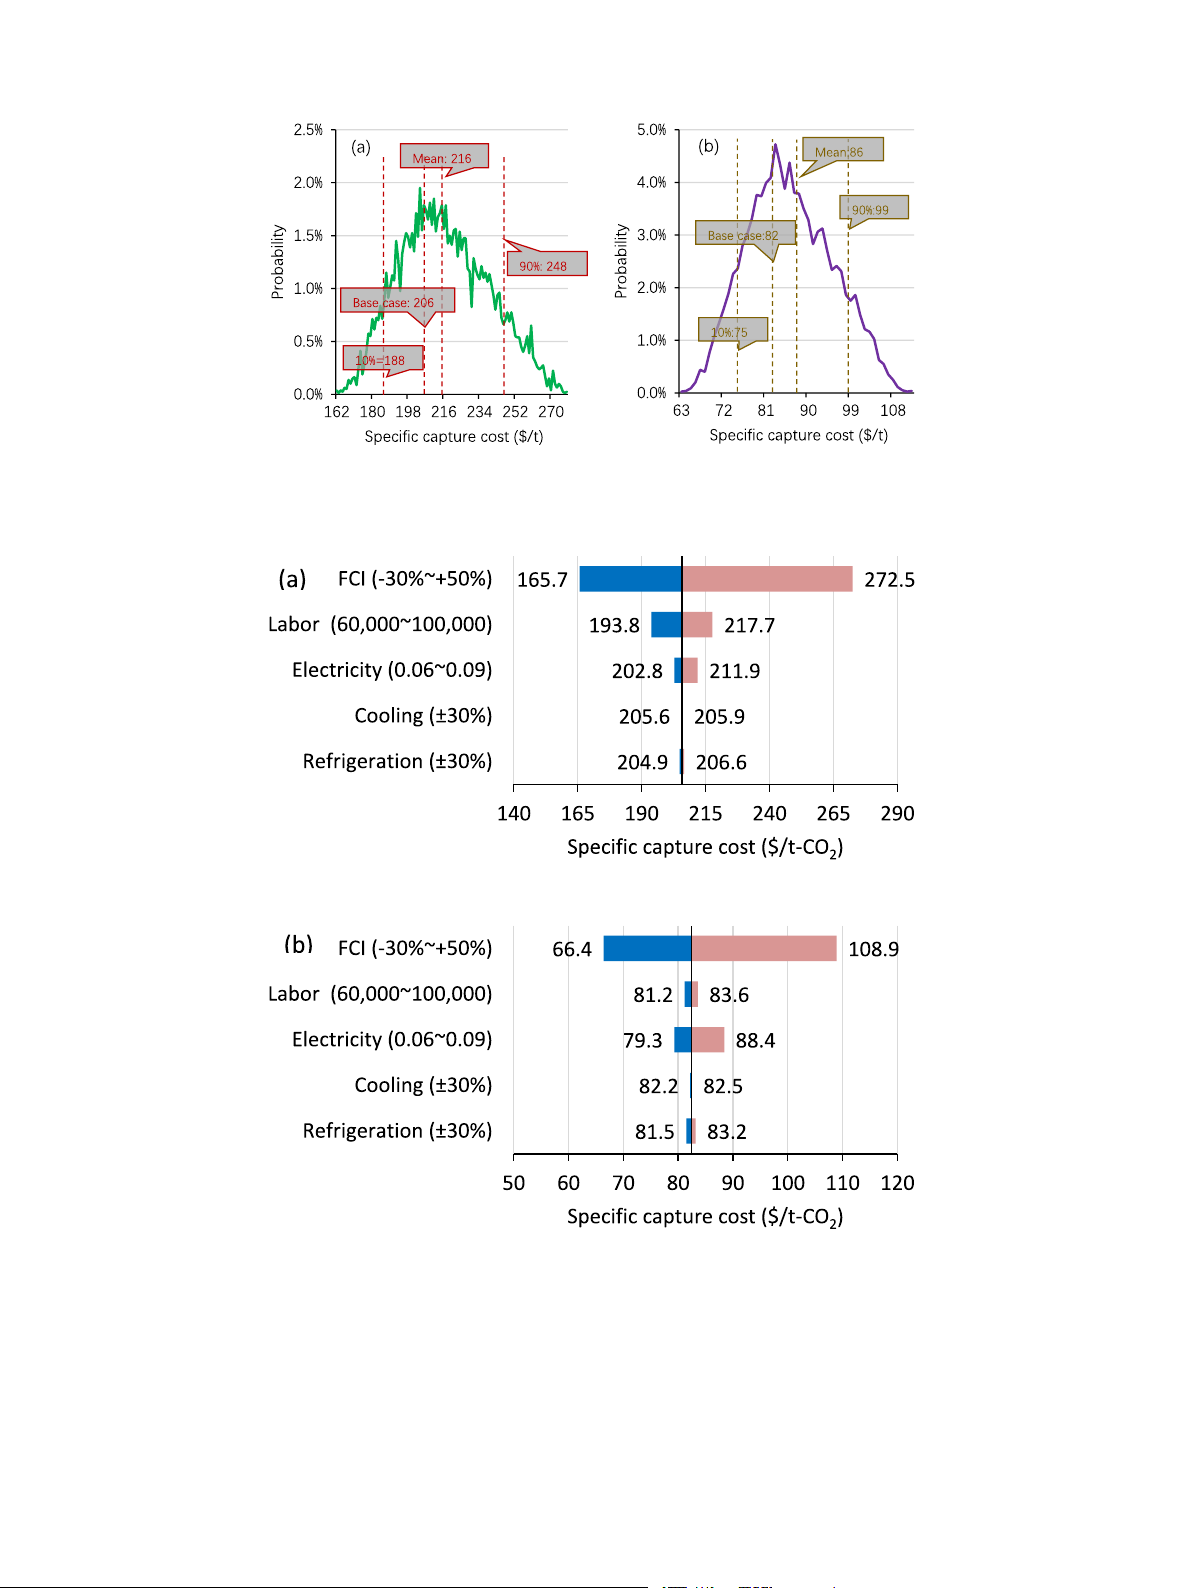
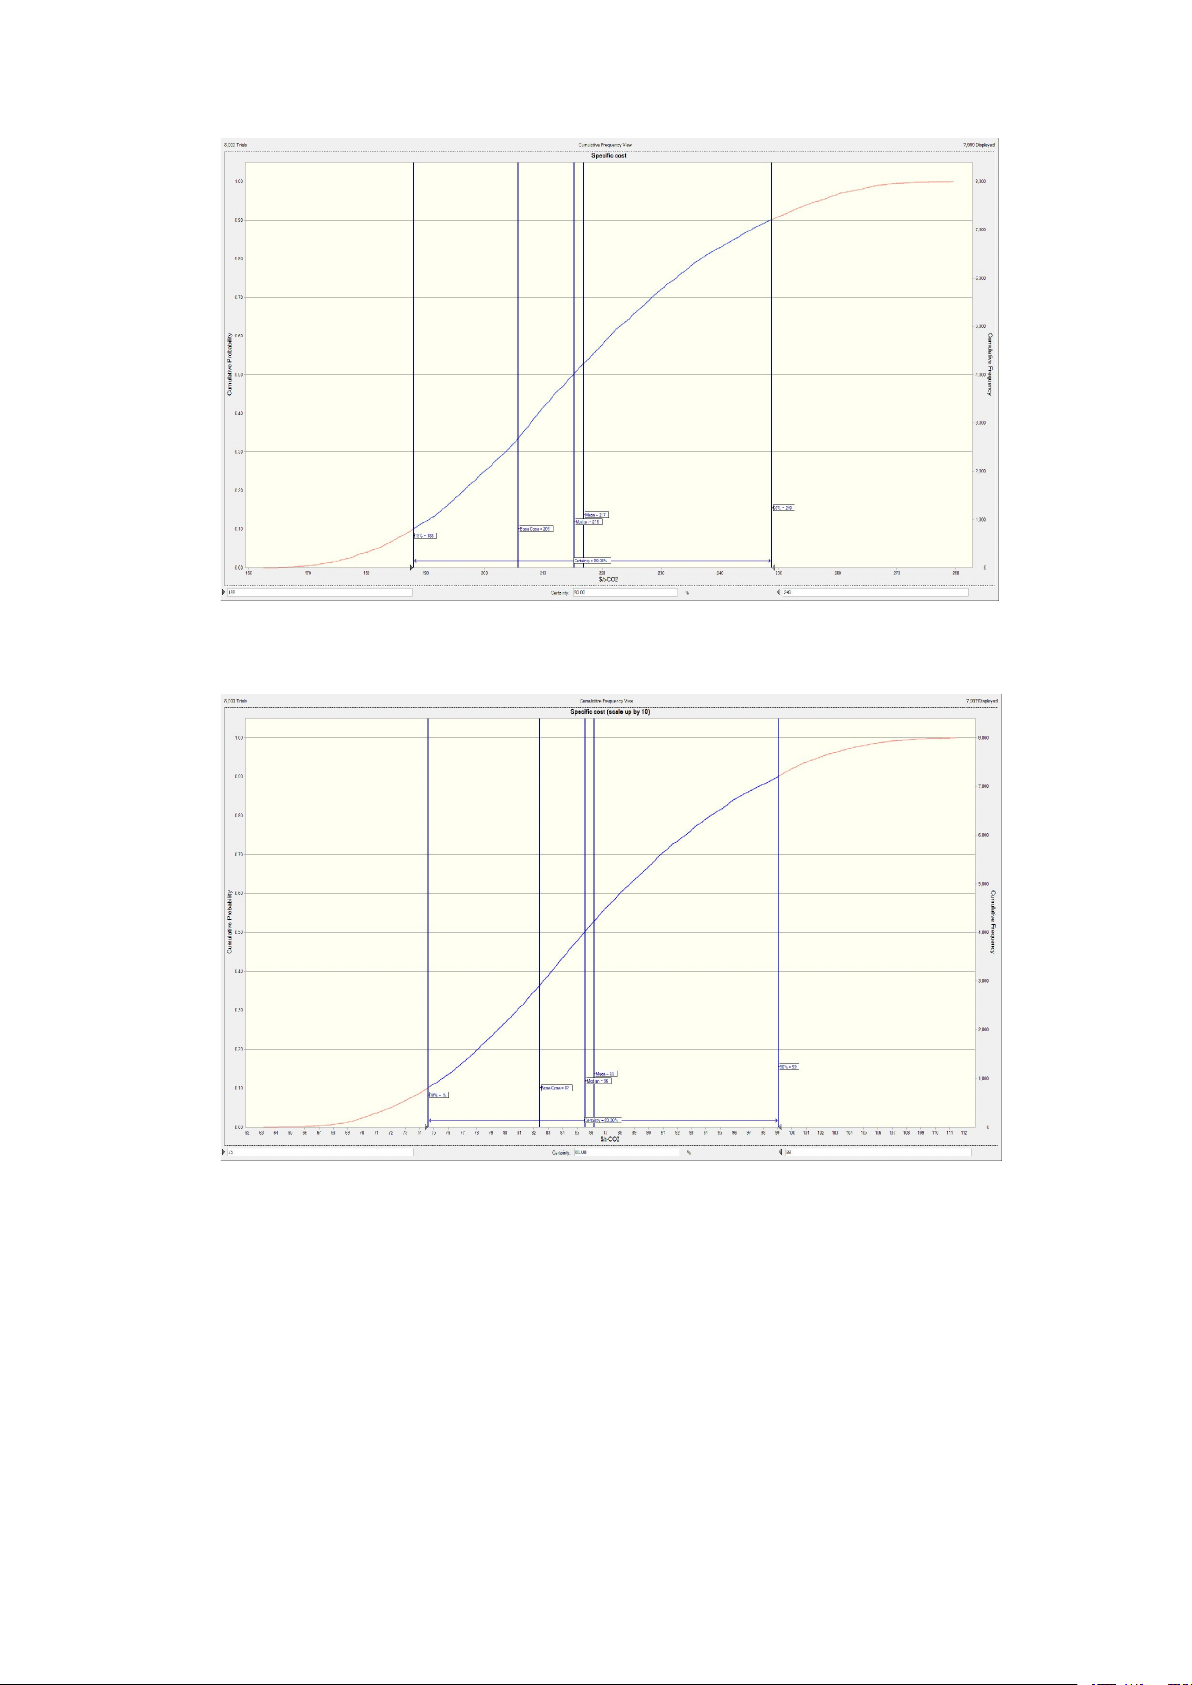
The specific capture cost distribution based on the capacity of Compressor 377 kW 4,832,000
captured CO2 of 13.7 kt/a is displayed in Fig. 10a. The analyses were Heat exchanger 54.4 m2 341,500
performed using the Oracle Crystal Ball with 8000 trials. The primary Pump 45 kW 122,000
finding from the figure reveals a wide distribution of costs, ranging from Column 5.4 m3 264,000 Flash tank 6.0 m3 512,000
188 to 248 $/t (10%–90 % percentile), and a standard deviation of 22 Solvent – 456,000
$/t. In addition, the cumulative frequency depicted in Fig. A3 follows a Total – 6,526,000
typical sigmoid pattern. It is evident that the FCI exerts a dominant in-
fluence on the capture cost, with significant fluctuations. These factors
contribute to the divergent nature of the cost distribution. Additionally, Table 10
the capture cost for the base case is lower than the mean value. The
Utility demand and capture cost of the intercooling process.
fluctuation in electricity prices also has a significant impact on the cost Item Price Unit Annual cost Unit
distribution. According to data from the U.S. Energy Information
Administration [31], the average industrial electricity price was Refrigeration 14.1 $/GJ 31,178 $/a Cooling 0.38 $/GJ 5179 $/a
approximately 0.07 $/kWh before 2022. However, it surged to around Electricity 0.07 $/kWh 236,320 $/a
0.0938 and 0.0882 $/kWh in 2022 and 2023, respectively, thereby Labor 80,000 $/a 240,000 $/a
introducing additional risks to the capture cost in a turbulent environ- Cost of manufacturing (COM) 2,818,442 $/a
ment. The results of the scaled-up case are illustrated in Fig. 10b. In Specific capture cost 206 $/t
comparison to the base case, the capture cost distribution for the
Specific capture cost (scale up by 10) 82 $/t
scaled-up case is narrower and smoother, ranging from 75 to 99 $/t
(10–90 % percentile), with a standard deviation of 9 $/t. This can be
operating pressure can greatly reduce the capital investment. This re-
attributed to the decreased contribution of the FCI to the overall cost of
quires the ionic liquid to have a stronger absorption capacity at a lower
COM, resulting in smaller impacts. This finding suggests that a larger
pressure. A feasible solution is to develop hybrid solvents as many
plant possesses a stronger capability to resist risks.
studies have done [24,25]. The second largest contributor to the COM is
The impacts of the input parameters are also analyzed through
the labor cost, while the utility is the smallest.
sensitivity analysis and the results are displayed by Tornado diagrams in
The specific capture cost is calculated to be 206 $/t. The primary
Fig. 11. These diagrams illustrate the effects of changing one parameter
reason for the high capture cost is the relatively small production scale
at a time while keeping other parameters at their base conditions. The
examined in this study, with only 13.7 kt/a of captured CO2. It should be
range of variation for each parameter is indicated within brackets in the
noted that leveraging economies of scale allows for the dilution of
figure. Comparing the results in Fig. 11a and b, it becomes evident that
equipment costs, resulting in lower specific costs. For example, if the
the FCI is the most influential factor in the capture cost, regardless of the
production capacity is scaled up by 10 times to 137 kt/a, the specific cost
plant scale. However, this is not the case for the parameters of labor and
is anticipated to lower to 82 $/t, in accordance with the six-tenths factor
electricity. For smaller plant scales, the labor cost emerges as the second rule [26].
most significant contributor, while for larger scales, the utility cost of
electricity takes its place. It is important to note that the labor cost
2.4.4. Uncertainty analysis
setting is based on the American market, which has a high economic
In the previous section, the costs associated with CO2 capture were
level. In less developed regions, the significance of labor cost would be
calculated based on fixed input parameters. However, it is important to
much lower. Another noteworthy finding is that increasing the plant
acknowledge that real-world projects are subject to various factors that
scale not only reduces the specific capture cost but also alters the
introduce uncertainties and investment risks. These factors can include
dominance of parameters. In the case of larger plant scales, prioritizing a
idealizations in process simulations and market fluctuations. To address
reduction in FCI becomes crucial for cost reduction. Additionally,
this, uncertainty analysis becomes a valuable tool for quantifying the
achieving better economic performance can be realized by optimizing
influence of input parameters on model outputs with a certain proba-
and intensifying processes to save utility electricity. Overall, the sensi-
bility [27]. In this study, the Monte Carlo method is employed for un-
tivity analysis and Tornado diagrams provide valuable insights into the
certainty analysis, which involves random sampling from the
influence of input parameters on capture cost, highlighting the signifi-
probability distribution of input parameters to estimate the distribution
cance of FCI, labor cost, and utility electricity, while also considering the
of output parameters. In this way, we can provide a more comprehensive
impact of plant scale and regional economic factors.
understanding of the potential risks and uncertainties associated with the CO2 capture process. 3. Conclusions
In the uncertainty analysis, the input parameters considered include
the costs of refrigeration, labor, and electricity as well as the FCI, and the
In this study, our objective was to minimize the energy consumption
output is the specific capture cost. The distributions and parameters are
of ionic liquids for CO2 capture, pushing it to the lowest achievable level
shown in Table 11. In the absence of real-world data to calculate the 9 H. Huang et Energy al. 301 (2024) 131670
Fig. 10. Distributions of the specific capture cost of the base case (a); and the case scaled up by 10 (b).
Fig. 11. Sensitivity analysis of specific capture cost with captured CO2 of 13.7 kt/a (a) and 137 kt/a (b).
to date. For this purpose, [emim][Tf2N] was identified as an ideal sol-
were employed to obtain material and energy balances for performance
vent for CO2 capture due to its high absorption capacity and low vis-
analysis and benchmarking. The specific capture energy for the base
cosity among the potential ionic liquid candidates. The temperature-
case was determined to be 1.12 GJ/t-CO2. Case studies revealed that the
dependent properties of [emim][Tf2N] were calculated and compared.
lowest energy consumption was achieved at lower pressures and tem-
Using the NRTL-RK model, the solubility of CO2 and CH4 was pre-
peratures. However, it was observed that further reducing the operating
dicted and validated with experimental data. The process analysis began
pressure may not improve energy performance due to the higher
with the design of a basic process for CO2 capture from biogas, serving as
compression energy required, and lowering the operating temperature is
a benchmark for subsequent case studies. Rigorous process simulations
limited by the viscosity of the solvent. To overcome these constraints, a 10 H. Huang et Energy al. 301 (2024) 131670
novel process was developed by fine-tuning the temperature profile,
interests or personal relationships that could have appeared to influence
dividing the column into two sections, and implementing intercooling to
the work reported in this paper.
remove the heat released during gas absorption. The intercooling pro-
cess proved advantageous, as it reduced the solvent flow rate and gas Data availability
recycling rate without significantly increasing costs. As a result, the
specific capture energy was reduced from 1.12 to 1.04 GJ/t-CO2.
Data will be made available on request.
The economic performance was also analyzed, specifically in terms
of the specific CO2 capture cost. For a production scale of 13.7 kt/a, the Acknowledgements
specific capture cost was calculated to be 206 $/t-CO2. Notably, the cost
of compressors accounted for the largest portion of the total equipment
This study has no external funding.
cost and the specific capture cost. Scaling up the process to 137 kt/a
decreased the specific capture cost to 82 $/t-CO2, primarily due to
Appendix A. Supplementary data
economies of scale. Additionally, uncertainty analysis demonstrated
that the scaled-up case exhibited a narrower distribution of capture cost
Supplementary data to this article can be found online at https://doi.
and greater resilience to risks. It is worth noting that the operating
org/10.1016/j.energy.2024.131670.
pressure remains a key factor limiting both energy and cost reductions.
Therefore, future research should focus on exploring alternative ap- References
proaches to address this bottleneck and further enhance the efficiency of CO2 capture processes.
[1] Mondal MK, Balsora HK, Varshney P. Progress and trends in CO2 capture/
separation technologies: a review. Energy 2012;46(1):431–41.
[2] Aghel B, Janati S, Wongwises S, Shadloo MS. Review on CO2 capture by blended Nomenclature
amine solutions. Int J Greenh Gas Control 2022;119.
[3] Kwak NS, Lee JH, Lee IY, Jang KR, Shim JG. A study of the CO2 capture pilot plant
by amine absorption. Energy 2012;47(1):41–6. Abbreviations
[4] Ma T, Wang J, Du Z, Abdeltawab AA, Al-Enizi AM, Chen X, et al. A process CAPEX capital expenditure
simulation study of CO 2 capture by ionic liquids. Int J Greenh Gas Control 2017; COM cost of manufacturing 58:223–31.
[5] Basha OM, Keller MJ, Luebke DR, Resnik KP, Morsi BI. Development of a FCI fixed capital investment
conceptual process for selective CO2 capture from fuel gas streams using [hmim] MEA monoethanolamine
[Tf2N] ionic liquid as a physical solvent. Energy Fuel 2013;27(7):3905–17. MW molecular weight
[6] Wang Y, Liu X, Kraslawski A, Gao J, Cui P. A novel process design for CO2 capture
and H2S removal from the syngas using ionic liquid. J Clean Prod 2019;213: WC working capital 480–90.
[7] Zubeir LF, Lacroix MHM, Meuldijk J, Kroon MC, Kiss AA. Novel pressure and Symbols
temperature swing processes for CO2 capture using low viscosity ionic liquids. Sep
Purif Technol 2018;204:314–27. a, b
coefficient of henry’s constant or the binary interaction
[8] Xie Y, Zhang Y, Lu X, Ji X. Energy consumption analysis for CO2 separation using parameter
imidazolium-based ionic liquids. Appl Energy 2014;136:325–35. C
[9] Ma C, Wang N, Ye N, Ji X. CO2 capture using ionic liquid-based hybrid solvents L labor cost
from experiment to process evaluation. Appl Energy 2021;304. CU utility cost
[10] Hospital-Benito D, Lemus J, Moya C, Santiago R, Ferro VR, Palomar J. Techno- Cp heat capacity, kJ/(mol K)
economic feasibility of ionic liquids-based CO2 chemical capture processes. Chem G Eng J 2021;407:127196. ij interaction energy
[11] Moya C, Santiago R, Hospital-Benito D, Lemus J, Palomar J. Design of biogas L/G molar ratio of liquid to gas
upgrading processes based on ionic liquids. Chem Eng J 2022;428:132103. n molar flowrate, kmol/h
[12] Ramdin M, de Loos TW, Vlugt TJH. State-of-the-Art of CO2 capture with ionic p
liquids. Ind Eng Chem Res 2012;51(24):8149–77. c critical pressure, MPa
[13] Palomar J, Larriba M, Lemus J, Moreno D, Santiago R, Moya C, et al. S selectivity
Demonstrating the key role of kinetics over thermodynamics in the selection of Tc critical temperature, K
ionic liquids for CO2 physical absorption. Sep Purif Technol 2019;213:578–86. V
[14] de Riva J, Suarez-Reyes J, Moreno D, Díaz I, Ferro V, Palomar J. Ionic liquids for c critical volume, m3/kmol x
post-combustion CO 2 capture by physical absorption: thermodynamic, kinetic and i
molar fraction in the liquid phase
process analysis. Int J Greenh Gas Control 2017;61:61–70. yi
molar fraction in the gas phase
[15] García-Guti´errez P, Jacquemin J, McCrellis C, Dimitriou I, Taylor SFR, Hardacre C, Z compressibility factor
et al. Techno-economic feasibility of selective CO2 capture processes from biogas
streams using ionic liquids as physical absorbents. Energy Fuel 2016;30(6): 5052–64. Greek letters
[16] Finotello A, Bara JE, Camper D, Noble RD. Room-temperature ionic liquids:
temperature dependence of gas solubility selectivity. Ind Eng Chem Res 2008;47 ρ density, kg/m3 (10):3453–9. τ
binary interaction parameter or residence time, min
[17] Liu XY, Afzal W, Prausnitz JM. Solubilities of small hydrocarbons in φ
tetrabutylphosphonium bis(2,4,4-trimethylpentyl) phosphinate and in 1-Ethyl-3- i fugacity, MPa
methylimidazolium bis(trifluoromethylsulfonyl)imide. Ind Eng Chem Res 2013;52 αij non-random factor (42):14975–8. γi activity coefficient
[18] Chen Y, Liu X, Woodley JM, Kontogeorgis GM. Gas solubility in ionic liquids:
UNIFAC-IL model extension. Ind Eng Chem Res 2020;59(38):16805–21.
CRediT authorship contribution statement
[19] Kim YS, Choi WY, Jang JH, Yoo KP, Lee CS. Solubility measurement and prediction
of carbon dioxide in ionic liquids. Fluid Phase Equil 2005;228–229:439–45.
[20] Schilderman AM, Raeissi S, Peters CJ. Solubility of carbon dioxide in the ionic
Hong Huang: Writing – original draft, Software, Methodology,
liquid 1-ethyl-3-methylimidazolium bis(trifluoromethylsulfonyl)imide. Fluid Phase
Formal analysis, Data curation, Conceptualization. Ralf Peters: Writing Equil 2007;260(1):19–22.
[21] Turton R, Bailie RC, Whiting WB, Shaeiwitz JA. Analysis, synthesis, and design of
– review & editin. Remzi Can Samsun: Writing – review & editi. Detlef
chemical processes. third ed. ed. Pearson Education, Inc.; 2009.
Stolten: Supervisio. Chang He: Writing – review & editing, Methodol-
[22] Biegler LT, Grossmann IE, Westerberg AW. Systematic methods of chemical process
ogy. Xiantai Zhou: Supervision. design. 1997.
[23] Luyben WL. Estimating refrigeration costs at cryogenic temperatures. Comput Chem Eng 2017;103:144–50.
Declaration of competing interest
[24] Taheri M, Dai C, Lei Z. CO2 capture by methanol, ionic liquid, and their binary
mixtures: experiments, modeling, and process simulation. AIChE J 2018;64(6): 2168–80.
The authors declare that they have no known competing financial 11 H. Huang et Energy al. 301 (2024) 131670
[25] Wang N, Ma C, Ye N, Ji X. CO2 separation from biogas with ionic liquid-based
[29] Schemme S, Breuer JL, K¨oller M, Meschede S, Walman F, Samsun RC, et al. H2-
hybrid solvents: from properties to process, vol. 298. Sep Purif Technol; 2022.
based synthetic fuels: a techno-economic comparison of alcohol, ether and
[26] Peters MS, Timmerhaus KD, West RE. Plant design and economics for chemical
hydrocarbon production. Int J Hydrogen Energy 2020;45(8):5395–414. engineers. 2002. Fifth ed.
[30] Li B, Ou L, Dang Q, Meyer P, Jones S, Brown R, et al. Techno-economic and
[27] van der Spek M, Fout T, Garcia M, Kuncheekanna VN, Matuszewski M, McCoy S,
uncertainty analysis of in situ and ex situ fast pyrolysis for biofuel production.
et al. Uncertainty analysis in the techno-economic assessment of CO2 capture and
Bioresour Technol 2015;196:49–56.
storage technologies. Critical review and guidelines for use. Int J Greenh Gas
[31] U.S. Energy Information Administration. https://www.eia.gov/electricity/monthl Control 2020;100.
y/epm_table_grapher.php?t=epmt_5_6_a.
[28] Dimitriou I, Goldingay H, Bridgwater AV. Techno-economic and uncertainty
analysis of Biomass to Liquid (BTL) systems for transport fuel production. Renew
Sustain Energy Rev 2018;88:160–75. 12 Supplementary information
A Novel Process for CO2 Capture Using Ionic Liquids
with Ultra-low Energy Consumption
Hong Huang a, Ralf Peters b,f, Remzi Can Samsun b, Detlef Stolten c,d,e, Chang He*a, and Xiantai Zhou*a
a School of Chemical Engineering and Technology, Sun Yat-sen University, Zhuhai, 519082, China
b Electrochemical Process Engineering (IEK-14), Forschungszentrum Jülich GmbH, Jülich, 52425, Germany
c Techno-Economic Systems Analysis (IEK-3), Forschungszentrum Jülich GmbH, 52425, Jülich, Germany
d JARA-ENERGY, 52056 Aachen, Germany
e Chair for Fuel Cells, RWTH Aachen University, 52072, Aachen, Germany
f Synthetic Fuels, Chair of Carbon Sources and Conversion, Ruhr Universität Bochum, 44780 Bochum, Germany
E-mail address: hechang6@mail.sysu.edu.cn; zhouxtai@mail.sysu.edu.cn CH4 CO2 LP B3 ABS SOLVENT SOL-IN B6 S5 S4 B5 S7 GAS-IN B1 B2 B4 S1 S2 REC BIOGAS CO2-CH4 HP SOL-RICH
Fig. A.1 Process simulation of the base case in Aspen Plus S13 CH4 B9 B4 S3 S12 B3 ABS-1 SOLVENT SOL-IN S11 S14 B10 S9 B11 S8 S6 ABS-2 S10 INT-COOL CO2 B1 B2 S7 B6 BIOGAS S1 GAS-IN S5 LP S4 B5 CO2-CH4 HP SOL-RICH S2
Fig. A.2 Process simulation of the intercooling process in Aspen Plus
Table A.1 The UNIFAC model parameters for the CO2-CH4-[emim][Tf2N] system (Chen et al., 2020). Group Group Group Parameter CH4 [emim] [Tf2N] GMUFR 1.129 2.8482 5.7738 GMUFQ 1.124 1.714 4.932
Table A.2 Group-group interaction parameters in the UNIFAC model (Chen et al., 2020). Group j Group j Group j Group i CH4 [emim] [Tf2N] CH4 0 93.491 -50.479 [emim] 629.359 0 0 [Tf2N] 192.23 0 0
Chen, Y., Liu, X., Woodley, J.M., Kontogeorgis, G.M., 2020. Gas Solubility in Ionic Liquids: UNIFAC-
IL Model Extension. Ind. Eng. Chem. Res. 59(38), 16805-16821.
Fig. A.3 Cumulative frequency curve of the base case with 13.7 kt CO2 captured.
Fig. A.4 Cumulative frequency curve of the scaled-up case with 137 kt CO2 captured. Calculation of equipment cost
The equipment cost calculations are based on the module costing technique using the equations below: 0 C C B B F F BM p 1 2 M P log C
K K log ( )
A K log ( ) A p 2 0 10 1 2 10 3 10
log F C C log ( )
A C log ( ) A p 2 10 1 2 10 3 10
where CBM is the bare module cost, 0
C is the cost at ambient pressure using the correlation p
above, FM is the material factor, and Fp is pressure factor. The coefficients can be found in the
reference by Turton et al [1].
[1] Turton R, Bailie RC, Whiting WB, Shaeiwitz JA. Analysis, Synthesis, and Design of Chemical
Processes. Third Edition ed: Pearson Education, Inc., 2009.
Document Outline
- A novel intercooling carbon dioxide capture process using ionic liquids with ultra-low energy consumption
- 1 Introduction
- 2 Process design and analysis
- 2.1 Ionic liquid selection
- 2.2 Physical properties
- 2.3 Thermodynamic modeling
- 2.4 Process simulation and case study
- 2.4.1 Process description and simulation technique
- 2.4.2 Material and energy balances
- 2.4.3 Development of a novel process
- 2.4.4 Uncertainty analysis
- 3 Conclusions
- Nomenclature
- CRediT authorship contribution statement
- Declaration of competing interest
- Data availability
- Acknowledgements
- Appendix A Supplementary data
- References
Tài liệu liên quan:
-

Ung dung game hoa trong cac chien dich MKT
17 9 -

Bao cao Chi so TMDT Viet Nam 2025
15 8 -

Thông tư quy định về việc phân quyền, phân cấp và phân định thẩm quyền quản lý nhà nước về giáo dục cho chính quyền địa phương
22 11 -
Nghị quyết về phát huy các giá trị di sản văn hóa gắn với phát triên du lịch bền vững tỉnh Khánh Hòa đến năm 2025, định hướng đến năm 2030
12 6 -

Quyết định phê duyệt Chiến lược phát triển du lịch Việt Nam đến năm 2030
12 6