A web-based tunneling-induced buildingyutility damage assessmentsystem: TURISK
A web-based tunneling-induced buildingyutility damage assessmentsystem: TURISK. Tài liệu được sưu tầm giúp bạn tham khảo, ôn tập và đạt kết quả cao. Mời bạn đọc đón xem.
Môn: Tài liệu Tổng hợp 3.6 K tài liệu
Trường: Tài liệu khác 3.9 K tài liệu
Tác giả:


Preview text:
Tunnelling and Underground Space Technology 18 (2003) 497–511
A web-based tunneling-induced buildingyutility damage assessment system: TURISK
Chungsik Yooa,*, Jae-Hoon Kimb Department a
of Civil and Environmental Engineering, Sungkyunkwan University, 300 Chun-Chun Dong, Jan-An Gu, Suwon,
Kyong-Gi Do 440-746, South Korea
bDepartment of Civil and Environmental Engineering, Sungkyunkwan University, 300 Chun-Chun Dong, Jan-An Gu, Suwon,
Kyong-Gi Do 440-746, South Korea
Received 1 October 2002; received in revised form 15 March 2003; accepted 15 March 2003 Abstract
Prediction of ground movements and assessment of risk of damage to adjacent buildingsyutilities have become an essential part
of the planning, design, and construction of a tunneling project in urban environments. A web-based tunneling-induced buildingy
utility damage assessment system, named TURISK, was developed. Currently available first order methods were implemented in
TURISK for prediction of tunneling-induced ground movements and assessment of damage to adjacent buildingsyutilities.
TURISK was written in a server-client internet environment using the Microsoft Visual Basic 6.0 in conjunction with the
MapGuide ActiveX Control software. The developed system was then implemented to the Daegu Metro Subway Line 2
construction site. The results demonstrated that the developed web-based buildingyutility assessment system can be used as an
efficient tool in the perspective of tunneling-induced settlement risk management for tunneling projects in urban areas. Practical
significance of tunneling-induced settlement risk assessment is also discussed.
䊚 2003 Elsevier Science Ltd. All rights reserved.
Keywords: Tunneling; Ground movement; Risk assessment; Building damage; Cast iron pipe; Internet 1. Introduction
therefore devoted to prevent the ground movements
associated with it. In this regard, prediction of ground
Due to rapid growth in urban development there has
movements and assessment of the risk of damage to
been a pressing need for construction of new tunnels
adjacent buildingsyutilities has become an essential part
for transportation systems and underground utilities.
of the planning, design and construction of a tunneling
Tunneling hasbecome an attractive alternative in creat-
project in the urban environments.
ing underground spaces for the transportation and utility
Tunnelling-induced settlement risk assessment needs
networks. An ever-increasing awareness of the environ-
to be conducted during initial design aswell asconstruc- ment hasals
o given a favor to tunneling over other
tion stages. During the initial design stage, the first-
construction alternatives. During tunneling, changes in
order simplified procedure outlined by Peck (1969) and
the state of stress in the ground mass around the tunnel
O’Reilly and New (1982) and extended by New and
and subsequent ground losses inevitably occur. These O’Reilly (1991), isus ually adopted to predict the
changes in the stress and ground losses are realized at
magnitude and extent of ground movements associated
the ground surface as a form of ground surface move-
with the proposed tunneling. The predicted magnitude
ments, which eventually impose strains onto nearby
and extent of the ground movementsare then used to
buildingsyutilities through translation, rotation, distor-
assess the potential damage to adjacent buildings and
tion and possibly damage. A substantial portion of the
utilities, again, using simplified approaches (Boscardin
cost of a tunneling project in the urban environments is
and Cording, 1987; Burland, 1995). When damage is
likely to occur, either modificationsto the initial design
or protective measures for the buildings and utilities are
*Corresponding author. Tel.: q82-31-290-7518; fax: q82-31-290- 7549.
provided. A second round of assessment is performed
E-mail address: csyoo@yurim.skku.ac.kr (C. Yoo).
during construction using measured settlement data as
0886-7798/03/$ - see front matter 䊚 2003 Elsevier Science Ltd. All rights reserved.
doi:10.1016/S0886-7798(03)00067-1 498
C. Yoo, J.-H. Kim / Tunnelling and Underground Space Technology 18 (2003) 497–511
well asnewly obtained information, and correctionsare
In the above equations, Vs isthe volume of the
made to the initial assessment, if necessary.
settlement trough per unit distance of tunnel advance
In urban tunneling, which involvesa large number of
and i isthe inflection point defining the form and span
buildings and utilities, the previously described tunnel-
of the settlement trough on the assumption that the
ing-induced settlement risk assessment process may
semi-transverse (y-axis) settlement profile can be
require a considerable amount of computational effort
described by a normal probability equation. xi and xf
and therefore may be better suited in a computer-based
are the tunnel start point and the tunnel face position,
environment. Furthermore, the assessment process using
respectively, along the tunnel axis (ys0). G(a) can be
monitored data needsto be carried out on a real-time
determined from a standard probability table. n isthe
basis so that the decision making process regarding the
power of (zo–z) to which i isproportional and isusually
damage assessment does not hamper the tunnel construc-
assumed to be unity. Note that zo and z are the depth to
tion process. A web-based system with an efficient
tunnel center and the depth of settlement trough under
graphic-user-interface (GUI) isdes irable in order to
consideration. Respective ground strains can be obtained
effectively handle such a process. The GIS-based sys-
by taking derivativesof the above equationsasEqs .
tems such as those by Netzel and Kaalberg (1999) and (4)–(6).
Kimmance et al. (1999) were developed to facilitate the
process of construction risk management. w 2 z ynV y s y
In view of this, for better and efficient tunneling- ´ s expx | z 2
induced settlement risk assessment, a web-based tunnel- y 2i ~ y2piŽz y o z.
ing-induced buildingyutility damage assessment system S w 2 z y T y B E 1 xyx Žxyx . i
(TURISK) wasdeveloped and implemented to the i = C F x exp | U T 2
Daegu Metro Subway Line 2 construction site in Korea. D i G y 2i ~ V y2p
The developed system employs currently available first- w 2 z y B E xyx Žxyx . i
order simplified approaches for prediction of ground f C y F x exp | 2 i
movements and assessment of risk of damage to adjacent D G y 2i ~
buildingsyutilities. On-line computing concept was W 2 w z B E B E B E y xyxi xyx T f x |
employed in TURISK so that any authorized user can q y y X C F 1 C G F C G F 2 T (4) D i Gy D i G D i G~
have access to the system and perform an assessment Y
through the World Wide Web. In thispaper, the concept
and details of the system are described. An illustrative 2 B E n y ´ s y C w y1F 2 (5)
example on the field application of the developed system z y o z D i G is also presented. w 2 z y
2. Ground movements and buildingyutility damage nV y s y ´ s expx | x assessment 2 y 2i ~ y2piŽz y o z. S w 2 z
2.1. Ground movements and strains y B T E xyx Žxyx . i i U = C T F x exp | 2 D i G y 2i ~ V
In the developed system, the ground displacements w 2 W z
and associated strains for a given tunneling are calcu- y B E xyx Žxyx . i T f C y F x X exp | 2 T (6)
lated based on the procedure outlined by Peck (1969) D i G y 2i ~Y
and New and O’Reilly (1991). The vertical settlement
and horizontal displacements at any point on a deform-
It iswell known that the ground displacementsand
ing ground are calculated using Eqs. (1)–(3).
respective ground strains are significantly influenced by
the way in which the inflection point isselected. There w 2 zS B E B W E V y T xyx xyx T s i f x U | y X ws exp y
are several equations available for estimating the inflec- T C G F C G FT 2 (1) y 2i V ~ D i G D i GY y2pi
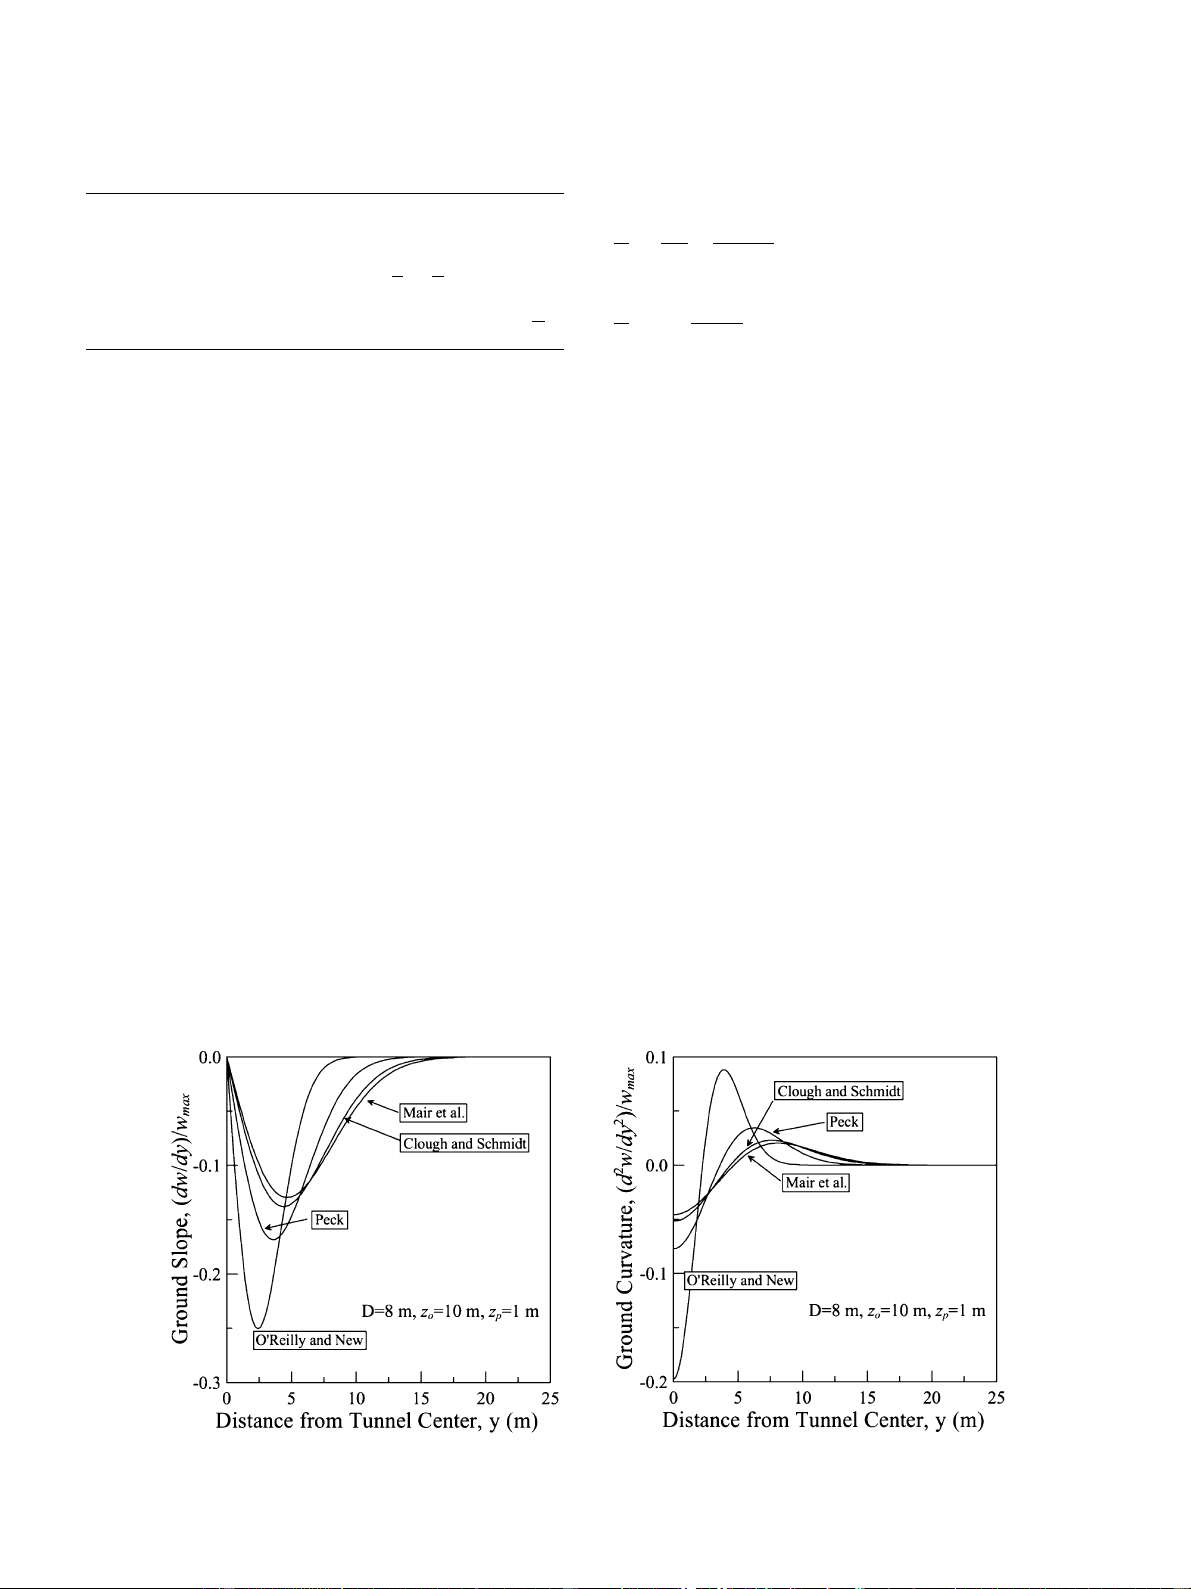
tion point astabulated in Table 1. Fig. 1 comparesthe
normalized ground slope and curvature curves generated yn vs yw (2)
using the various equations for the inflection point listed z y o z
in Table 1 for an 8-m-diameter circular tunnel. It isseen
that the normalized ground slope and curvature curves w 2 z nVs y
significantly vary with which equation is used for the us exp y x | 2 2p z y
inflection point. The equation by O’Reilly and New o z y 2i ~ Ž .
(1982) tends to yield the most conservative results S w 2 z w 2 zW y T Žxyx y . i Žxyx . f T
whereasthat by Clough and Schmidt U = x exp | (1981) the least y x X T exp |T 2 2 (3) V y 2i ~ y 2i Y ~
conservative results. An equation for the inflection point
C. Yoo, J.-H. Kim / Tunnelling and Underground Space Technology 18 (2003) 497–511 499 Table 1
´d are likely to occur at the center and quarter span
Variousequationsfor inflection point points, respectively. Peck (1969)
is0.2(Dqzo) O’Reilly and New (1982) is0.43(z y o z) for clay S W D T L 3IE T is0.28(z y U s q X T ´ T b (7) o z)y0.1 for sand 0.8 D Bz L V 12t 2tLHG Y o E is C = F Clough and Schmidt (1981) 2 DDG w z B z E 2 S W D T HL G T isz x o 0.175q C 0.325 1y F| U s X 1q T ´ T d (8) Mair et al. (1993) y D zoG~ L V 18IE Y
In Eqs. (7) and (8), D isa maximum deflection of
should therefore be selected with due consideration of
the building, H isthe height of building, L isthe length local experiencess uch asworkmans hip and ground
of the building (but limited by any point of inflection
condition, among others. In TURISK, a user can either
or extent of settlement trough), E and G are, respectively,
directly select an equation for the inflection point or
Young’smodulusand shear modulusof the building, I
utilize measured settlement data, if available, to deter-
isthe second moment of inertia of the equivalent beam,
mine the location of inflection point. When using the
and t is the furthest distance from the neutral axis to the
measured data, TURISK automatically computes the
edge of the beam (i.e. Hy2 in the sagging zone and H
maximum settlement wmax and the inflection point i
in the hogging zone). For masonry structures which are
from a plot of the logarithm of the original recorded
the most damage-susceptible, the ratio of EyG isoften
settlements (log w) vs. the square of (y2) of the
taken as 2.6, which is consistent with an isotropic
transverse distance. Maximum settlement (wmax) can
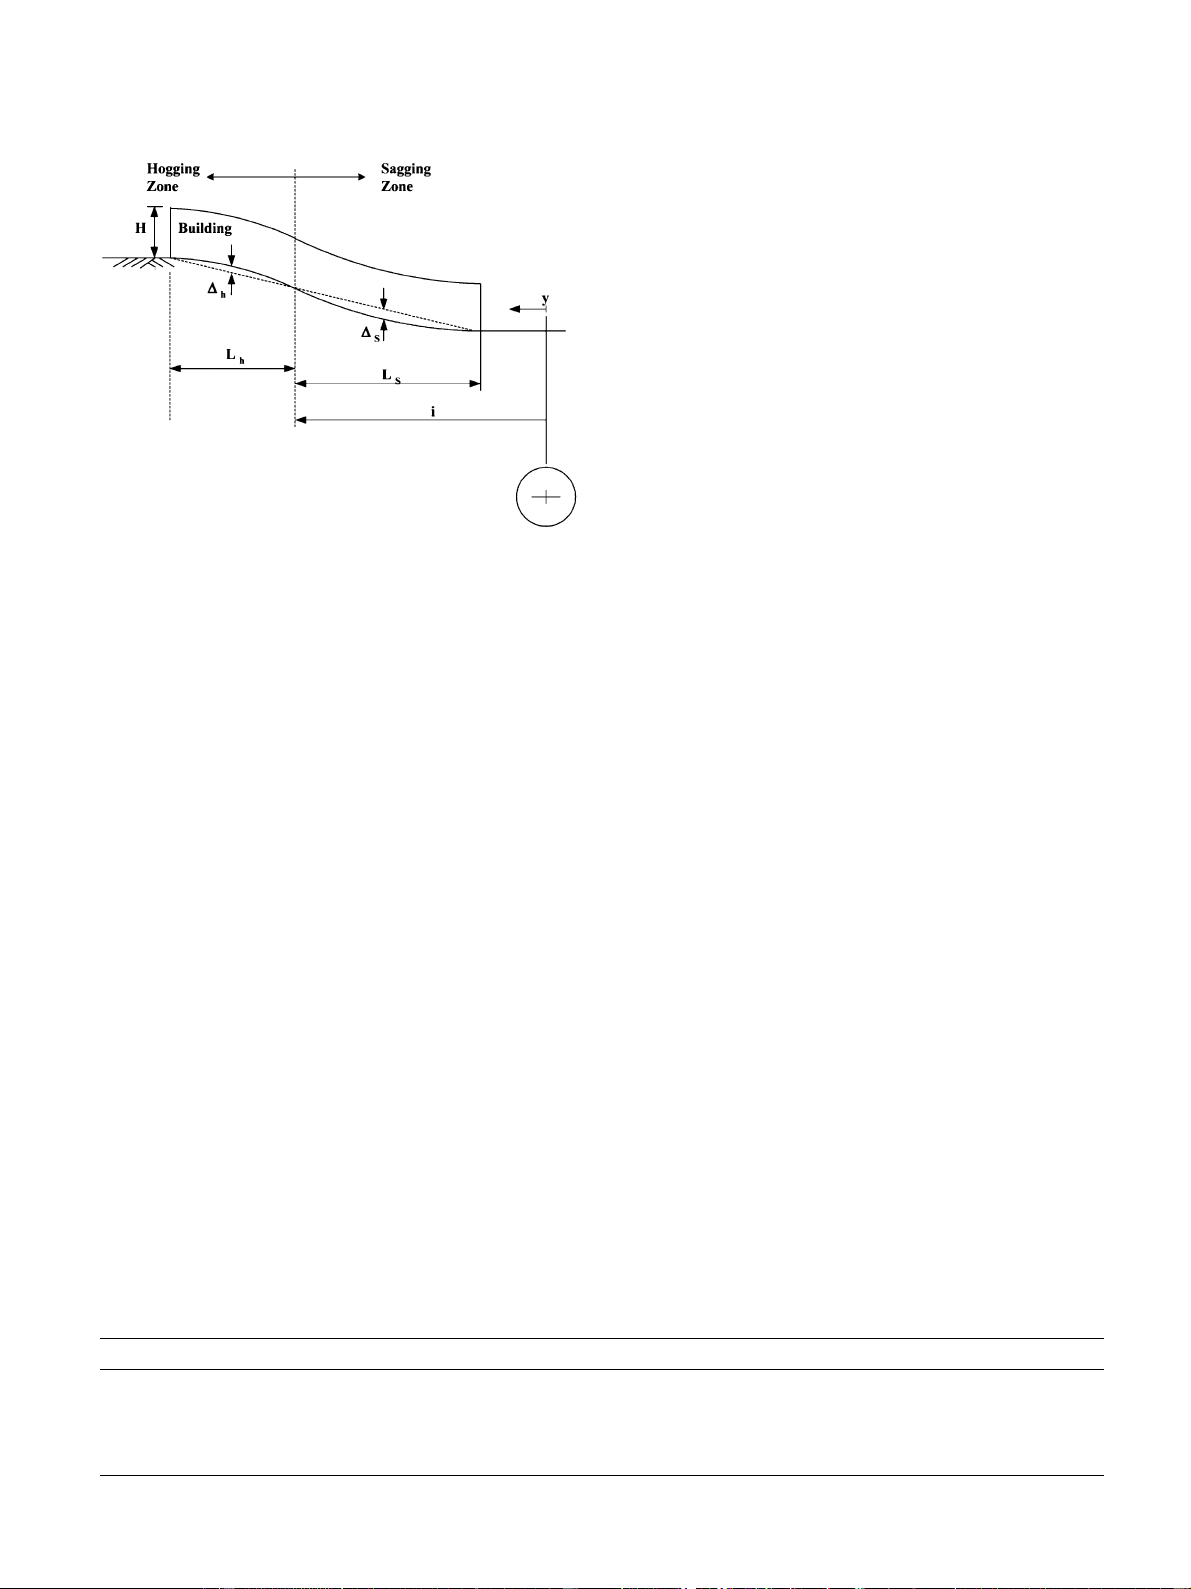
Poisson’s ratio of ns0.3. A typical example of a
then be defined by the intercept of the regression line
building affected by a single tunnel settlement trough is
with the axis y2s0, and the value of i by the fact that shown in Fig. 2.
i2 isthe value of y2 where wyw s max 0.606.
Both transverse and longitudinal sections are evalu-
ated for possible damage. Horizontal strain (´h), which
2.2. Building damage assessment
isof particular concern in tunneling, iscalculated asthe
average horizontal strain across a section of the building
A first order building damage assessment procedure
based on the horizontal displacements across the build-
proposed by Burland (1995) wasimplemented in TUR-
ing using Eq. (2) and Eq. (3) for the transverse and
ISK, in which a building istreated asan idealized deep
longitudinal sections, respectively. The average horizon-
beam with span L and height H deforming under a
tal strain is then combined with the bending and diagonal
central point load. Bending strain (´b) and diagonal
strains obtained from Eq. (7) and Eq. (8) asEq. (9)
shear strain (´d) developed in a building subjected to
and Eq. (10) to give maximum bending strain (´bt) and
tunneling-induced ground movementsare calculated
diagonal shear strain (´dt). The potential damage isthen
using Eqs. (7) and (8), respectively. Note that ´b and
assessed using either ´bt or ´ , dt whichever isgreater.
Fig. 1. Comparison of ground slopes and curvatures using various equations of inflection point. 500
C. Yoo, J.-H. Kim / Tunnelling and Underground Space Technology 18 (2003) 497–511
category particularly for brickwork or masonry is given
in Table 3, which wasfirst put forward by Burland et al. (1977).
Although the procedure implemented in TURISK is
more appropriate to brick or masonry structures, rein-
forced concrete frame structures on shallow foundations
can also be evaluated using the same methodology.
Note, however, that a lager EyG value of 12.5 isoften
used for the reinforced concrete frame structures rather
than 2.6 used for masonry structures with due consid-
eration of their flexibility in shear.
2.3. Utility damage assessment
During urban tunneling, utility pipelinesburied at
shallow depths are also subjected to a wave of ground
movements. Due to the difficulties involved in obtaining
Fig. 2. Building deformation associated with tunneling-induced
detailed information asto the condition of the pipelines ground settlement.
and jointing details, sophisticated analyses are of little
practical value at least during an initial assessment stage.
Although the ground–building interaction altersthe
In view of this, the simplified procedure proposed by
ground movement patternsat the building base level, no
Bracegirdle et al. (1996) and recently extended by Yoo
such an effect was considered. Such a simplified
(2001) were adopted in TURISK. The procedure adopt-
approach is justified here, since TURISK is developed
ed in TURISK employsthe green field ground displace-
for use in a first-order damage assessment stage. The
mentsto compute pipe strainsand joint rotationypullout
soil–structure interaction effect should be taken into
considering the worst scenario in terms of the location
consideration in a more elaborate second round of
and stiffness of pipe joints. For example, pipelines are
damage assessment for buildings and utilities evaluated
assumed to deform with the ground and no consideration
being at risk. More detailed description of the method
istaken of the actual location of jointsbetween the
adopted in TURISK isavailable elsewhere (Yoo, 2001).
individual pipes. Also assumed is that joints are located
at the most unfavorable position with no resistance ´ s
against rotation and slip. The procedure outlined below bt ´ q h ´b (9) ismore appropriate to cas t and ductile iron pipesfor
water and gas mains, which are considered to be the w 2 z0.5 2 x | ´ s dt 0.35´ q h Ž y 0.65´ q h. ´d~ (10)
most damage-susceptible. Details of the method adopted
in TURISK are given in subsequent paragraphs.
The limiting tensile strain (´lim) approach suggested
by Burland et al. (1977) wasadopted to relate computed
2.3.1. Joint rotation and pullout
strain to a damage level, which drew work on the
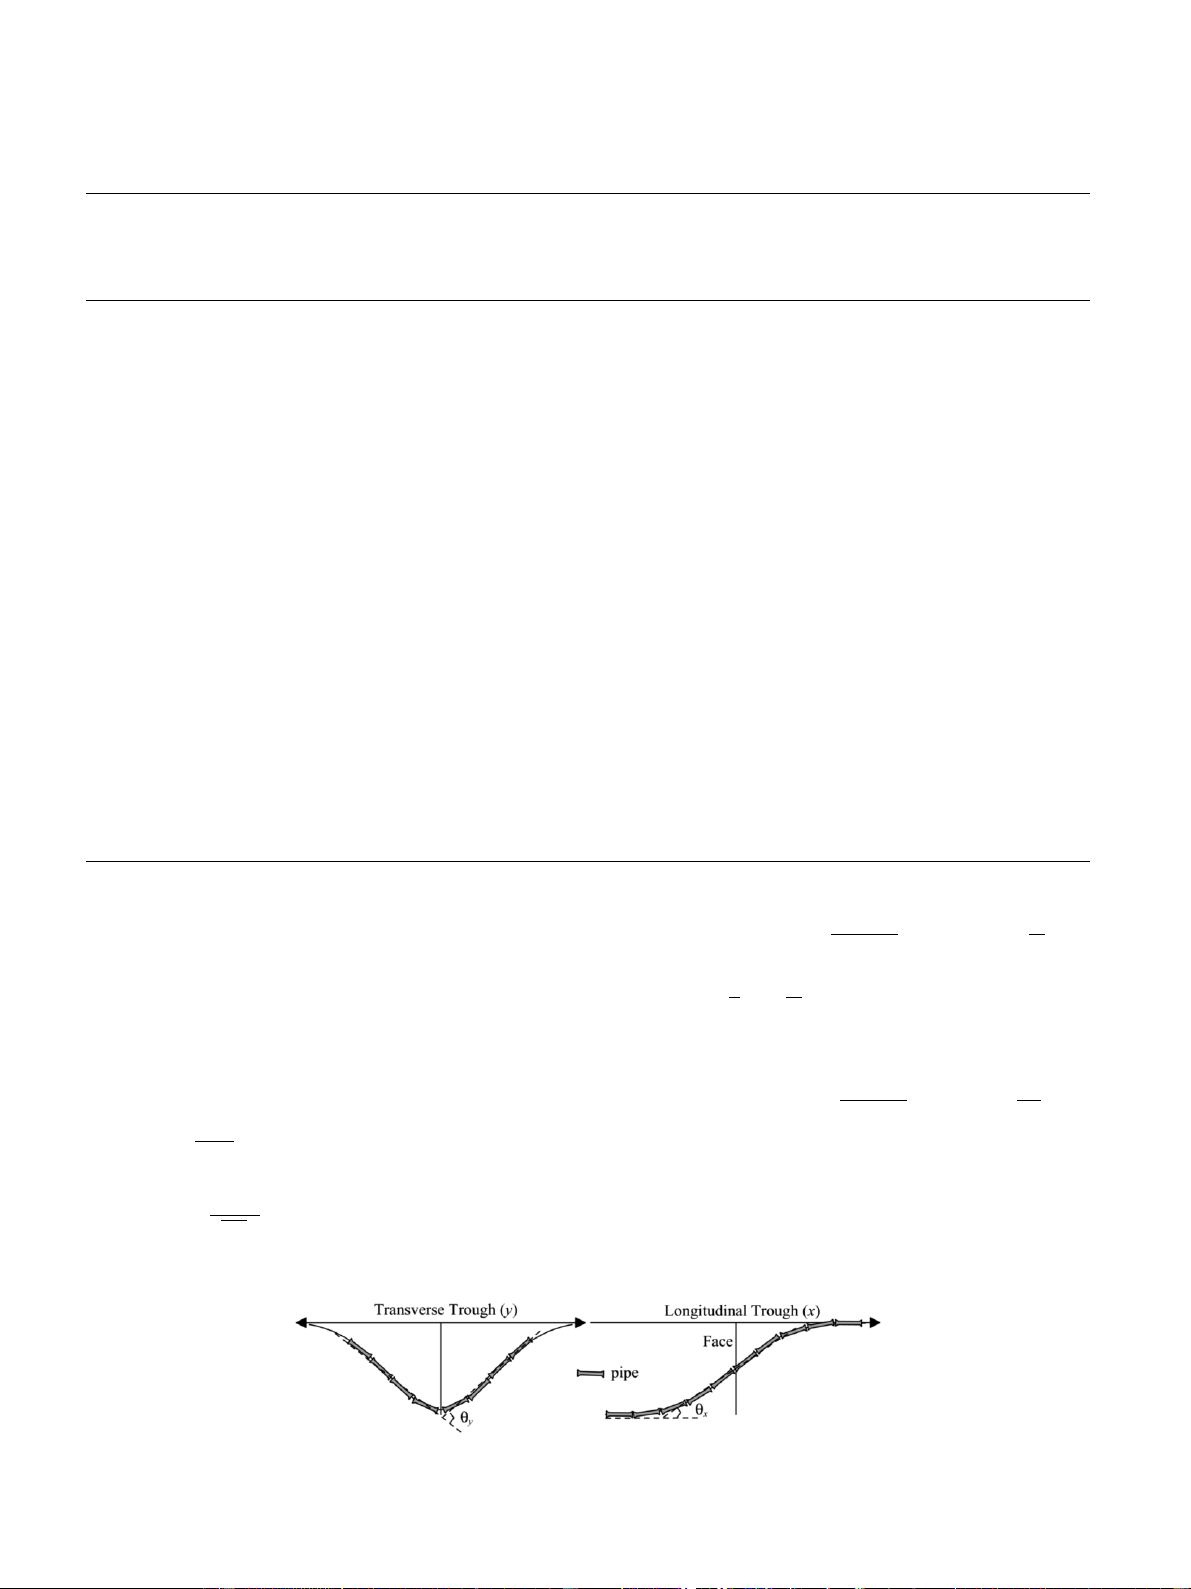
Joint rotations (ux, uy) for pipesparallel and trans-
concept of ‘critical tensile strain’, as a fundamental
verse to the tunnel axis, as illustrated in Fig. 3, can be
parameter determining the onset of cracking, proposed
computed using Eq. (11) and Eq. (12), respectively,
by Burland and Wroth (1974). The relationship between
assuming the worst conceivable configuration of joints.
the damage categoriesand the rangesof limiting tensile
Similarly, maximum potential pullouts (Rx, Ry) can be
strain in Table 2 proposed by Boscardin and Cording
approximated asthe maximum relative horizontal dis -
(1987) was used to directly relate a calculated tensile
placementsbetween two adjoining pipes, and therefore
strain to a degree of damage. The description of damage
for pipeswith an individual length (Lj), Rx and Ry can Table 2
Relationship between category of damage and limiting tensile strain (after Boscardin and Cording, 1987) Category of damage Normal degree of severity Limiting tensile strain (´ % lim ) 0 Negligible 0;0.05 1 Very slight 0.05;0.075 2 Slight 0.075;0.15 3 Moderate 0.15;0.3 4,5 Severe to very severe )0.3
C. Yoo, J.-H. Kim / Tunnelling and Underground Space Technology 18 (2003) 497–511 501 Table 3 Description of damage category Category Normal Description of typical damage of degree (Ease of repair is underlined) damage of severity
Note: Crack width is only one factor in assessing category
of damage and should not be used on its own as a direct measure of it. 0 Negligible
Hairline crackslessthan approximately 0.1 mm 1 Very slight
Fine cracks which are easily treated during normal
decoration. Damage generally restricted to internal wall
finishes. Closed inspection may reveal some cracks in
external brickwork or masonry. Typical crack widths up to 1 mm 2 Slight
Crackseasily filled. re-decoration probably required.
Recurrent cracks can be masked by suitable linings.
Cracks may be visible externally and some repointing may
be required to ensure weathertightness. Doors and
windows may stick slightly. Typical crack widths up to 5 mm 3 Moderate
The cracksrequired some opening up and can be patched
by a mason. Repointing of external brickwork to be replaced.
Doorsand windowssticking. Service pipesmay fracture.
Weathertightness often impaired. Typical crack widths
are 5–15 mm or several greater than 3 mm 4 Severe
Extensive repair work involving breaking out and
replacing sectionsof wallsespecially over doorsand
windows. Windows and door frames distorted floor
sloping noticeably. Walls leaning or bulging noticeably1,
some loss of bearing in beams. Service pipes disrupted.
Typical crack widthsare 15–25 mm but also dependson the number of cracks 5 Very severe
Thisrequiresa major repair job involving partial or
complete rebuilding. Beamslose bearing, wallslean badly
and require shoring. Windows broken with distortion.
Danger of instability. Typical crack widths are greater than
25 mm but dependson the number of cracks.
be computed asEq. (13) and Eq. (14). Detailed deri- B S E B E 0.242V T s Lj
vationsof Eq. (13) and Eq. (14) are available elsewhere s y s U
Ry ZvmaxZ Zv ys ( iqL Z ) j C F 1y C 1.65 1q T F D z y o z GV D i G
(Yoo, 2001). Note that Eq. (13) and Eq. (14) for maximum pulloutswere us ed in TURISK in order to w 2z B E W 1 L T j = x X exp y C1q F |
eliminate the inherent conservatism in the approach T y 2 D i G Y ~
suggested by Bracegirdle et al. (1996) in which the (13)
maximum pulloutsare taken asthe maximum horizontal ground displacements. B S w 2 z E W 0.159V T L T s j s y s U X Rx Zu Z max Zu xs ( x q f L Z ) j C F 1yexp y x | T T 2 B E
D z yz G y 2i V V Y ~ o y s 1 u s y 2tan C F (14) 2 (11) D 2pi G
Note that Eq. (12) and Eq. (14) are for a pipeline B E V y s 1 u s
parallel to and directly above a tunnel, i.e. ys0. For a x tan 0.4 C F (12) 2 D y2pi G
pipeline parallel to but offset from the tunnel drive, i.e.
Fig. 3. Schematic view of pipe rotation. 502
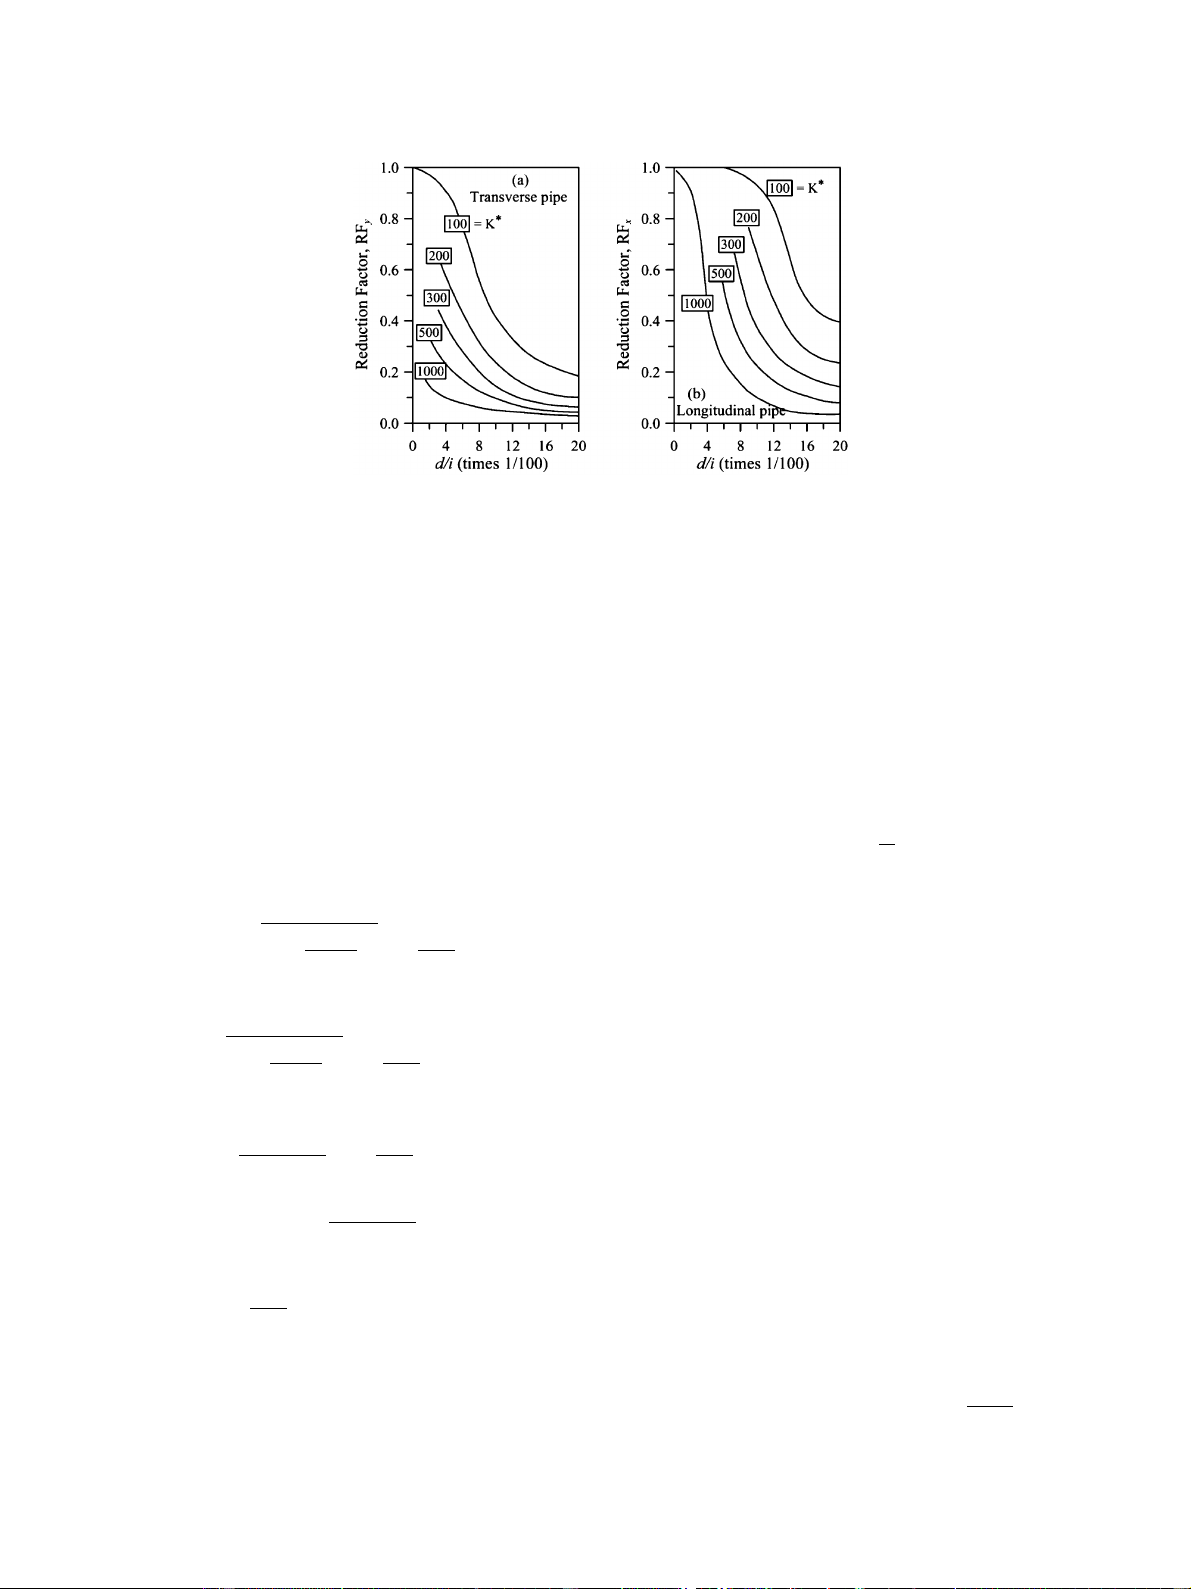
C. Yoo, J.-H. Kim / Tunnelling and Underground Space Technology 18 (2003) 497–511
Fig. 4. Reduction factorsfor horizontal strain.
ysyp, the ground movement transverse to the pipeline 2.3.2. Pipe strains
causing longitudinal bending is the sum of vertical
Pipe strains associated with ground movements are
movement, w, and lateral movement, v, asdefined in
directly related to the ground curvature and the horizon-
Eq. (15a). The effect of offset, ysyp, thus, is to reduce
tal strain imposed on them. When assessing acceptable
the bending strain (´b) and joint rotation (ux) by the limitsfor additional s train due to tunneling-induced
factor, CF(´b, ux), given in Eq. (15b). Likewise, the
ground movements in otherwise sound pipes, some
horizontal strain (´h) and pullout (Rx) are reduced by
degree of conservatism is required accounting for pos-
the same magnitude that the longitudinal displacement
sible deterioration of the pipes due to previous ground
u isreduced, asdefined in Eqs . (16a) and (16b) as
movements and related corrosion. Under most circum-
CF(´h, Rx). Therefore, the pipe strains and rotationy
stances, the maximum tensile strains occur at locations
pullout for a pipeline parallel to but offset from the
of maximum hogging curvature and horizontal strain.
tunnel drive can be easily computed by applying the
For pipes transverse to the tunnel drive, this location
correction factorsto those for a pipeline directly above occursat a dis tance of y y
s 3i from the center of the the tunnel.
trough, while at xsx " f
i for pipesparallel to the line
of tunnel. The expression for ground strain, more cor- 2 w 2 z B E y y
rectly differential ground movement, may be conserva- p yp © © 8 wqv s 1 p C q F expx w | Ž .ysy max 2 y
tively equated with the effect on a buried pipeline by
D z yz G y 2i ~ o p
assuming zero pipe stiffness, but for all practical cases sCFŽ´ , b u . x wmax (15a)
pipe stiffness and slip at the soil–pipe interface can
greatly reduce the strain in the pipeline. In jointed 2 w 2 z B E y y p yp
pipelines, the axial forces that can develop are severely CF ´ , b u s x 1 C q F expx | Ž . 2 (15b)
y Dz yz G y 2i ~
limited by the very small forces that can be transferred o p at the pipe jointsand thes e jointsthen accommodate w 2 z
most of the differential ground movement (Attewell et y w 2 z Žxyx . f yyp u su x exp |expx |
al., 1986). In view of this, Attewell et al. (1986) ysyp max 2 2 y 2i ~ y 2i ~
suggested that reduction factors shown in Fig. 4, which w 2 z yŽxyx .
wasoriginally developed by Poulosand Davis(1980) f sCF x | (´ , h R ) x umaxexp
for piles subjected longitudinal movements, be used 2 (16a) y 2i ~
when estimating the horizontal pipe strains (´ay, ´ax).
The maximum tensile strains for rigidly jointed pipelines w 2 z yyp
transverse and parallel to the tunnel drive, respectively, CF(´ ,R )sexpx | h x 2 (16b) y 2i ~
can therefore be computed using Eqs. (17a), (17b) and
(17c) and Eqs. (18a), (18b) and (18c). The reduction
The potential for damage isevaluated using the allow-
factors are computed according to the relative stiffness
able limits for rotation and pullout suggested by Attewell E R
between the pipe and the soil as P A * K s where E
et al. (1986) in Table 4. The limitsvary with joint type p Eg
and condition prior to tunneling asshown in Table 4. and E , g
are the elastic moduli of pipe and soil and RA
C. Yoo, J.-H. Kim / Tunnelling and Underground Space Technology 18 (2003) 497–511 503 A
performance on the likelihood of damage to adjacent isthe pipe area ratio p
in which Ap and rp are the 2 pr
buildingsyutilitiesso that modificationsto the proposed p
pipe sectional area and radius, respectively.
tunneling scheme can be made based on the parametric
study. Details of TURISK are described in subsequent ● Transverse pipe. paragraphs. ´ s 3.2. System structure ty ´ q by ´ay (17a) TURISK waswritten in a s erver-client environment 2 B E d d w V d s ´ s
using the Microsoft Visual Basic 6.0. Simple but robust by C Fs0.089 2 3 (17b) 2 D dy G i
GUI was developed focusing on user-friendliness. The
MapGuide ActiveX Control software was used to allow B E dv 0.178Vs
for TURISK to be used in a web-based environment. ´ s ay RF C y FmaxsRFy (17c) D dy G
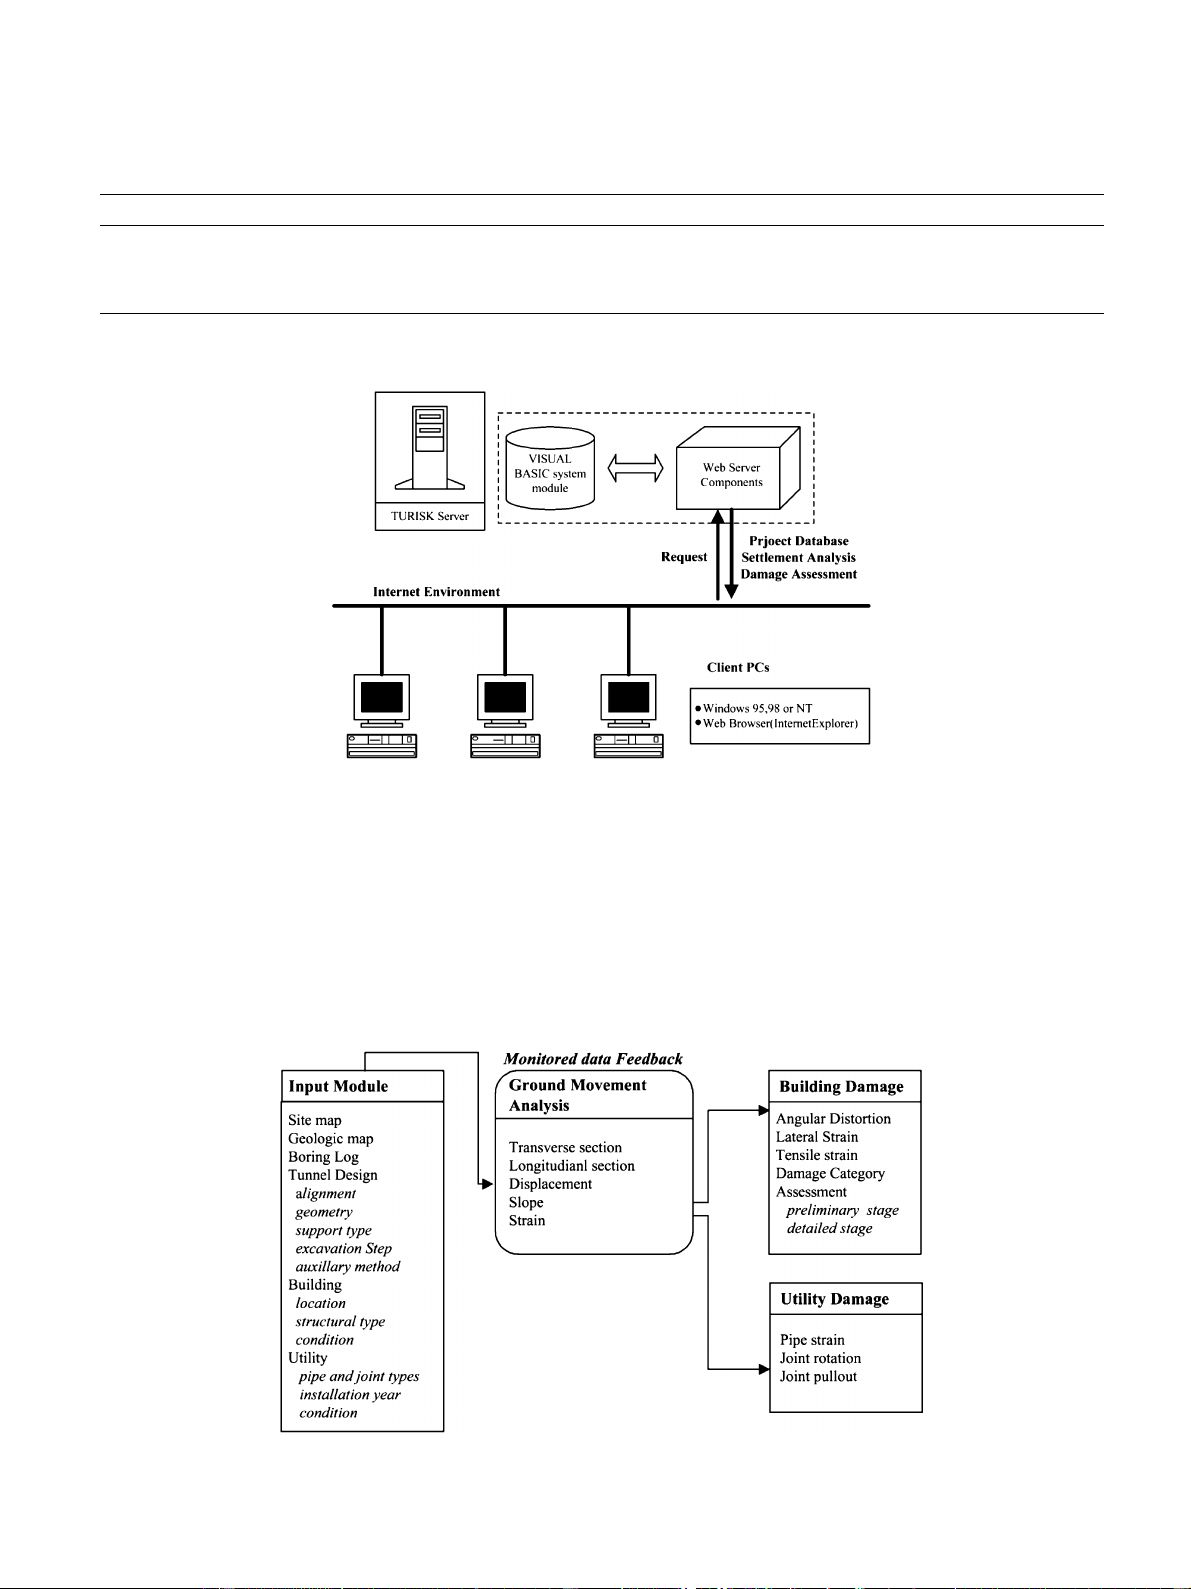
Fig. 5 shows an overview of TURISK. Žz y o z.i
TURISK consists of three modules: (1) input module;
(2) ground movement analysis module; and (3) damage ● Longitudinal pipe.
assessment module. Each module can function indepen-
dently, but isfully interfaced with other modules. The ´ s tx ´ q bx ´ax (18a)
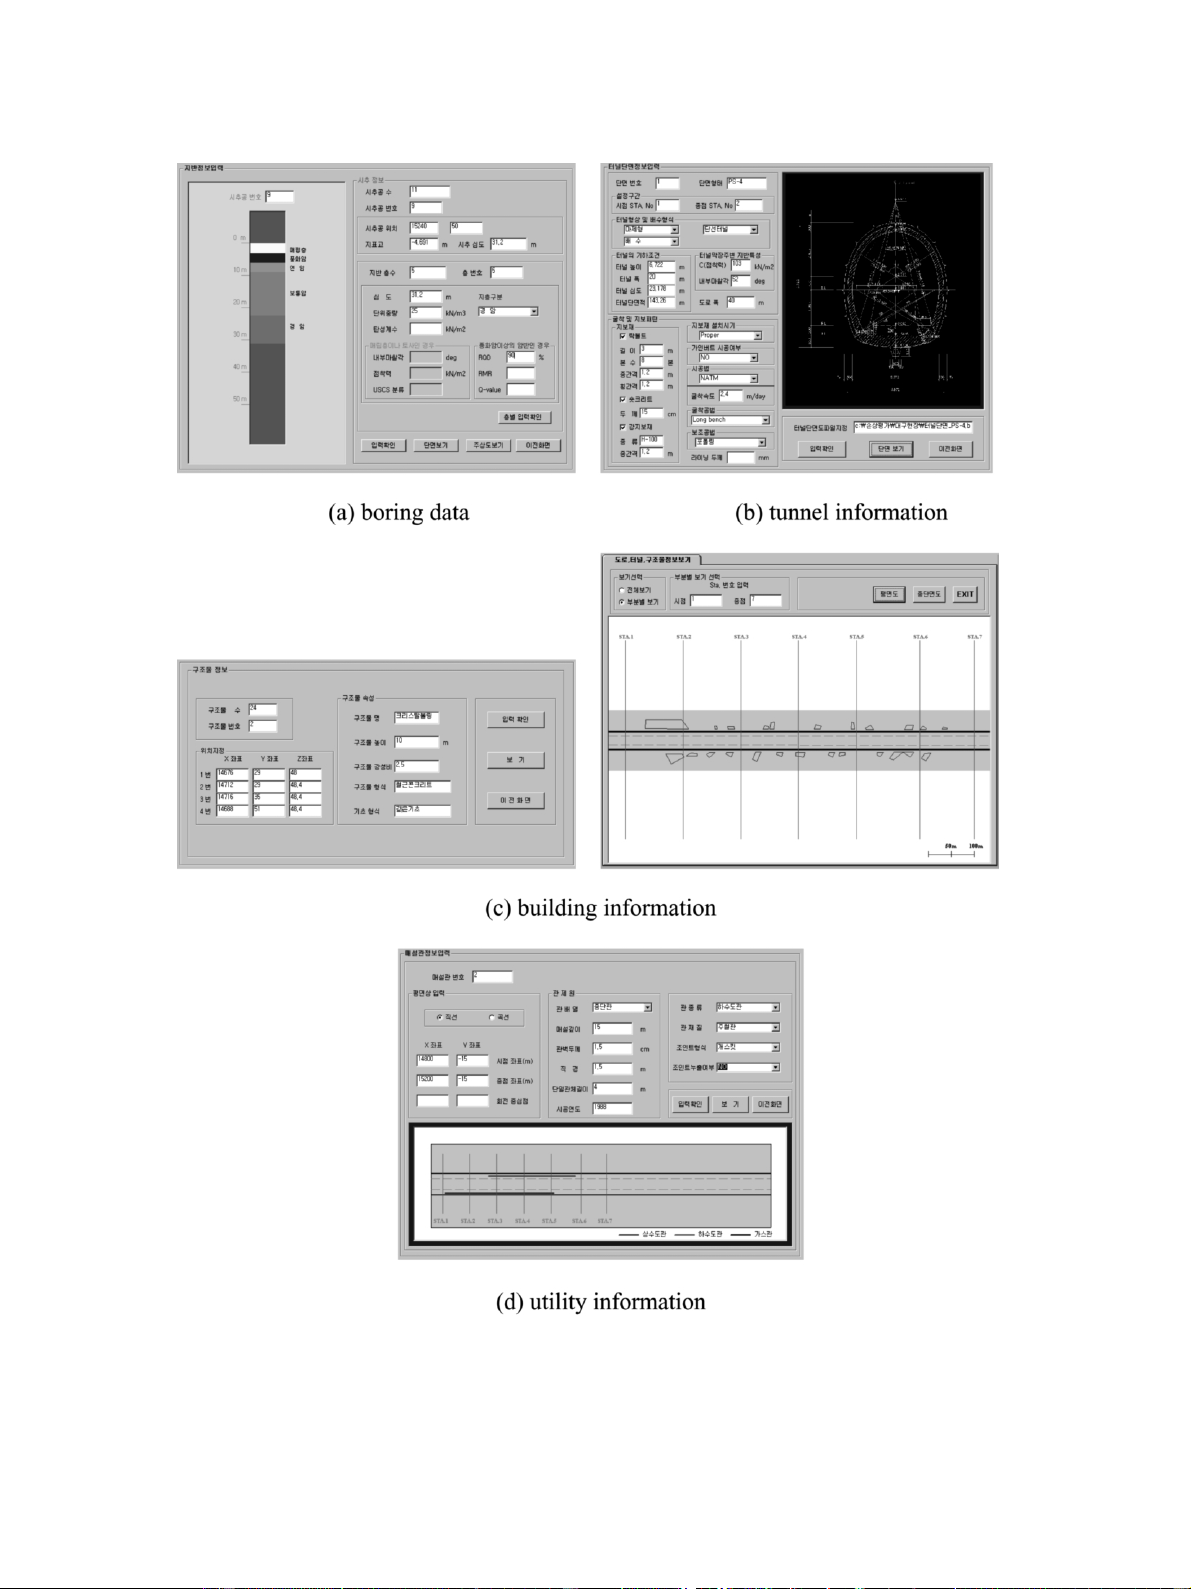
basic system structure is given in Fig. 6. 2 B E d d w V d 3.2.1. Input module s ´ s by C Fs0.0979 2 3 (18b) 2
In the input module, an authorized user can input D dx G i
construction-related information for a given project
through user-friendly window-based GUI. The required B E dv 0.097Vs ´ s input itemsinclude s ite map, tunnel alignment and ax RF C x FmaxsRFx (18c) D dx G Žz y o z.i
design drawings, geological map, boring information,
buildingsyutilitiesinformation, etc. and therefore the
Allowable limits for strain increase shown in Table 5
module itself can be severed as a database for a
can be used to evaluate the potential for damage. It
particular tunneling project. Considering the nature of a
should, however, be noted that these limits are somewhat
tunneling project, inputsfor all information are made
conservative in nature as noted by Bracegirdle et al.
on a station basis, and are utilized later in computing (1996).
the magnitude and distribution of ground movements
and associated buildingsyutilitiesdamage levels. Exam- 3. TURISK development
plesof variouswindowsavailable in the input module are shown in Fig. 7. 3.1. Overview
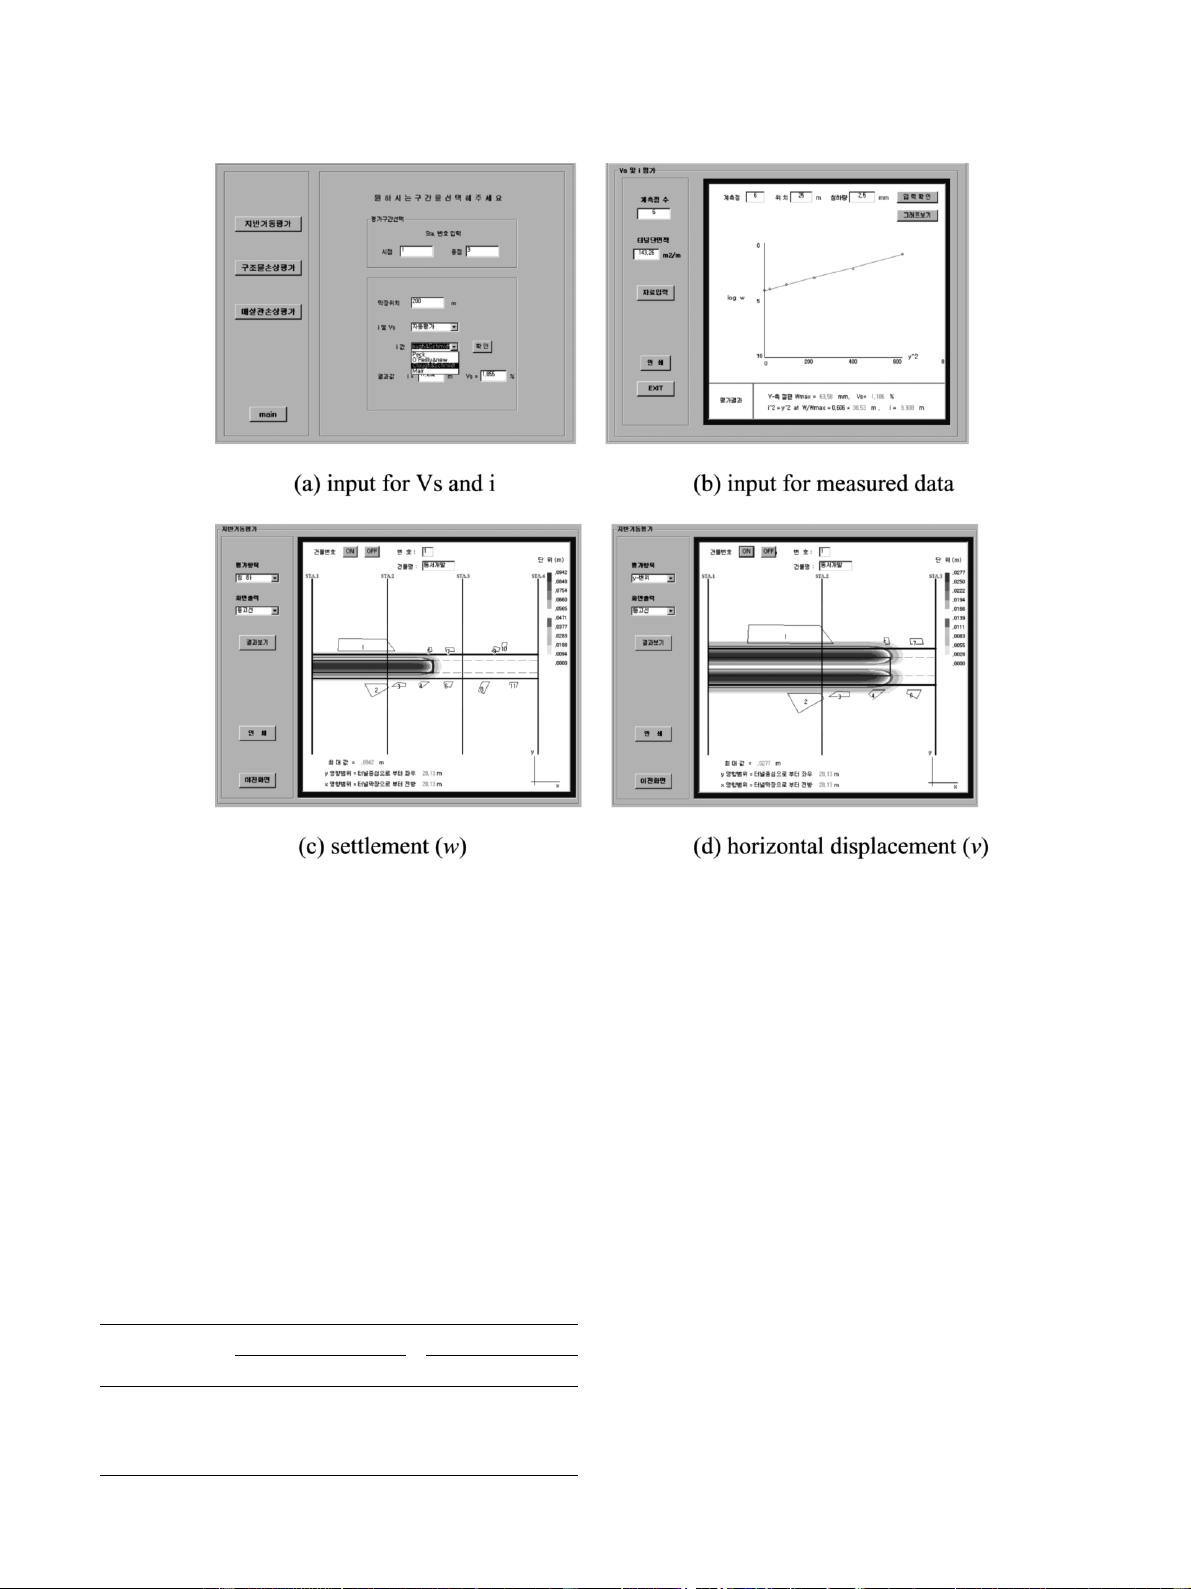
3.2.2. Ground movement analysis module
The process of settlement risk assessment associated
The magnitude and extent of ground movementsfor
with tunneling isrepetitive and computationally inten-
a given site are computed in this module using the
sive in nature, as mentioned previously. This type of equationspres
ented earlier in thispaper. The volume
process can therefore be more efficiently performed in
loss Vs and the inflection point i are the required input
a computer-based environment. In view of this, a web-
parameters. A user can specify a route to be analyzed
based tunneling-induced buildingyutility damage assess-
in terms of station numbers. Note that monitored trans-
ment system, TURISK, was developed.
verse settlement data, if available, can be fed back into
TURISK iscapable of predicting the magnitude and
the system so that the volume of settlement trough and
extent of ground movementsand anticipated degree of
the inflection point can be back-calculated and used in
damage to adjacent buildingsyutilitiesfor a given tun-
a subsequent analysis. A number of information can be
neling site. A web-based on-line computing concept is
extracted from the ground movement analysis module
employed to take advantage of the revolutionary internet
such as contour plots of ground displacements, slopes
technology, and therefore the system can be accessed
and strains, and transverse as well as longitudinal dis-
from anywhere through the World Wide Web. TURISK
placement profiles. Each contour plot is overlaid on a
allowsan authorized user to create a new project or to
plan drawing of tunnel alignment with buildingsand
modify any information of an existing project. The
utilitiesin place so that the likely magnitude and extent
surplusvalue of TURISK isthe ability to carry out a
of ground movementsto which buildingsyutilitiesare
parametric study with regard to the effect of tunneling
subjected can be visually identified. A parametric study 504
C. Yoo, J.-H. Kim / Tunnelling and Underground Space Technology 18 (2003) 497–511 Table 4
Allowable limitsfor rotation and pullout (after Attewell et al., 1986) Joint type Rotation, u (degree) Pull-out, R (mm)
Lead-yarn joint in gasmain with history of leak None None
Lead-yarn joint in sound gas main 1.0 10
Lead-yarn joint in water mains1.5 15
Rubber gasket joint in gas or water mains 2.5 25
Fig. 5. TURISK system overview.
can be performed on the effect of tunneling performance
3.2.3. Buildingyutility damage assessment module
on the ground movementsby varying the input values
The buildingyutility damage assessment module com-
for Vs and i. Fig. 8 illustrates typical example windows
putes the maximum tensile strains for buildingsyutilities
of outputsavailable in the ground movement analys is
located within a route specified by a user. The bending, module.
diagonal shear, and horizontal strains are calculated by
Fig. 6. System structure of TURISK (a) boring data; (b) tunnel information; (c) building information; (d) utility information.
C. Yoo, J.-H. Kim / Tunnelling and Underground Space Technology 18 (2003) 497–511 505
Fig. 7. Input module (a) input for Vs and i; (b) input for measured data; (c) settlement (w); (d) horizontal displacement (v).
projecting the predicted ground movementsat the loca-
category in accordance with the relationship in Table 2.
tion of each building and utility line. The calculated
Similarly, the pipe strains and joint rotationsypullouts
maximum tensile strain is then related to the damage
are calculated and compared with the acceptable limits 506
C. Yoo, J.-H. Kim / Tunnelling and Underground Space Technology 18 (2003) 497–511
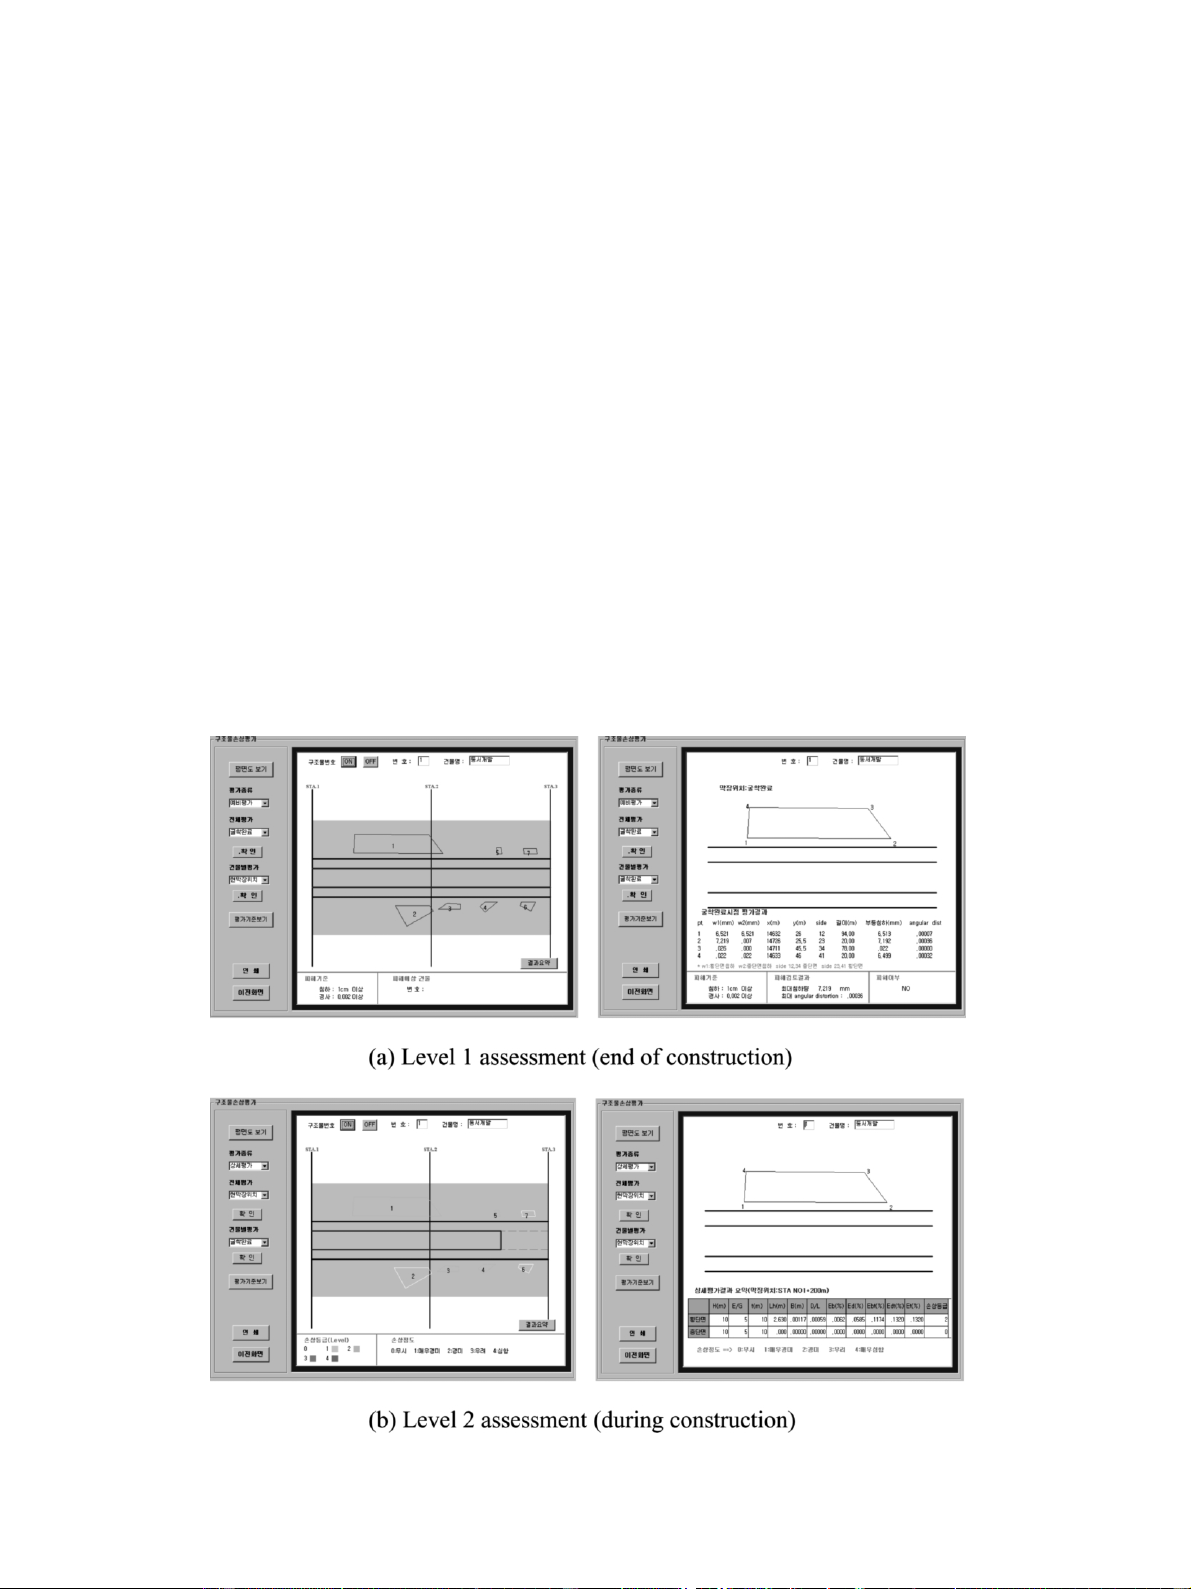
Fig. 8. Ground movement analysis module (a) Level 1 assessment (end of construction); (b) Level 2 assessment (during construction).
in Table 5. The results of damage assessment are
are further tested in the more elaborate Level 2 assess-
graphically presented in a manner that buildingsyutilities
ment for possible damage based on the procedures
can be identified with different colorsaccording to
outlined earlier. This allows a screening process, which anticipated damage levels.
eliminates any unnecessary data processing. Fig. 9
The assessment method employs a two-stage process
shows typical examples of the results of Level 1 and 2
(Level 1 and 2 assessments) in which buildingsare assessments.
eliminated from further stage, depending on the potential
degree of damage predicted. Note that a simple criterion
4. Implementation of TURISK
is used in the Level 1 assessment based on the allowable
limits of maximum ground settlement and slope, 10 mm
The developed system, TURISK, was implemented to
and 1y500, respectively. Only those buildingsyutilities
the Daegu Metro Subway Line 2 construction site in
subjected to settlement and slope greater than the limits
Korea, and tested for its applicability. Table 5 4.1. Site information
Allowable increase in strain (after Bracegirdle et al., 1996)
The test site consists of 1.2-km-long twin tunnels Material Design strain (m´) Allowable strain (m´)
constructed under heavily populated area as seen in Fig. Tensile Compressive Tensile Compressive
10a. North and south bound tunnels with a diameter Pit cast grey iron 370 1550 100 1200
(D) of 6.7 m were constructed approximately 1.0 D Spun cast grey 430;490 1770;2040
apart by the conventional drill and blasting method. The iron
ground at the site consists of 2.5 to 6.0 m of miscella- Ductile iron 820 1020 500 700
neous fill material including sand, gravel, and silty clay.
C. Yoo, J.-H. Kim / Tunnelling and Underground Space Technology 18 (2003) 497–511 507
Underlying the fill layer isa 0 to 10-m-thick weathered
4.2. Predicted ground movements
zone followed by a sedimentary rock layer of shale or
Asmentioned earlier, the prediction of ground move-
sandstone having a uniaxial strength of in-tack rock
mentsrequiresthe volume of settlement trough Vs and
ranging 500;1000 MPa. The rock layer ischaracterized
the inflection point i. Local experiencesin s imilar
by a persistent bedding dipping 10;308SE with a
tunneling conditionsindicated that the ground s urface
number of non-persistent joints. The tunnels were
volume losses in the range of 1.0;1.8% with the
designed to be excavated in the sedimentary rock layer
inflection point ranging 9–11 m from the tunnel center-
with a cover depth of 19;25 m ass een in Fig. 10b
line. These values were then used to form an upper and
showing the longitudinal alignment profile. The tunnel
lower bounds in estimating the ground movements.
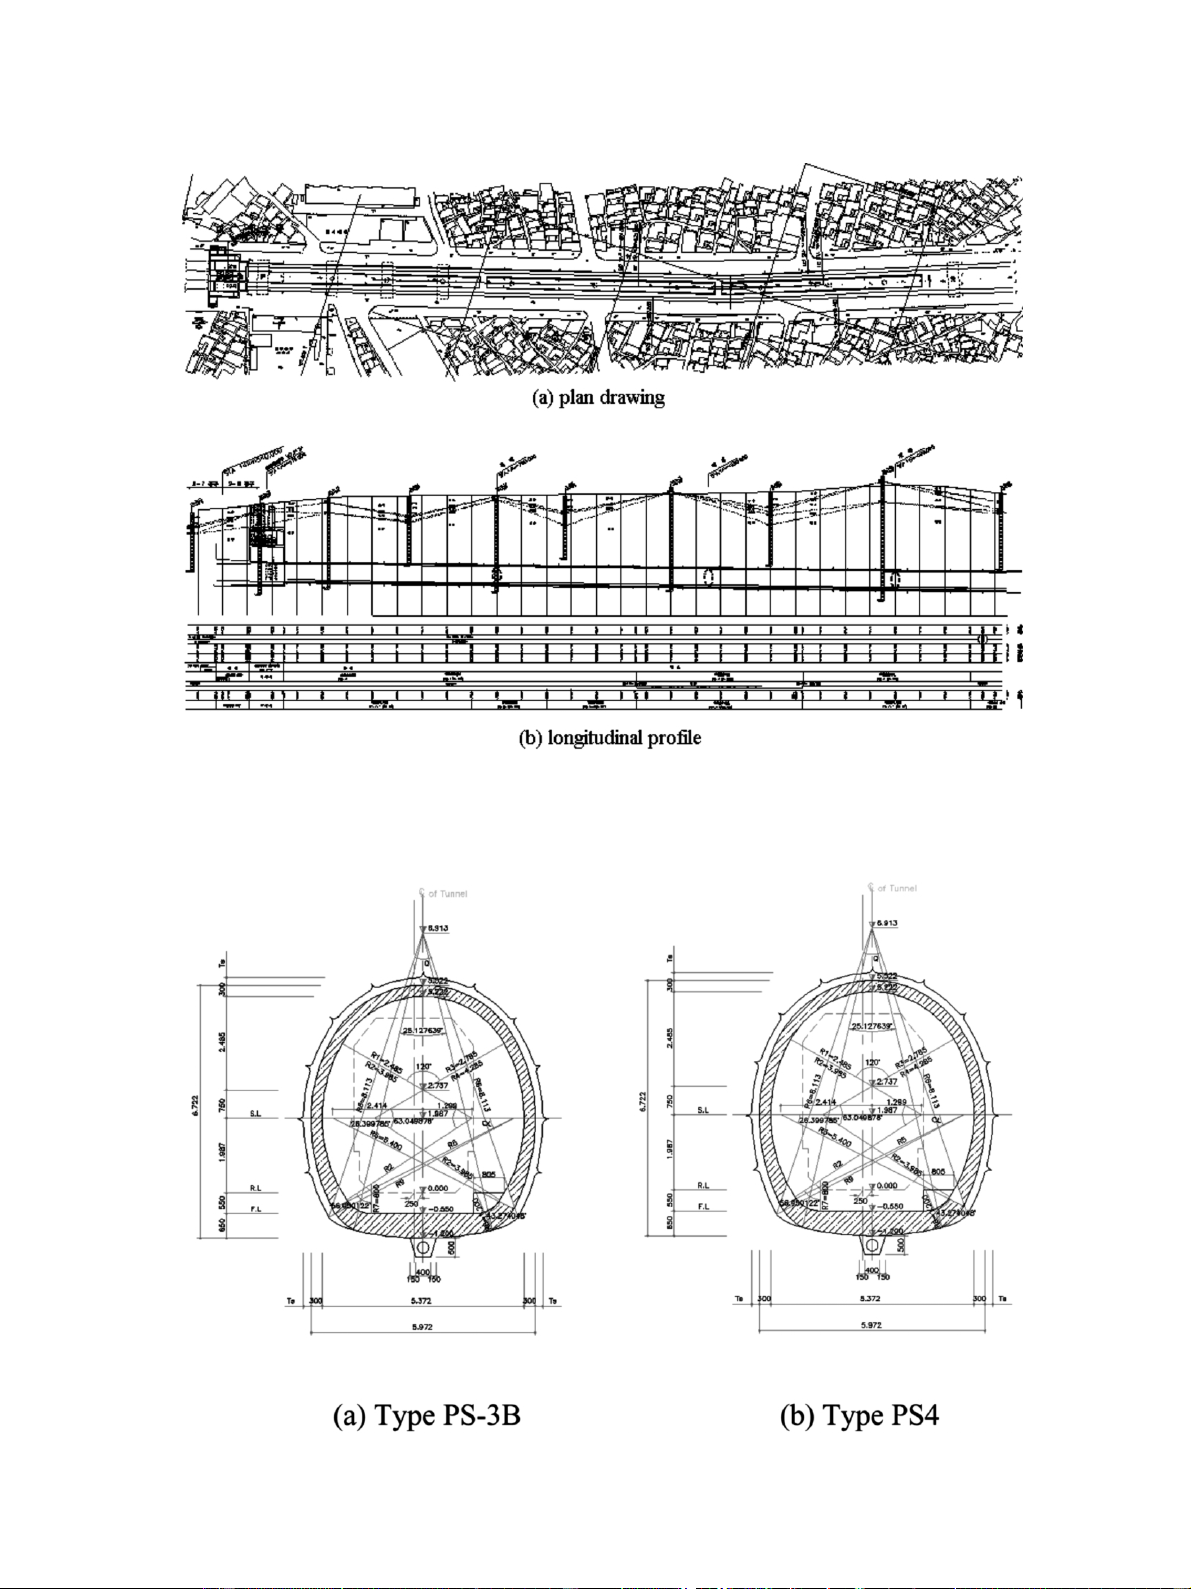
alignment followsmore or lessthe main street. Typical
Considering the varying tunnel cover depths along the
twin-tunnel sections are shown in Fig. 11.
tunnel alignment, the entire route wasdivided into
A number of old and new buildings exist alongside
substations according to tunnel cover depth. For each
the street. Note that only the buildings located within
substation, an average cover depth was used to compute
the zone of influence, i.e. up to 4.0 D away from the
the ground displacements. Presented in Table 6 are the
tunnel centerline, were selectively considered in the
estimated maximum ground displacements and slopes
system during the input process. A total of 52 buildings
for the upper and lower boundsof the surface volume
fell within the zone of influence. The required infor-
loss for the entire route. Note that x and y-directions
mation for the buildingswere obtained from alignment
correspond to parallel and transverse directions, respec-
mapping and general site reconnaissance. The site recon- tively, to the tunnel drive.
naissance indicated that no utility lines are in close
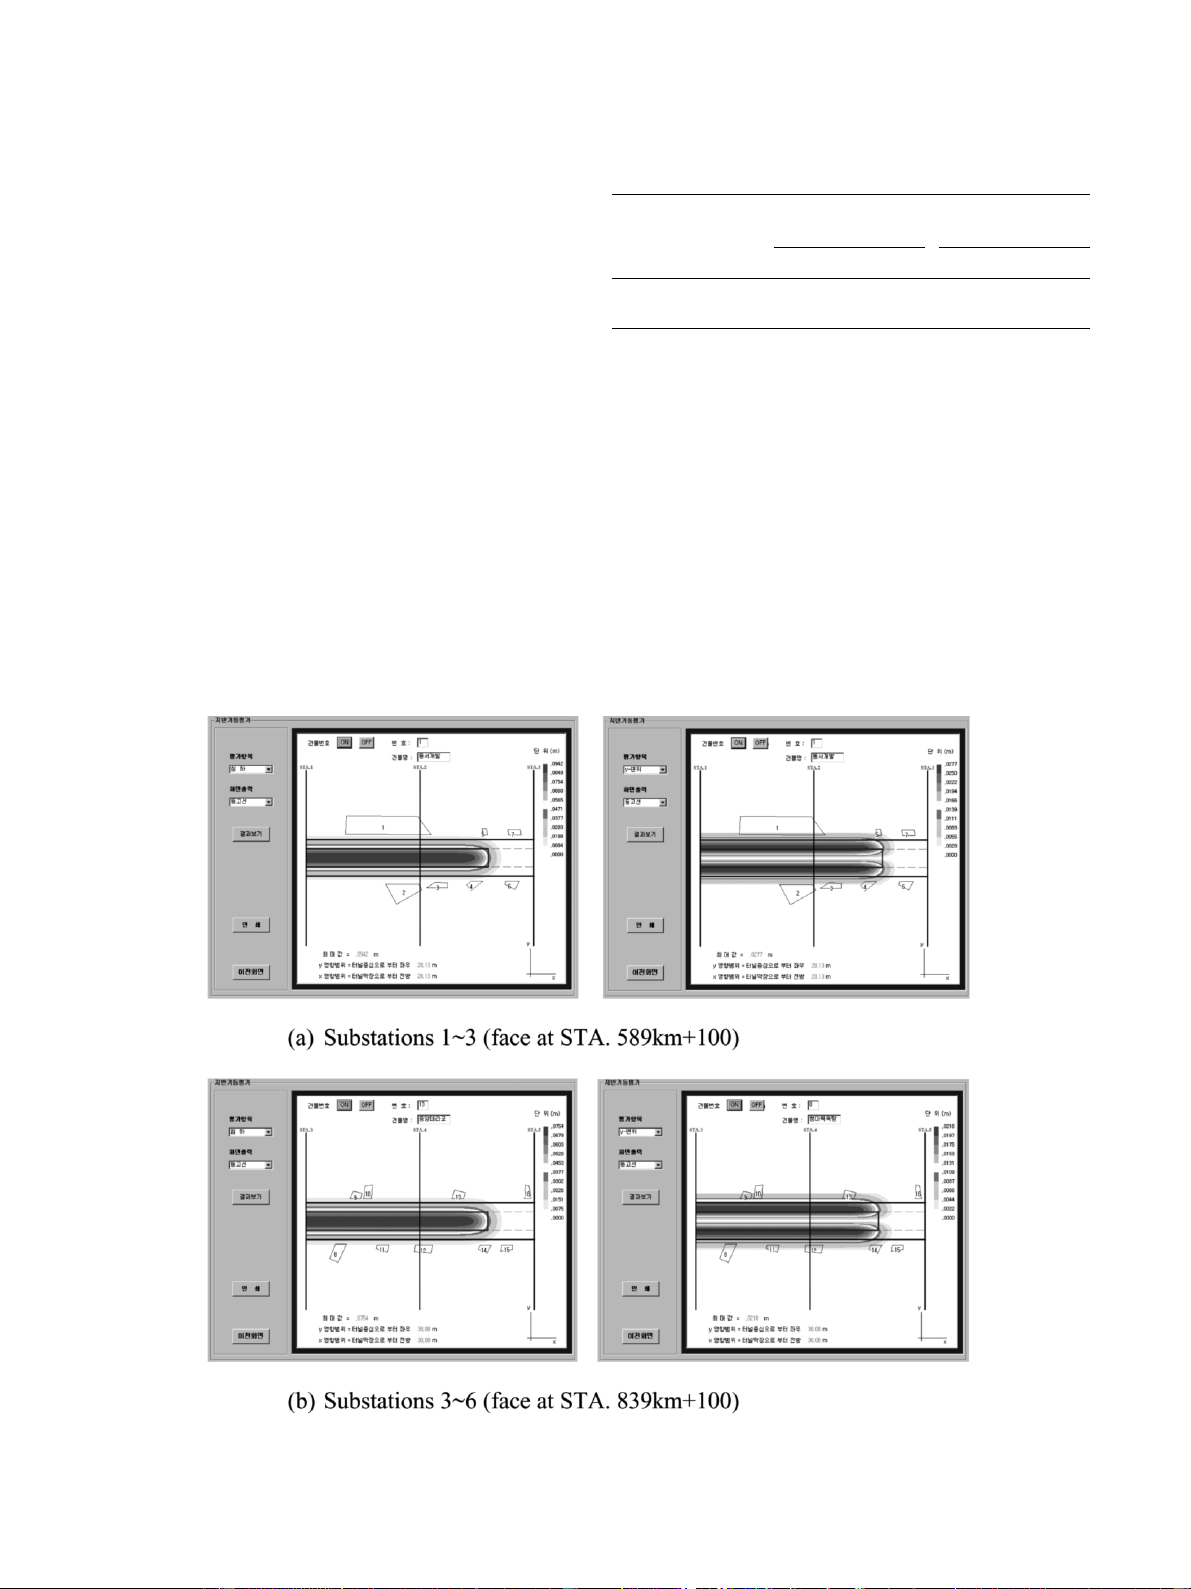
Presented in Fig. 12 are the contour plots of ground
proximity to the proposed tunnel alignment.sv671«s12)
displacements and slopes for a 350-m-long route with
Fig. 9. Damage assessment module (a) plan drawing; (b) longitudinal profile. 508
C. Yoo, J.-H. Kim / Tunnelling and Underground Space Technology 18 (2003) 497–511
Fig. 10. Plan and longitudinal viewsof site (a) Type PS-3B; (b) Type PS4.
Fig. 11. Typical twin-tunnel sections (a) substations 1–3 (face at STA. 589 kmq100) Substations 3–6 (face at STA. 839 kmq100).
C. Yoo, J.-H. Kim / Tunnelling and Underground Space Technology 18 (2003) 497–511 509 Table 6
the tunnel face at two different locations, i.e. STA.14
Results of ground movement analysis
km 589.050q100 and STA.14 km 839.050q100. As
noted, due to relatively large setbacks of the buildings, Vs Max surface Max horizontal Max the ground movementss eemed to only influence a
(%) settlement (mm) displacement (mm) slope
limited number of buildingsin clos e proximity to the
x-direction y-direction x-direction y-direction
edge of the street. With the help of window-based GUI, 1.0 25 5 7 1y1250 1y750
the buildings subjected to significant ground movements 1.8 36 9 13 1y650 1y430
can be easily identified. A parametric study on the
surface volume loss indicated that a volume loss of V s s
1.5% would yield satisfactory tunneling performance in
termsof damage to adjacent buildings . Thisvalue of
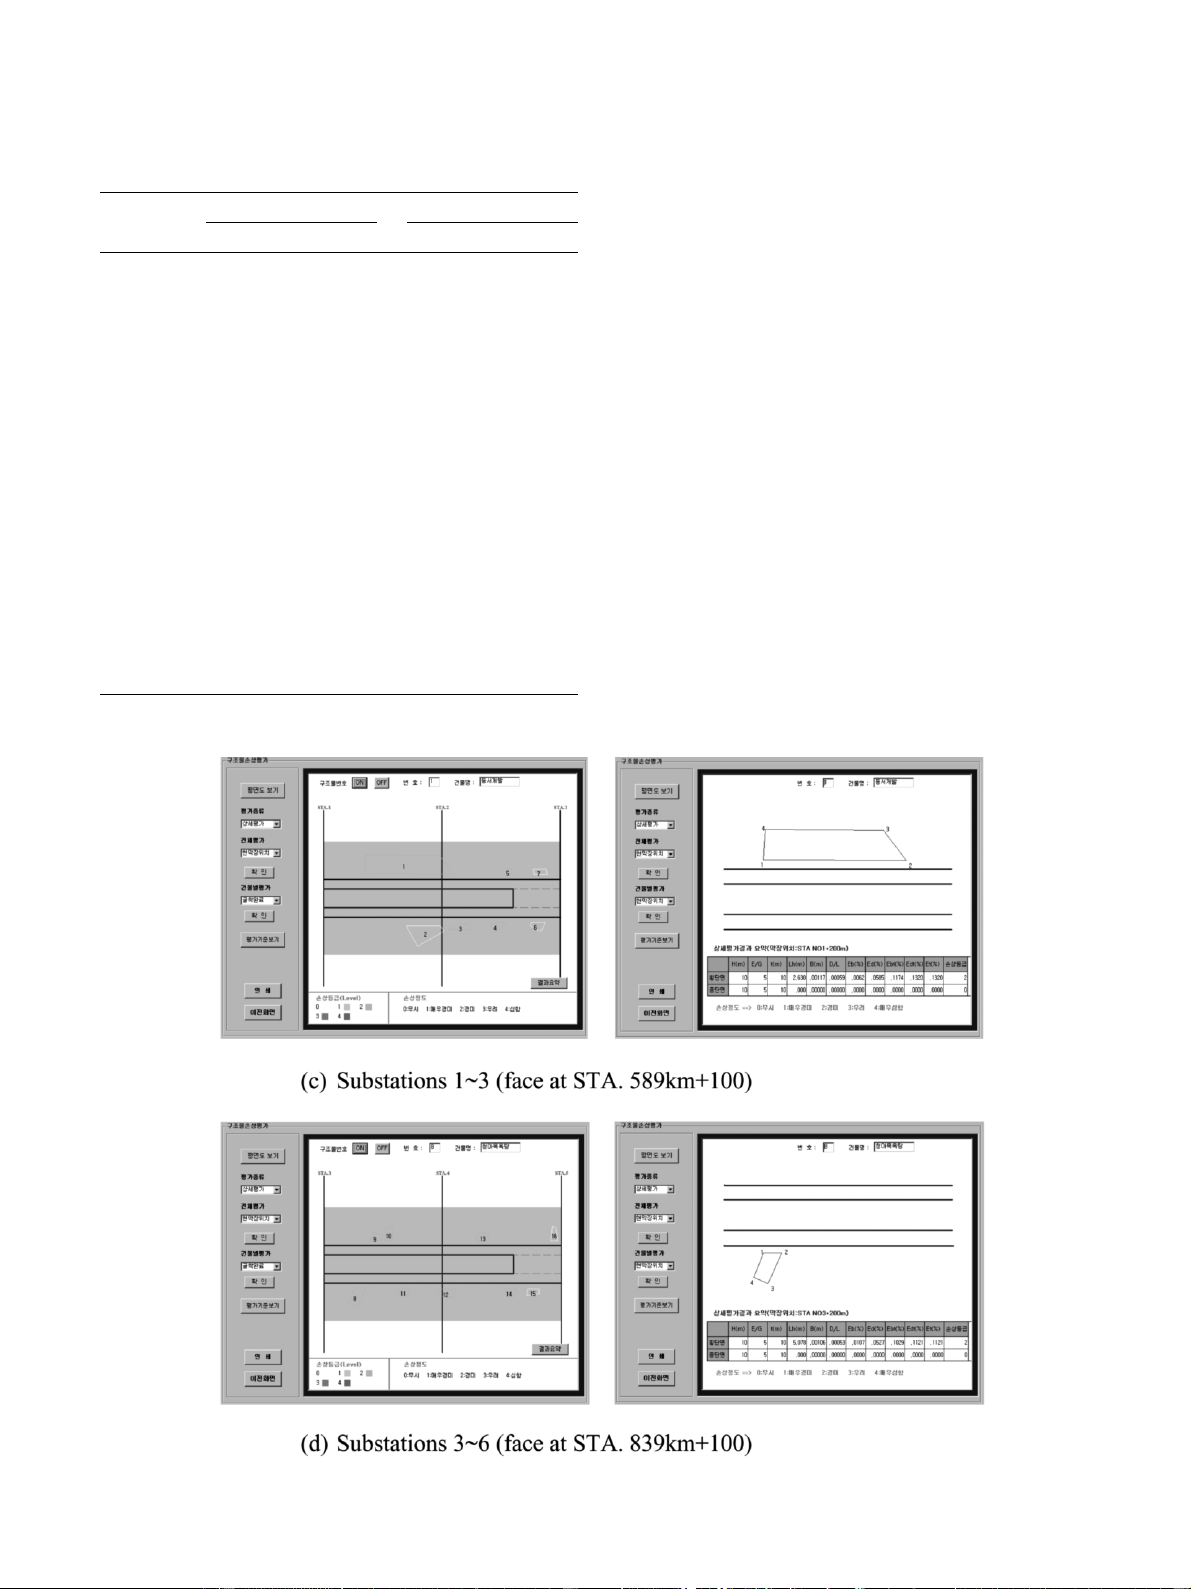
In the Level 2 damage assessment, the location of V s
tunnel face was varied to search the worst possible s 1.5% wass
trictly enforced during tunneling asa
controlling parameter of tunneling performance.
damage that might have been sustained by the buildings
during tunneling. Note that for each building tensile
4.3. Buildingyutility damage assessment
strains for all sidewalls were calculated and the maxi-
mum tensile strain was then related to the damage
Level 1 assessment indicated that only 24 buildings
category. The results of damage assessment for the
were expected to experience some degree of damage
buildings are summarized in Table 7. As seen, most of
according to the ground slope and settlement criteria.
the buildingsfell in the damage category 2 ‘s light’
Asmentioned, only the buildingsthat did not passthe
except two buildings, which exhibited the damage cat-
Level 1 assessment were further tested for potential
egory 3 ‘moderate’. Thiswasnot unexpected res ult damage in Level 2 assessment. s
ince the buildingsand utility linesare well s et back
Fig. 12. Contour plotsof settlement and y-direction horizontal displacement (c) substations 1–3 (face at STA. 589 kmq100) (d) substations 3– 6 (face at STA. 839 kmq100). 510
C. Yoo, J.-H. Kim / Tunnelling and Underground Space Technology 18 (2003) 497–511 Table 7
from the tunnel alignment due to the relatively wide
Results of building damage assessment
street. The buildings categorized ‘slight’ and ‘moderate’ Building no. Max tensile strain (%) Damage category
were closely monitored during tunneling, and extra care
was taken to limit the ground surface volume loss V Transverse Longitudinal Transverse Longitudinal s
under 1.5%. No seriousdamageswere reported. Fig. 13 1 0.132 0.008 2 0
illustrates the results from the damage assessment 2 0.000 0.005 0 0 3 0.119 0.013 2 0 module. 4 0.131 0.016 2 0 5 0.139 0.014 2 0 6 0.132 0.016 2 0 5. Conclusions 7 0.136 0.017 2 0 8 0.137 0.014 2 0
A web-based tunneling-induced buildingyutility dam- 9 0.140 0.018 2 0 10 0.137 0.015 2 0
age assessment system (TURISK) wasdeveloped in this 11 0.127 0.015 2 0
study. The developed system employs the first-order- 12 0.124 0.010 2 0
simplified approaches for prediction of ground move- 13 0.137 0.014 2 0 14 0.127 0.015 2 0
ments and assessment of damage to adjacent buildings 15 0.127 0.015 2 0
and utilities. On-line computing concept was introduced 16 0.136 0.014 2 0
in TURISK so that any authorized user can have access 17 0.147 0.014 2 0 18 0.127 0.015 2 0
to the system and perform an assessment through the 19 0.137 0.012 2 0 World Wide Web. 20 0.146 0.015 2 0
The developed system, TURISK, was implemented 21 0.156 0.018 3 0 22 0.161 0.015 3 0
and tested for its applicability during construction of the 23 0.119 0.007 2 0
Daegu Metro Subway Line 2 in Korea. Through the 24 0.142 0.014 2 0
course of TURISK implementation, the system has been
Fig. 13. Level 2 damage assessment.
C. Yoo, J.-H. Kim / Tunnelling and Underground Space Technology 18 (2003) 497–511 511
proven to be effective not only in predicting ground
Boscardin, M.D., Cording, E.G., 1987. Building response to excava-
movements and possible damage levels that might be
tion-induced settlement. J. Geotech. Eng. ASCE 115 (1), 1–21.
Burland, M.D., Wroth, C.P., 1974. Settlement of buildingsand
sustained by the adjacent buildingsyutilitiesbut also in
associated damage. SOA Review, Conference on the Settlement of
performing a parametric study to determine limiting
Structures. Pentech Press, Cambridge, London, pp. 611–654.
values of volume loss to avoid excessive damage to
Burland, J.B. et al., 1977. Behavior of foundation and structures’ nearby buildingsyutilitiesfor a given tunneling
SOA Report, Session 2, Proceedings of the 9th International environment.
Conference SMFE, Tokyo, vol. 2, pp. 495–546.
Considering the inherent conservatism of the methods
Burland, J.B., 1995. Assessment of risk of damage to buildings due
to tunneling and excavations, Invited Special Lecture to IS-Tokyo
employed in TURISK, it isimportant to perform more
1995: 1st International Conference on Earthquake Geotechnical
rigorous analyses taking the possible soil–structure Engineering.
interaction into consideration for buildings classified as
Clough, G.W., Schmidt, B., 1981. Design and performance of exca-
being at risk of category 3 damage (moderate) or greater.
vations and tunnels in soft clay. In soft Clay Engineering. Elsevier,
Similarly, a second round of more elaborate analyses pp. 569–634.
incorporating soil–pipe interaction must be employed
Kimmance, J.P., et al., 1999. Geographical information system (GIS)
application to construction and geotechnical data management on
for pipelines classified as being damaged. Nevertheless,
MRT construction projects in Singapore. Tunnel. Underground
TURISK described in this paper can be effectively used Space Technol. 14, 469–479.
as an efficient tool in a decision making process within
Mair, R.J., et al., 1993. Subsurface settlement profiles above tunnels
the framework of risk management during tunneling.
in clays. Geotechnique 43 (2), 315–320.
Netzel, H., Kaalberg, F.J., 1999 Settlement Risk Management with
GIS for the Amsterdam NorthySouth Metroline, Proceedingsof the Acknowledgments
World Tunnel Congress 1999. Oslo, pp. 129–136.
New, B.M., O’Reilly, M.P. (1991), Tunneling induced ground move-
This research was supported by KOLON Engineering
ments: predicting their magnitude and effect, 4th International
& Construction Co. and Ltd. and by SAFE (SAFEty
Conference on Ground Movementsand Structures. Cardiff.
and Structural Integrity Research Center) at Sungkyunk-
O’Reilly, M.P., New, B.M. (1982), ‘Settlementsabove tunnelsin the
wan University. The financial support is gratefully
United Kingdom—their magnitude and prediction’. Proceedingsof
Tunneling 1982, Institute of Mining Metallurgy, London, pp.173– acknowledged. 188.
Peck, R.B., 1969, Deep excavationsand tunneling in s oft ground, References
State of the Art Report, Proceedingsof the 7th International
Conference on SMFE, Mexico City, State of the Art Volume, pp.
Attewell, P.B., et al., 1986. Soil MovementsInduced by Tunneling 225–290.
and their Effectson Pipelinesand Structures. Blackie, New York.
Poulos, H.G., Davis, E.H., 1980. Pile Foundation Analysis and
Bracegirdle, A., Mair, R.J., Nyren R.J., Taylor, R.N., 1996. A
Design. John Wiley and Sons, New York.
methodology for evaluating potential damage to cast iron pipes
Yoo, C.S., 2001. Damage assessment of buried pipelines due to
induced by tunneling, Proceedingson the Geotechnical Aspectsof
tunneling-induced ground movements. J. Korean Geotech. Soc. 17
Underground Construction in Soft Ground, London, pp. 659–664. (4), 71–86.
Document Outline
- A web-based tunneling-induced building/utility damage assessment system: TURISK
- Introduction
- Ground movements and building/utility damage assessment
- Ground movements and strains
- Building damage assessment
- Utility damage assessment
- Joint rotation and pullout
- Pipe strains
- · Transverse pipe
- · Longitudinal pipe
- TURISK development
- Overview
- System structure
- Input module
- Ground movement analysis module
- Building/utility damage assessment module
- Implementation of TURISK
- Site information
- Predicted ground movements
- Building/utility damage assessment
- Conclusions
- Acknowledgements
- References
Tài liệu liên quan:
-

Ung dung game hoa trong cac chien dich MKT
18 9 -

Bao cao Chi so TMDT Viet Nam 2025
15 8 -
Thông tư quy định về việc phân quyền, phân cấp và phân định thẩm quyền quản lý nhà nước về giáo dục cho chính quyền địa phương
24 12 -
Nghị quyết về phát huy các giá trị di sản văn hóa gắn với phát triên du lịch bền vững tỉnh Khánh Hòa đến năm 2025, định hướng đến năm 2030
14 7 -
Quyết định phê duyệt Chiến lược phát triển du lịch Việt Nam đến năm 2030
13 7