An interpretable prediction method foruniversity student academic crisis warning | Học viện phụ nữ Việt Nam
An interpretable prediction method foruniversity student academic crisis warning | Học viện phụ nữ Việt Nam được sưu tầm và soạn thảo dưới dạng file PDF để gửi tới các bạn sinh viên cùng tham khảo, ôn tập đầy đủ kiến thức, chuẩn bị cho các buổi học thật tốt. Mời bạn đọc đón xem!
Môn: English A1 51 tài liệu
Trường: Học viện Phụ nữ Việt Nam 805 tài liệu
Tác giả:


Preview text:
Complex & Intel igent Systems (2022) 8:323–336
https://doi.org/10.1007/s40747-021-00383-0 ORIGINAL ARTICLE
An interpretable prediction method foruniversity student academic crisis warning
ZhaiMingyu1· WangSutong1· WangYanzhang1· WangDujuan2
Received: 31 December 2020 / Accepted: 15 April 2021 / Published online: 29 April 2021 © The Author(s) 2021 Abstract
Data-driven techniques improve the quality of talent training comprehensively for university by discovering potential aca-
demic problems and proposing solutions. We propose an interpretable prediction method for university student academic
crisis warning, which consists of K-prototype-based student portrait construction and Catboost–SHAP-based academic
achievement prediction. The academic crisis warning experiment is carried out on desensitization multi-source student data
of a university. The experimental results show that the proposed method has significant advantages over common machine
learning algorithms. In terms of achievement prediction, mean square error (MSE) reaches 24.976, mean absolute error
(MAE) reaches 3.551, coefficient of determination ( R2 ) reaches 80.3%. The student portrait and Catboost–SHAP method
are used for visual analysis of the academic achievement factors, which provide intuitive decision support and guidance
assistance for education administrators.
Keywords Academic crisis warning· Interpretable machine learning· Student portrait· Catboost–SHAP Introduction
If the credits required for graduation appear to be
dropped, the exam should be made up or retaken as soon
With the development of informatization in universities, a
as possible. The factors of student academic scores deserve
large amount of data related to student academic perfor-
the attention of advisors. Advisors are able to adopt various
mance has been collected, which plays an important role in
guiding measures to prevent the delay graduation of students
promoting the education innovation and development. The
in academic crisis if they receive the warning in advance.
accumulated big data also provides a good foundation for
The credits of students are usually related to study behavior,
the application of data-driven techniques in academic warn-
living behavior, basic information, internet behavior and so
ing. More and more scholars pay attention to the enormous
on. The data-driven techniques enable university adminis-
social value in educational big data and make research in
trators to take fully use of students’ data in terms of living
terms of academic warning. Peterson and Colangelo [1] gave
habits, family background, etc. Thus, the university admin-
the opinion that boys in colleges were more likely to be in
istrators and instructors can take timely targeted measures to
an academic crisis than girls. Reis and McCoach [2] gave a
help students who are at risk of failure to graduate on time
new definition of academic crisis: those who did not meet
or have poor expected performance in next semester. Aca-
the standards or the capable ones. It is necessary for students
demic warning based on data-driven techniques is beneficial
to get required credits within the specified academic years if
for discovering the physical or mental health problems of
they want to graduate successfully.
students timely, promoting the all-round development of
them, reducing the risk of students delaying graduation or
dropping out, better achieving teaching in accordance with
their aptitude, and deepening the teaching reform constantly. * Wang Dujuan djwang@scu.edu.cn
Most of the existing methods have low accuracy and
interpretability in university student academic crisis warn-
1 School ofEconomics andManagement, Dalian University
ing. They lack the use of living behavior data, internet
ofTechnology, Dalian116024, China
behavior data for more accurate reflection of students’ status.
2 Business School, Sichuan University, Chengdu610064,
Machine learning methods they used belong to black-box China 0123456789) 1 3 3 24
Complex & Intel igent Systems (2022) 8:323–336
methods, which only give the prediction results but cannot
on academic performance, and used multi-source SR ques-
provide the inference process. Interpretable machine learn-
tionnaires to identify students’ dysfunctions in the process
ing has gradually become a hot topic in academic research
of learning motivation. Fonteyne etal. [7] used question-
in recent years [3]. With the continuous improvement of
naires to explore the factors that affected academic per-
machine learning method performance, applications in vari-
formance, and concluded that in higher education, a suit-
ous fields are expanding [4]. However, it is difficult to intro-
able learning plan was one of the important factors that
duce black-box machine learning methods to some decisions
promoted the improvement of academic performance. The
due to the lack of interpretability. It is hard to gain the trust
learning plan was able to better predict academic perfor-
of decision makers without clear reasoning procedure. We
mance. However, the above methods were easily affected
need not only accurate but also interpretable methods for
by subjective factors and led to poor generalization per-
academic warning in advance. Student portraits and SHAP-
formance in different environment.
based prediction method are two effective ways to describe
Recently, more and more scholars tried using data-driven
the students’ conditions and predict the expected academic
machine learning methods to predict student academic per-
performance. It is realistic to explore the relationship among formance. Huang and Fang [ ]
8 collected 2907 data from 323
study behavior, living behavior, basic information, internet
undergraduates in four semesters and used multiple linear
behavior of students. The main contribution of this work is
regression, multilayer perceptual network, radial basis func- listed as follows:
tion network and support vector machine to predict students’
1. An interpretable prediction method considering cat-
scores in the final comprehensive exam. The experimental
egorical features for university student academic crisis warn-
results showed that support vector machines achieve the
ing is proposed, which consists of K-prototype-based student
highest prediction accuracy. Antonenko and Velmurugan [9]
portrait construction and Catboost–SHAP-based academic
used hierarchical clustering method Wards clustering and achievement prediction.
non-hierarchical clustering method k-means clustering to
2. A variety of strategies including multi-source data
analyze the behavior patterns of online learners. Dharmara-
fusion, data filtering, missing value processing, coding trans-
jan and Velmurugan [10] used CHAID classification algo- formation are used.
rithm to mine information from students’ past performance
3. Interpretable academic warning visualization consist-
and predict the future performance of students based on the
ing of the student portrait and Shapley value plot is real-
score records of 2228 students. Migueis etal. [11] obtained
ized to give interpretable analysis and provide data-driven
the dataset of 2459 students from the School of Engineer-
decision-making support for university administrators.
ing and conducted comparison results with random forest,
The rest parts are stated below. We delineate the
decision tree, support vector machine and Naive Bayes. They
related work in terms of academic crisis warning in Sec-
concluded that random forest is superior to other classifica-
tion“Related work”. Section“An interpretable prediction
tion techniques. Yukselturk etal. [1 ] 2 used machine learning
method considering categorical features” introduces the
algorithms such as decision tree, K-nearest neighbor, neural
details of the proposed interpretable prediction method for
networks, and Native Bayes to analyze the causes of drop-
university student academic crisis warning. We conduct the
out. Hachey etal. [13] used a quadratic logistic regression
comparison experiments and give the visualization analysis
algorithm to analyze the relationship between the students’
in Section “Experimental resul ”
t . Section“Conclusion” con-
course notes and academic performance. They concluded
cludes our work and give the future direction.
that the students’ academic performance can be predicted
based on the students’ course notes. Asif etal. [14] used
various data mining methods to predict students’ academic Related work
achievement and studied typical progressions. Jugo J etal.
[15] combined the K-means algorithm with educational
Traditionally, many scholars carried out the qualitative
data mining to propose an intelligent education and teach-
research on academic crisis warning in higher education in
ing system, which incorporated the design ideas of online
the form of questionnaires, interviews, and surveys. Ben-
games, and improved the final grade of students by allowing
jamin and Heidrun [5] explored the relationship between
students to complete specific tasks. Elbadrawy etal. [16]
parents’ learning ability and children’s academic perfor-
generated student portraits based on student data, and then
mance. They predicted children’s academic performance
used regression analysis and matrix decomposition to predict
through parental learning behavior, and found that reduc-
student performance to help students avoid the risk of failing
ing parental behaviors that were not related to learning
subjects. Xu etal. [17] predicted undergraduates’ academic
could help children improve their academic performance.
performance through the Internet behavior by machine
Barry and Anastasia [6] compared the predictions of stu-
learning. The comparison results revealed the association
dents’ self-discipline and self-regulation (SR) measures
between Internet usage and academic performance. 3
Complex & Intel igent Systems (2022) 8:323–336 325
A large number of experiments on academic crisis warn-
based on the current information. Therefore, we propose
ing have been conducted from the qualitative and quantita-
K-prototype-based student portrait construction and Cat-
tive perspectives. Data-driven machine learning methods
boost–SHAP-based academic achievement prediction.
have achieved satisfactory generalization performance [18].
The K-prototype-based student portrait comprehensively
However, there are still many obstacles in the popularization
describe students from the perspectives of basic informa-
of universities. These methods are black-box methods and
tion, study behavior, living behavior, and internet behavior.
cannot provide information about how they achieve predic-
The Catboost–SHAP-based academic achievement predic-
tions. As the ultimate AI user, administrators in universities
tion gives not only the accurate achievement prediction, but
can only obtain the prediction results, but not the reasons for
the interpretable feature contribution to the predictions. The
making specific predictions, which has aroused suspicion
interpretable academic warning visualization are presented
and distrust. Only when users can understand why they want
based on the model output. Thus, an interpretable predic-
to make a specific decision, they will trust them and gener-
tion model for university student academic crisis warning
ate a willingness to use a specific method [1 ] 9 . Interpretable is constructed.
machine learning presents the internal operating mechanism
In this paper, we convert academic crisis warning prob-
to users, so that education administrators can not only get
lem into current portrait construction problem and academic
more accurate prediction results, but also understand the
performance prediction problem. Based on the dynamic
reasons behind the prediction. At the same time, the possible
and static data of the students in the T semester, the aca-
errors in methods are obvious for users and can be identi-
demic performance of the students in the T + 1 semester
fied and corrected immediately based on the feedback of the
is predicted. Generally, students who are at the bottom of
education administrators. Frederico etal. [20] attempted to
the university or show a significant decline in their grades
find the factors that affected academic performance through
need academic crisis warning. The judgment threshold is set
feature importance. They transformed the academic per-
according to the university conditions.
formance prediction into a binary classification problem of
whether students successfully completed their studies. They
K‑prototype‑based student portrait construction
found that the most critical factors affecting performance
prediction were the number of courses participated in the
The student portrait represents the common features of the
school year, the gender of the students and the number of
student group, which reflects the specific characters and
missed subjects using random forest methods. To sum up,
provides support for student character analysis. The student
there still exists room for improvement in terms of method
portrait is usually constructed based on clustering methods.
generalization and interpretability.
Clustering is an unsupervised machine learning method
that explores the correlation between clusters and evaluates
the similarity of data within the cluster. The student por-
An interpretable prediction method
trait is described from the perspectives of basic information
considering categorical features
etc., similar to the specific student group. Currently popular
clustering methods such as K-means, hierarchical clustering,
In this paper, we propose an interpretable prediction method
density clustering, etc., can only deal with numerical fea-
considering categorical features for university student aca-
tures. The K-modes algorithm is a clustering algorithm used
demic crisis warning, mainly consisting of K-prototype-
for categorical feature data in data mining. It is an exten-
based student portrait construction and Catboost–SHAP-
sion modified according to the core content of K-means,
based academic achievement prediction. The overall
aimed at the measurement of categorical features and the
framework of the method is shown in Fig.1.
problem of updating the centroid. However, K-modes can
For university student big data, it is necessary to perform
only handle categorical feature data. Therefore, there is a
data preprocessing steps including multi-source data fusion,
need for a clustering method that can process two different
data filtering, missing value processing, coding transforma-
types of data at the same time. The K-prototype algorithm
tion, etc. The university big data are mainly made up of
inherits the ideas of the K-means algorithm and the K-modes
two types of features, numerical features including breakfast
algorithm, and adds a calculation formula describing the
times in university cafeteria per month, the internet usage
dissimilarity between the prototype of the data cluster and
time each day etc. and categorical features including gender,
the mixed feature data. Considering existence of numerical
birthplace of student, major etc. The two types of features
and categorical features, we cluster the student data based
are supposed to be dealt with differently in modeling.
on K-prototype, and build student portraits on the basis of
Through early communication with university adminis- clustering.
trators, we need to first construct the current portrait of the
In K-prototype algorithm, for numerical features, the
students and then give the prediction academic performance
Euclidean distance is used. Suppose that the student 1 3 3 26
Complex & Intel igent Systems (2022) 8:323–336
Fig. 1 Framework of the proposed method
dataset with m features and n samples can be expressed
distance formula between two points in the Euclidean space
w i t h D = X , = X + X ,
, i = 1, 2, … , n . and expressed as i yi y
𝐧𝐮𝐦,i
𝐜𝐚𝐭,i i
Let Xcat,i denotes vector of categorical features and X
denotes vector of numerical features, where √mnum 𝐧𝐮𝐦 i √∑ , (X ) ( )2 X Euclidean , X √ x . ∈ X
𝐧𝐮𝐦,a
𝐧𝐮𝐦,b =
num,al − xnum,bl i and X , i = = x j 1, 2, ij
… , m . G i v e n t wo s a m - ples l X = X + X
and X = X + X . =1 a 𝐧𝐮𝐦 a 𝐜𝐚𝐭 a b 𝐧𝐮𝐦b 𝐜𝐚𝐭 b , , , , (1) X , x , … , x and X ,
𝐧𝐮𝐦, a = x num,a1 num,a2 num,am
num,b = xnum,b1 x , x
. Student data is first normalized and
For categorical features, Hamming distance is … , num b , 2 num bm ,
mapped into the interval [0,1] to reduce the effect of dimen-
calculated. The categorical features part of two
sionality. Then Euclidean distance is derived from the s a m p l e s X , x , … , x a n d
𝐜𝐚𝐭,a = x cat,a1 cat,a2 cat,am 3
Complex & Intel igent Systems (2022) 8:323–336 327 X , x , … , x . The expression is listed
Lnum represents the total loss of all numerical features in
𝐜𝐚𝐭 ,b = xcat, 1 b cat, 2 b cat,bm as follows:
the sample of cluster c , Lcat represents the total loss of all
category features, and 𝛾 is the weight of categorical features m c cat ∑
in category c , where 𝛾 affects the accuracy of clustering. Hamming (X ) 𝛿(x x ), c
𝐜𝐚𝐭,a, X𝐜𝐚𝐭 ,b = cat,al − cat,bl (2) When l 𝛾 =1 c
= 0 , only numerical features are considered, which
is equivalent to the k-means method. The weight of cate- where m
and m are number of numerical features and
gorical features is greater when becomes larger, and the num cat 𝛾c
categorical features, respectively. If p = q , 𝛿(p, q) = 0 . If
clustering result is dominated by categorical features. The
p ≠ q , 𝛿(p, q) = 1.
proper settings of 𝛾 results in better cluster performance. It c
The sample dissimilarity of mixed feature types can be
is affected by the mean square error of the numerical vari-
calculated through combining different features into a single
able and is supposed to set 0.5–0.7 when the mean square
dissimilarity matrix. Let K be the number of clusters and
error is 1. The numerical features are standardized, and the Q =
q , q , … , q
, which represents the cluster center c c1 c2 cK
variance is 1, so 𝛾 is set to 0.5. The specific process of c
selected by cluster c , so the distance between the data and
K-prototypes algorithm is shown in Algorithm1.
the cluster center can be expressed as follows:
We cluster the students from the perspective of living
behavior, internet behavior etc. and confirm the number of
Distance X , Q = Euclidean X , Q Hamming X , Q . i j
𝐧𝐮𝐦,i j + 𝛾c
𝐜𝐚𝐭, i j
the target clusters through indicator Silhouette coefficient. (3)
After clustering, we further analyze various cluster char-
Then, the loss function of K-prototype can be defined as
acteristics and generate character label based on statistics K summary of each cluster. ∑ Loss ( ) = Lnum + Lcat = Lnum + Lcat, c (4) c c=1 1 3 3 28
Complex & Intel igent Systems (2022) 8:323–336
Catboost–SHAP‑based academic achievement
features, and uses the combined features with higher internal prediction
connections as new features to participate in modeling.
Traditional feature importance evaluation methods can only
The Catboost–SHAP-based academic achievement predic-
reflect which feature is more important, but cannot show the
tion is introduced in detail. As a representative of the ensem-
feature impact on the prediction result. Inspired by the Shapley
ble learning method, the boosting algorithm has the advan-
value of cooperative game theory, the SHAP method [2 ] 1 con-
tages in prediction accuracy and generalization performance.
structs an additive interpretation model based on the Shapley
It continuously adjusts the weight of the sample according to
value. The Shapley value measures the marginal contribution
the error rate in continuous iteration, and gradually reduces
of each feature to the entire cooperation. When a new feature
the deviation of the method. Decision trees are used as base
is added to the model, the marginal contribution of the feature
classifiers. The common boosting algorithms such as Ada-
can be calculated with different feature permutations through
boost, GBDT do not support the categorical features. The SHAP.
data requires to be transformed with encoding methods such
For student dataset D = X
, the Shapley value of y can i y , i i
as one-hot encoding before being input to the model, but be expressed as follows:
it performs poorly for the categorical features with high m
dimensions, which will seriously affect the efficiency and ∑ SHAP(y ) )) ) = E( f(x + f(x i ij ij , (6) performance effect. j=1
Catboost is an improved version of the boosting algorithm
which considers the categorical features. First, the dataset is
where f x denotes Shapley value of and ij xij m corresponds
shuffled, and different permutations are adopted at different
to the number of features. E y expresses the expected value i
gradient boosting stages. By introducing multiple rounds of
of all f x . When f > 0, the ij xij
j th feature of the i th sam-
random permutation mechanism, it effectively improves the
ple has a positive effect on the prediction result y , and vice i
efficiency and reduces over-fitting. For a certain value of
versa, it truly reflects the positive and negative effects of the
the categorical feature, it adopts the ordered target statisti-
feature on the prediction result. After deriving the Catboost
cal (Ordered TS) to deal with the categorical features, which
model, we compute the Shapley values for each feature of
means the categorical feature ranked before the sample is
dataset. In the training process, the process of constructing
replaced with the expectation of the original feature value.
the Catboost–SHAP model of a single feature value is shown
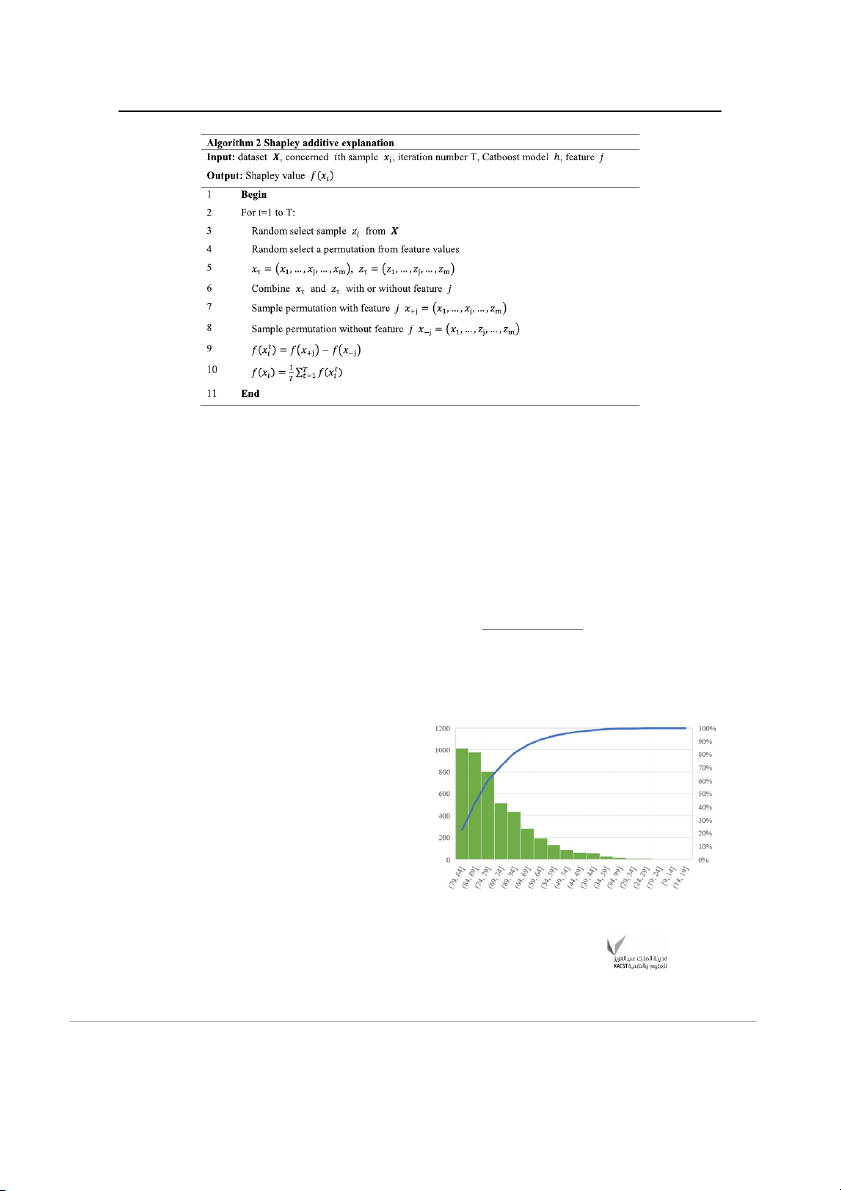
In addition, the priority and its weight are added. In this way, in Algorithm2.
the categorical features are converted into numerical features,
First, we input the training data X , interested sample x , fea- i
which effectively reduces the noise of low-frequency categori-
ture j and iteration T. For each iteration, random select a sam-
cal features and enhances the robustness of the algorithm. Sup-
ple z and generate the random permutation of feature. Create
pose the random order of the samples
two new instances through combining interested x and sample ρ = ρ , the i 1, ρ2, … , ρ n sample z xj located at
. The first interested instance include while in is
j th feature of the sequence x x x x ρ can be i +j j j −j ρ U U expressed as follows:
replaced by permutation z . The feature marginal contribution
f xt can be calculated through weighted average and output i ∑ U−1 I xj
. The above steps are repeated for each feature to get the = xj f x
× y + a × U i k=1 𝜌k 𝜌U k xj = , (5)
Shapley values for all the features. 𝜌 � � U
∑U−1 I xj = xj + a k=1 𝜌k 𝜌U
where U is the prior term, and a is the weight coefficient
of the prior term greater than 0. On the basis of construct-
ing categorical features, Catboost combines all categorical 3
Complex & Intel igent Systems (2022) 8:323–336 329
For the missing values are less than 10% of the whole Experimental result
dataset, we choose to remain the sample with missing value.
In view of the categorical features missing feature values Data preprocessing
like ethnicity, birthplace, dormitory, loan amount, awards,
family economic situation, etc., we fill in uniformly as
We collect student desensitization data from a university
“none”. In terms of numerical features with missing val-
in Dalian, China to conduct experiments. The dataset con-
ues like monthly average internet time ( ) h , monthly average
tains static data such as basic information and dynamic data
internet time at night (h), etc., we fill in with value 0. The
such as Internet records of students from 2018 to 2020. The
weighted average grade (WAVG) is calculated according to
details of the dataset can be found Tables4 and 5.
the students’ scores and corresponding credits for each aca-
Data preprocessing accounts for about 80% of the entire
demic year according to the following formula:
workload in data mining, and the quality of data directly
affect the performance of model [22, 2 ] 3 . Therefore, the data ∑n grade × credit i i i
needs to be preprocessed before modeling and analysis. Our WAVG =1 = . (7) ∑ n credit i
original dataset comes from multi-source, and there exists =1 i
problems such as missing data and data redundancy. Data
In the process of K-prototype-based student portrait construc-
fusion, data filtering, missing value processing, feature code
tion, after missing data filtering, we use maximum and mini-
conversion and other data processing steps are required. In
mum normalization to deal with numerical features. We use the
data fusion, under the premise of ensuring the integrity of
student performance data, the serial number of student is
used as the main key to fuse multi-source data.
Feature selection [24] methods have been used in various
machine learning methods. We use Random Forest feature
selection method to get rid of the useless feature in aca-
demic achievement prediction like length of schooling. In
this experiment, the original independent features related to
academic performance are selected. We screen the student
data by academic year and use those of 2018–2019years as
training set and those of 2019–2020 as test set.
According to the domain knowledge related to student
management, we compute the monthly average number and
consumption of breakfasts, lunches and dinner in the canteen,
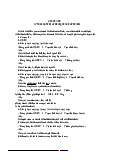
Fig. 2 Cumulative distribution of student academic performance for
sports consumption etc. of student consumption record. 2017 grade student 1 3 3 30
Complex & Intel igent Systems (2022) 8:323–336
following formula to normalize the numerical features of each
rank around the last 5% of all the students and deserve the
sample to reduce the impact of different feature distances:
additional attention of administrators. Xij − Xmin X∗ = , (8) Performance metrics ij Xmax − Xmin where X
To validate the performance of K-prototype-based student
ij and X∗ denote the value before and after normali- ij
portrait construction, the Silhouette coefficient, Calinski-
zation. Xmean and Xstd correspond to the mean value and
Harabasz and Davies Bouldin score are used. The Silhou-
standard deviation of the feature.
ette Coefficient combines the cohesion and separation to
evaluate the clustering performance. The formula of Sil- Data description
houette Coefficient is shown as follows: n g
After data preprocessing, a total of 13,613 student data are 1 S = ∑ i − vi }, (9)
obtained. We select 4,624 student samples of 2017 grade n i=1 max {gi, vi
because the compulsory courses of the second year and the
third year are more comprehensive. The data can be described
where vi represents the cohesion of cluster, which means the
average distance among the i th sample and all other data in
from four perspectives including the basic information, study
behavior, internet behavior, and living behavior.
the same cluster. gi represents the separation, which means
the distance between the i th sample and the nearest cluster.
Basic information includes the description of student
such as gender, ethnicity, date of birth, family structure,
Table 1 Comparative results of clustering performance
admission type, birthplace and family economic status.
The study behavior mainly includes the weighted average Models Cluster S CH DBI
grades and the failed grades of the previous academic year, K-means 2 0.428484 7095.454 0.892379
the number of visits to the library, the number of borrowed 3 0.398637 6153.234 0.970542
books, the information of the student’s department, major, 4 0.408408 6160.945 0.858285
class, the number of awards, and the amount of scholarship 5 0.389156 5622.735 0.933592
loans. Internet behavior mainly include monthly average 6 0.331472 5579.942 0.933686
internet time (h), monthly average internet time at night 7 0.33504 5557.057 0.951496
(h), network traffic usage, game online time, the number of 8 0.316842 5456.002 1.025409
commonly used APPs, etc. Living behavior refers to a way 9 0.277598 5007.052 1.079333
of activity and configuration of students, which mainly 10 0.269662 4748.582 1.19619
contains the monthly average number and consumption Birch 2 0.360267 5495.627 0.805574
of breakfasts, lunches and dinner in the canteen, sports 3 0.323743 5318.713 0.99023
consumption, frequency of water usage, frequency of bath- 4 0.382148 5594.193 0.86904
ing, frequency of washing machine use, time for return- 5 0.331424 5358.336 0.94342
ing to the dormitory every night etc. The 2017 grade stu- 6 0.319297 5317.621 1.010787
dent samples are listed in Tables4 and 5 according to the 7 0.334224 5164.199 1.016429
numerical features and categorical features. 8 0.325813 5093.434 0.991862
The data in Tables4 and 5 reflect the overall perfor- 9 0.335003 5113.016 0.988204
mance of the 2017 grade students in terms of study and 10 0.328125 5086.486 1.021491
life. When analyzing performance of a single student, it MeanShift – 0.472562 6257.606 0.692773
can be combined with the overall situation of the school OPTICS – – 0.17052 16.7709 1.548755 for research and exploration. K-prototype 2 0.496154 7396.385 0.732036
The histogram in Fig.2 reflects the overall distribution 3 0.424015 7149.989 0.88925
of student scores in the 2018–2019 academic year of the 4 0.415818 6278.954 0.912406
university. From Fig.2, it can be seen that the propor- 5 0.407517 6164.507 0.843537
tion of students with weighted average grade in the 79–84 6 0.370032 6079.004 0.921779
intervals ranks first. The line chart reflects the cumulative 7 0.35086 5882.694 0.958512
changes in each performance interval. The weighted aver- 8 0.349542 5773.671 0.931606
age grade in the 60–94 intervals accounts for 95% of the 9 0.344894 5583.745 0.996182
overall ratio. We set 60 as the threshold of crisis warning 10 0.332636 5454.374 0.993635
as the students with the weighted average grade below 60
Bold values indicate better results than other filtering methods 3
Complex & Intel igent Systems (2022) 8:323–336 331
When S < 0 and g < v , the clustering performance is not
Table 2 Parameter settings of Catboost–SHAP
good. When vi tends to 0, or g is much larger than v , S tends Parameter Default value Improved value
to 1, which means the model achieves a good performance.
Calinski–Harabaz Index is expressed as follows: Number of iterations 1000 9000 Learning rate 0.03 0.1 Tr Bk N − k Maximum depth 6 10 CH = × , ) (10) Tr (W k − 1 Maximum One hot size 2 2 k Categorical features None X𝐜𝐚𝐭
where Bk denotes between-clusters dispersion mean and Wk Loss function RMSE MSE
corresponds to within-cluster dispersion. When the covariance L2 leaf regularization 0 3
of the data within the cluster is smaller and the covariance of Device CPU GPU
the data between the clusters is larger, the performance of the
method will be better, which means that the larger the CH Performance comparison
index value is, the better the performance of the model will be.
Davie Bouldin Score is shown as follows:
Comparison results ofK‑prototype‑based student portrait construction 1 n ⎛ s s ⎞ DBI � i − j = max⎜ ⎟, (11) n i �w w �
We compare the K-prototype clustering method with popular =1 ⎜ ⎟ ⎝� i − j � � �⎠
clustering methods including K-means, Birch, MeanShift, where s
OPTICS and use Silhouette Coefficient, Calinski-Harabasz
i indicates the degree of dispersion of data points
in the ith cluster. The minimum value of DBI is 0, and the
and Davies Bouldin score to analyze the performance under
smaller the value is, the better the clustering effect is.
different clusters. We conduct the experiments on the whole
For the evaluation of Catboost–SHAP-based academic
dataset and the comparison is shown in Table1. Birch,
achievement prediction, we use the common performance
MeanShift, OPTICS do not need to set the number of clus-
indicators of regression methods, such as mean square error
ters and we mark ‘−’ for distinction.
(MSE), mean absolute error (MAE) and coefficient of deter- It can be seen from Table
1 that K-prototype performs sig-
mination ( R2 ) [25]. Assuming that n is the number of samples,
nificantly better than other clustering methods in terms of Sil-
ypred is the predicted value of the i th sample, y
houette coefficient and Calinski-Harabasz. K-prototype have i i and y denote
the corresponding true value, respectively. Then the three indi-
the best performance in terms of various indicators when the
cators can be expressed as follows:
number of clustering is set 2 for all the dataset. MeanShift
performs better in terms of Davies Bouldin score. It reflects n 1 MSE pred)
K-prototype clustering is more effective when data contains = ∑ ( y y i − 2 (12) n i
both categorical and numerical features. Through K-pro-
totype, students can be divided into different clusters and n
labeled with different tag from the view of living behavior, 1 MAE ∑ |( y ypred)| (13)
study behavior and Internet behavior. In addition, the single = n | i − i | | | |
student shares the common characters of the student group. n pred�
Comparison results ofCatboost–SHAP‑based academic ∑ � i y y 2 =1 i − i achievement prediction (14) R2 . = 1 − n 2 ∑ �yi − y�
To test the performance of the Catboost–SHAP method in
regression prediction, we have the experiments with our
Fig. 3 Relationship of the loss
versus iterations of Catboost– SHAP 1 3 3 32
Complex & Intel igent Systems (2022) 8:323–336 Table 3 Performance Method Prediction Time MSE MAE R2
comparison of student academic prediction methods KNN 0.026 (± 0.001) 80.485 (± 12.223) 6.464 (± 0.181) 0.366 (± 0.061) LR 0.007 (± 0.001) 42.734 (± 10.354) 4.471 (± 0.132) 0.665 (± 0.058) DT 0.132 (± 0.005) 43.143 (± 9.735) 4.380 (± 0.144) 0.661 (± 0.056) SVM 0.005 (± 0.000) 90.636 (± 16.353) 6.214 (± 0.214) 0.288 (± 0.096) MLP 0.237 (± 0.001) 133.200 (± 10.768) 8.037 (± 0.109) – 0.051 (± 0.018) RF 0.006 (± 0.000) 47.968 (± 9.824) 4.774 (± 0.184) 0.623 (± 0.057) BAG 0.174 (± 0.003) 42.950 (± 9.686) 4.381 (± 0.139) 0.663 (± 0.055) ADB 0.083 (± 0.029) 61.522 (± 10.972) 6.024 (± 0.381) 0.516 (± 0.064) GBDT 0.010 (± 0.005) 41.236 (± 10.103) 4.258 (± 0.131) 0.676 (± 0.058) XGBoost 0.013 (± 0.001) 40.785 (± 10.334) 4.240 (± 0.109) 0.680 (± 0.058) LightGBM 0.008 (± 0.000) 41.177 (± 10.084) 4.254 (± 0.131) 0.677 (± 0.057) Catboost–SHAP 0.657 (± 1.096) 30.254 (± 6.749) 3.723 (± 0.162) 0.763 (± 0.03) Improved Catboost–SHAP 0.061 (± 0.006) ( 24.976 ± 5.941) 3.551 (± 0.162) 0.803 (± 0.034)
Bold values indicate better results than other filtering methods
iterations, represented by the blue dot in the figure. There-
fore, we adopt 9000 iterations and tune the other parameters
through grid search method. The default value of original set-
tings of Catboost–SHAP and the best parameters settings of
improved version of Catboost–SHAP are shown in Table . 2
To make a fair comparison with other methods, we
use default parameters for all methods including Cat-
boost–SHAP. To validate the effectiveness of the improved
Catboost–SHAP, we add it to the comparison results and
the comparative experimental results are shown in Table3. Fig. 4
We compare the mean and variance of performance indica-
Feature importance ranking plot with improved Catboost– SHAP
tors of various methods over tenfolds. The results in Table3
show that the Catboost–SHAP proposed is superior to other
proposed method and other popular machine learning meth-
methods in terms of MSE, MAE and R2 . Catboost–SHAP
ods such as Linear regression (LR), support vector machine
achieves the smallest value in MSE, MAE and realize the
(SVM), decision tree (DT) and commonly used ensemble
largest value in R2 , which shows the excellent fitting ability.
learning methods adaptive enhancement (AdaBoost), ran-
To further improve the performance of Catboost–SHAP,
dom forest (RF), gradient boosting decision tree (GBDT),
we optimize the parameter settings, tune the parameters as
XGBoost, LightGBM for comparison. To validate the gen-
Table2 and achieves better performance compared with
eralization of our proposed method, tenfold cross validation
original one, which achieves 17.45% improvement in MSE,
is used, and each comparison experiment was carried out ten
4.63% in MAE and 5.26% in R2 . In addition, it costs shorter
times independently to ensure the validity of the experiment.
prediction time with the help of GPU device. It has the
We train the comparative method on student data of
smallest variance in MSE in the tenfold cross validation.
2018–2019 academic year and perform prediction on the
Compared with other popular methods, the prediction
weighted average grade (WAVG) of 2019–2020 academic
time of Catboost–SHAP is slightly longer, but it is at the
year. For the parameter setting of Catboost–SHAP, we
millisecond level, which has no significant difference.
adopt the default settings to compare with other methods
and separate the validation set from the training set to further Interpretable analysis
improve the performance of Catboost–SHAP. To check the
model convergence effect, we plot the relationship of the loss
To ensure the generalization ability and stability of the pre-
versus iterations of Catboost–SHAP in Fig.3.
diction, it is significant to find the core factors that affect
In Fig.3, the green dotted line represents the loss decreas-
student academic performance based on the student portrait
ing with iterations of training set and the blue solid line
and the prediction results. The analysis based on portrait and
denotes the loss decreasing with iterations of validation
SHAP go deep into the model to give a reasonable expla-
set. The best performance of validation set is around 9000
nation for the prediction results. It tells the teacher which 3
Complex & Intel igent Systems (2022) 8:323–336 333
all the students. From the study behavior perspective, the
students are divided into 4 groups, including bad academic,
medium academic, good academic and excellent academic.
In terms of living behavior, 3 clusters are generated, includ-
ing extremely irregular schedules, irregular schedules, regu-
lar schedules. The internet behavior can be transferred to
addicted to game, normal internet usage, seldom internet
access. The student sample belongs to bad academic in the
study behavior, irregular schedules in living behavior and
addicted to game in the internet behavior.
We present the analysis results of the Catboost–SHAP
model on academic performance. With the help of visu-
Fig. 5 Shapley value plot of the student
alization, the internal operation mechanism of the Cat-
boost–SHAP model can be explored. A student who needs
aspect of the students need to pay more attention to, what
academic crisis warning is listed in Fig.5 as example for
are the reasons for the poor grades or missed subjects, so as empirical research.
to provide targeted guidance to the students.
The red and blue in Fig.5 show the positive and nega-
We calculate the Shapley value of all student data with
tive contributions of each feature to the final prediction
Catboost–SHAP-based academic achievement prediction
score, pushing the model’s prediction results from the basic
and draw a feature importance ranking plot in Fig.4.
value to the final value. The basic value is the mean value
Figure4 plots the SHAP value of each feature for all sam-
of the model prediction on the test set. The WCAVG_2019
ples. Each row represents a feature, and the abscissa corre-
is 70.737, the WAVG_2019 is 73.412. The mean grades of
sponds to the SHAP value. Each point in the plot represents
department of electronic information and electrical engi-
a sample, where red represents positive contribution and blue
neering is generally lower than other department, which
represents negative contribution. The absolute mean values
means the harder level of courses. His average usage of
of Shapley are calculated for each feature and are sorted from
washing machine per month (AUWMPM) is 2.5, which is
top to bottom to represent the rank of feature importance.
higher than the average level, which indicates more time
According to the order, the weighted average grades in the
in dormitory. Through the visualization plot, we can know
previous academic year, the weighted compulsory average
the internal mechanism of the model’s prediction, which is
grades in the previous academic year, awards, major, depart-
easier for education administrators to understand.
ment, failed credits in the previous academic year, dormitory
make sense to the academic performance prediction. The red
part of figure indicates that WAVG_2019, WCAVG_2019, Conclusion
etc. are proportional to the final score. The increase in the
value of these features can improve the predicted scores,
Academic crisis warning of university students enable admin-
while the blue part like FC_2019, AUBWPM, ANBPM_1
istrators to pay attention to students’ academic problems as
are inversely proportional to the final score. From the fea-
early as possible. The student portrait and accurate academic
tures, it can be seen that the scores in the previous academic
performance prediction give interpretable analysis and pro-
year account for a large proportion of the forecast. In addi-
vide data-driven decision-making support for university
tion, awards, major, the dormitory atmosphere, breakfast time
administrators. In our study, the 2018–2020 desensitized stu-
and good reading habits are very important for getting good
dent data of a university in Dalian, China is used for predic-
grades. Through the plot, we can better understand the inter-
tion experiments. After preprocessing of multi-source data,
nal operating mechanism of the prediction model, enhance
it is input into our proposed framework with K-prototype-
the trust of education administrators.
based student portrait construction and Catboost–SHAP-
based academic achievement prediction for university student
academic crisis warning. It gives high-performance machine
Case study withinterpretable academic warning
learning methods with visual interpretability analysis, and visualization
in-depth exploration of students’ daily life, study habits on
the basis of achieving academic early warning. The student
We have performed the K-prototype-based student portrait
portrait and relationship between factors and academic per-
construction on the student dataset from the perspective of
formance provide guidance assistance and decision support
study behavior, living behavior and internet behavior. We
for university administrators and instructors. We train our
define the clusters referenced to the statistics summary of
interpretable prediction method based on the actual student 1 3 3 34
Complex & Intel igent Systems (2022) 8:323–336
data after desensitization in a university, and compare the
interpretable academic warning visualization, we can further
method with other mainstream machine learning methods.
analyze the reasons behind their poor performance and provide
The experimental results show that our method has signifi-
timely guidance and suggestions for university administrators.
cant advantages in the performance and performance of the
In future research work, we will consider incorporating
method, which is better than machine learning LR, DT, SVM,
more time-series dimensional data to conduct in-depth mining
RF, BAG, ADB, GBDT, XGBoost, LightGBM in the method.
from a more comprehensive view. At the same time, we will
In tenfold cross validation, the MSE of the Catboost–SHAP
consider integrating more educational data from other sources
method is 24.976, the MAE is 3.551, and the R2 is 80.3% in
and realize a more real time, accurate and stable student aca-
terms of academic performance prediction.
demic crisis warning, which provide more comprehensive
Student academic crisis warning of students based on our
decision-making support for education administrators.
method can detect problematic students with poor expected
grades as early as possible, and can also analyze specific fac-
tors that are positively and negatively related to their grades. Appendix
Good course scores in last academic year, regular living habits
all reflect a positive correlation with greater weight. Through See Tables4 and 5.
Table 4 2017 grade student numerical features Feature type
Numerical feature Feature description Mean Std Median Maximum Study behavior WCAVG_2019
Weighted compulsory average grades in the previous academic 76.73 11.70 79.41 96.00 year FC_2019
Failed credits in the previous academic year 5.67 11.50 0.00 127.50 WAVG_2019
Weighted average grades in the previous academic year 76.97 10.66 79.32 96.00 NLEPM
Number of library entries per month 2.47 3.91 1.10 64.20 BBPM Borrowed books per month 0.33 0.92 0.00 21.00 Living behavior ANBPM_1
Average number of breakfasts per month in the cafeteria during 7.42 5.03 6.38 28.00
breakfast time (5–10 o’clock) ABCPM
Average breakfast consumption per month in the cafeteria during 5.96 1.86 5.71 24.05
breakfast time (5–10 o’clock) ANLPM
Average number of lunches per month in the cafeteria during 9.07 5.14 8.50 32.00 lunch time (10–15 o’clock) ALCPM
Average lunch consumption per month in the cafeteria during 11.46 2.06 11.38 27.04 lunch time (10–15 o’clock) ANDPM
Average number of dinners per month in the cafeteria during din- 7.86 4.81 7.21 33.50 ner time (15–20 o’clock) ABDPM
Average number of dinners per month in the cafeteria during din- 10.93 2.29 10.93 27.14 ner time (15–20 o’clock) AUWMPM
Average usage of washing machine per month 0.42 1.04 0.00 16.92 ANBPM_2
Average number of baths per month 4.08 3.44 3.42 21.83 AUBWPM
Average usage of boiling water per month 12.80 13.15 9.75 135.50 ANSPM
Average number of sports per month in the gym 0.43 0.81 0.08 14.08 ANHVPM
Average number of hospital visits per month 0.02 0.07 0.00 1.25 AHCPM
Average hospital consumption per month 3.99 11.26 0.00 175.45 ASCPM
Average supermarket consumption per month 3.74 4.10 2.63 63.92 ANBRPM
Average number of school bus rides per month 0.12 0.35 0.00 5.71 Internet behavior AITPM
Average Internet time per month (h). If there are multiple con- 293.85 225.04 268.47 1475.41
nected devices to WLAN, the time is accumulated AITNPM
Average Internet time at night per month (h) (0–6 o’clock). If 9.84 12.12 5.61 97.75
there are multiple connected devices to WLAN, the time is accumulated ANTUPM
Average network traffic (GB) usage per month. If there are multi- 36.21 30.63 31.80 253.60
ple connected devices to WLAN, the traffic is accumulated AOTOEA
Average online time of once entertainment apps (min) 30.94 25.69 28.12 334.68 NEA Number of entertainment apps 5.03 3.16 5.00 19.00 MTEA
Maximum time of entertainment APP (min) 234.65 255.81 157.71 1439.98 3
Complex & Intel igent Systems (2022) 8:323–336 335
Table 5 2017 grade student categorical features Feature type Categorical feature Feature description Type number Type sample Basic information Gender
Reflects the gender differences 2 Male, Female Ethnicity Reflects ethnic differences 31 Han, Hui Family_structure
Reflect single parent family or not and the 3 Single influence of family Admission_type
Reflects the differences among students 9 Rural fresh
of different types of admission, such
as differences between urban and rural areas, etc Birthplace
Reflect differences in habitats 33 Liaoning, Heilongjiang
Family_economic_status The degree of difficulty reflects the differ- 3 Normal, Especially difficult
ences in the status of different families Study behavior Department
Reflect the differences of different depart- 21
School of economic and management ments Major
Majors reflect the differences of different 83
Philosophy, business administration majors Dormitory
The name of the dormitory reflects the dif- 26 13th dormitory, 14th dormitory
ference in dormitory learning style Awards
Number of awards Scholarships and awards 3 1 time, 2 times
can reflect students’ club activities and learning Living behavior ATED
Average time entrance into the dormitory 16 16h, 17h Loan_amount
The loan amount reflects the student’s fam- 20 14,000 CNY, 15,000 CNY ily situation Funding
Reflects the student’s family situation 5 2000 CNY, 3000 CNY Internet behavior HFEA
High-frequency entertainment APP which 36 King of Glory
reflects the leisure and entertainment APP used most frequently
Acknowledgements This paper is our original work and has not been References
published or submitted simultaneously elsewhere. All authors have
agreed to the submission and declared that they have no conflict of
1. Peterson JS, Colangelo N (1996) Gifted achievers and undera-
interest. This paper was supported in part by the National Natural Sci-
chievers: a comparison of patterns found in school files. J Couns
ence Foundation of China (No. 71533001).
Dev 74:399–407. https:// doi. org/ 10. 1002/j. 1556- 6676. 1996. tb018 86.x Declarations
2. Reis SM, McCoach DB (2000) The underachievement of gifted
students: what do we know and where do we go? Gift Child Q
Conflict of interest On behalf of all authors, the corresponding author
44:152–170. https:// doi. org/ 10. 1177/ 00169 86200 04400 302
states that there is no conflict of interest.
3. Preece A (2018) Asking “Why” in AI: explainability of intelligent
systems—perspectives and challenges. Intell Syst Accounting, Open Access
Financ Manag 25:63–72. https:// doi. org/ 10. 1002/ isaf. 1422
This article is licensed under a Creative Commons Attri-
4. Aslam M (2019) Neutrosophic analysis of variance: application
bution 4.0 International License, which permits use, sharing, adapta-
to university students. Complex Intell Syst 5:403–407. https:// doi.
tion, distribution and reproduction in any medium or format, as long
org/ 10. 1007/ s40747- 019- 0107-2
as you give appropriate credit to the original author(s) and the source,
5. Matthes B, Stoeger H (2018) Influence of parents’ implicit theo-
provide a link to the Creative Commons licence, and indicate if changes
ries about ability on parents’ learning-related behaviors, children’s
were made. The images or other third party material in this article are
implicit theories, and children’s academic achievement. Contemp
included in the article’s Creative Commons licence, unless indicated
Educ Psychol 54:271–280. https:// doi. org/ 10. 1016/j. cedps ych.
otherwise in a credit line to the material. If material is not included in 2018. 07. 001
the article’s Creative Commons licence and your intended use is not
6. Zimmerman BJ, Kitsantas A (2014) Comparing students’ self-
permitted by statutory regulation or exceeds the permitted use, you will
discipline and self-regulation measures and their prediction of
need to obtain permission directly from the copyright holder. To view a
academic achievement. Contemp Educ Psychol 39:145–155.
copy of this licence, visit http:// creat iveco mmons. org/ licen ses/ by/4. 0/.
https:// doi. org/ 10. 1016/j. cedps ych. 2014. 03. 004 1 3 3 36
Complex & Intel igent Systems (2022) 8:323–336
7. Fonteyne L, Duyck W, De Fruyt F (2017) Program-specific pre-
17. Xu X, Wang J, Peng H, Wu R (2019) Prediction of academic per-
diction of academic achievement on the basis of cognitive and
formance associated with internet usage behaviors using machine
non-cognitive factors. Learn Individ Differ 56:34–48. https:// doi.
learning algorithms. Comput Human Behav 98:166–173. https://
org/ 10. 1016/j. lindif. 2017. 05. 003
doi. org/ 10. 1016/j. chb. 2019. 04. 015
8. Huang S, Fang N (2013) Predicting student academic performance
18. Lu J, Liu A, Song Y, Zhang G (2020) Data-driven decision sup-
in an engineering dynamics course: a comparison of four types
port under concept drift in streamed big data. Complex Intell Syst
of predictive mathematical models. Comput Educ 61:133–145.
6:157–163. https:// doi. org/ 10. 1007/ s40747- 019- 00124-4
https:// doi. org/ 10. 1016/j. compe du. 2012. 08. 015
19. Ribeiro MT, Singh S, Guestrin C (2016) “Why should i trust
9. Antonenko PD, Toy S, Niederhauser DS (2012) Using cluster
you?” In: Proceedings of the 22nd ACM SIGKDD International
analysis for data mining in educational technology research.
Conference on knowledge discovery and data mining. ACM, New
Educ Technol Res Dev 60:383–398. https:// doi. org/ 10. 1007/ York, NY, USA, pp 1135–1144 s11423- 012- 9235-8
20. Cruz-Jesus F, Castelli M, Oliveira T etal (2020) Using artificial
10. Dharmarajan A, Velmurugan T (2013) Applications of partition
intelligence methods to assess academic achievement in public
based clustering algorithms: a survey. In: 2013 IEEE Interna-
high schools of a European Union country. Heliyon 6:e04081.
tional Conference on computational intelligence and computing
https:// doi. org/ 10. 1016/j. heliy on. 2020. e04081 research. IEEE, pp 1–5
21. Lundberg SM, Lee SI (2017) A unified approach to interpreting
11. Miguéis VL, Freitas A, Garcia PJV, Silva A (2018) Early seg-
model predictions. In: Advances in neural information processing
mentation of students according to their academic performance: systems
A predictive modelling approach. Decis Support Syst 115:36–51.
22. García S, Luengo J, Herrera F (2016) Tutorial on practical tips of
https:// doi. org/ 10. 1016/j. dss. 2018. 09. 001
the most influential data preprocessing algorithms in data min-
12. Yukselturk E, Ozekes S, Türel YK (2014) Predicting Dropout Stu-
ing. Knowl-Based Syst 98:1–29. https:// doi. org/ 10. 1016/j. knosys.
dent: An Application of Data Mining Methods in an Online Edu- 2015. 12. 006
cation Program. Eur J Open, Distance E-Learning 17:118–133.
23. Wang S, Wang Y, Wang D et al (2020) An improved random
https:// doi. org/ 10. 2478/ eurodl- 2014- 0008
forest-based rule extraction method for breast cancer diagnosis.
13. Hachey AC, Wladis CW, Conway KM (2014) Do prior online
Appl Soft Comput 86:105941. https:// doi. org/ 10. 1016/j. asoc.
course outcomes provide more information than G.P.A. alone in 2019. 105941
predicting subsequent online course grades and retention? An
24. Hoque N, Singh M, Bhattacharyya DK (2018) EFS-MI: an ensem-
observational study at an urban community college. Comput Educ
ble feature selection method for classification. Complex Intell Syst
72:59–67. https:// doi. org/ 10. 1016/j. compe du. 2013. 10. 012
4:105–118. https:// doi. org/ 10. 1007/ s40747- 017- 0060-x
14. Asif R, Merceron A, Ali SA, Haider NG (2017) Analyzing under-
25. Boodhun N, Jayabalan M (2018) Risk prediction in life insurance
graduate students’ performance using educational data mining.
industry using supervised learning algorithms. Complex Intell
Comput Educ 113:177–194. https:// doi. org/ 10. 1016/j. compe du.
Syst 4:145–154. https:// doi. org/ 10. 1007/ s40747- 018- 0072-1 2017. 05. 007
15. Jugo I, Kovačić B, Slavuj V (2016) Increasing the adaptivity of an
Publisher’s Note Springer Nature remains neutral with regard to
intelligent tutoring system with educational data mining: a system
jurisdictional claims in published maps and institutional affiliations.
overview. Int J Emerg Technol Learn 11:67. https:// doi. org/ 10. 3991/ ijet. v11i03. 5103
16. Elbadrawy A, Polyzou A, Ren Z etal (2016) Predicting student
performance using personalized analytics. Computer (Long Beach
Calif) 49:61–69. https:// doi. org/ 10. 1109/ MC. 2016. 119 3
Tài liệu liên quan:
-

New English File Pre-intermediate Student's Book (2005) – Giáo trình môn English A1 | Học viện Phụ nữ Việt Nam
28 14 -

The Time Value of Money - English Grammar | Học Viện Phụ phụ nữa Việt Nam
355 178 -
Chapter 4 - Time Value of Money - English Grammar | Học Viện Phụ phụ nữa Việt Nam
320 160 -
Chuyên đề sự phối hợp thì - English Grammar | Học Viện Phụ phụ nữa Việt Nam
321 161 -

Direct Hits Vocabulary 3 - English A1 | Học Viện Phụ Nữ Việt Nam
316 158