Assigment 2 - Statistics for Business | Trường Đại học Quốc tế, Đại học Quốc gia Thành phố HCM
Assigment 2 - Statistics for Business | Trường Đại học Quốc tế, Đại học Quốc gia Thành phố HCM được sưu tầm và soạn thảo dưới dạng file PDF để gửi tới các bạn sinh viên cùng tham khảo, ôn tập đầy đủ kiến thức, chuẩn bị cho các buổi học thật tốt. Mời bạn đọc đón xem!
Môn: Statistics for Business (BAO8OIU) 43 tài liệu
Trường: Trường Đại học Quốc tế, Đại học Quốc gia Thành phố Hồ Chí Minh 1.9 K tài liệu
Tác giả:


Preview text:
Name: Nguyen Hong Chuong Anh ID: BABAWE21353 Assignment 2 Chapter 6 Exercises
6.23 In the Ardmore Hotel, 20 percent of the customers pay by American Express credit card. (a)
Of the next 10 customers, what is the probability that none pay by American Express? (b) At
least two? (c) Fewer than three? (d) What is the expected number who pay by American
Express? (e) Find the standard deviation. (f) Construct the probability distribution (using Excel
or Appendix A). (g) Make a graph of its PDF and describe its shape.
a) The probability that the next 10 customers none pay by American Express: (1-0.2)10=0.1074 10
b) At least two pay by American Express: ∑ ( 10Cx × 0.2x ×(1−0.2)1−x)=0.6242 2 2
c) Fewer than three pay by American Express: ∑ (10Cx × 0.2x×(1−0.2)1−x)=0.6778 0
d) The expected number who pay by American Express: μ=nπ=10 × 0.2=2
e) Find the standard deviation: √❑2 ¿√ nπ (1−π)=√10×0.2 (1−0.2)=1.2649
6.37 According to J.D. Power and Associates’ 2006 Initial Quality Study, consumers reported on
average 1.7 problems per vehicle with new 2006 Volkswagens. In a randomly selected new
Volkswagen, find the probability of (a) at least one problem; (b) no problems; (c) more than
three problems. (d) Construct the probability distribution using Excel or Appendix B, make a
graph of its PDF, and describe its shape. (Data are from J.D. Power and Associates 2006 Initial Quality Study.) 0 0
a) The probability of at least one problem: P(x) = 1−∑ ( λx )=1−∑( 1.7x )=0.8173 0 eλ x ! 0 e1.7 x ! λx
b) The probability of no problems: P(x) = = 1.70 =0.1827 eλ x ! e1.7 0 ! 0 3
c) The probability of more than three problems: P(x) = 1−∑ ( λx )=1−∑( 1.7x )=0.0932 0 eλ x ! 0 e1.7 x ! (d)
=> The distribution is skewed right.
6.92. Leaks occur in a pipeline at a mean rate of 1 leak per 1,000 meters. In a 2,500-meter
section of pipe, what is the probability of (a) no leaks? (b) Three or more leaks? (c) What is the expected number of leaks? 2,500× 1
a mean rate of leak per 2,500 meters: =2.5leaks 1,000 λx
(a) The probability of no leaks: : P(x) = = 2.50 =0.0821 eλ x ! e2.5 0 ! 2 2
(b) The probability of three or more leaks: P(x) = 1−∑ ( λx )=1−∑ ( 2.5x )=0.4562 0 eλ x ! 0 e2.5 x !
(c) the expected number of leaks: μ = = λ=2.5 2 Chapter 7 Exercises
7.38 The credit scores of 35-year-olds applying for a mortgage at Ulysses Mortgage Associates
are normally distributed with a mean of 600 and a standard deviation of 100. (a) Find the credit
score that defines the upper 5 percent. (b) Seventy-five percent of the customers will have a
credit score higher than what value? (c) Within what range would the middle 80 percent of credit scores lie? μ=600 , σ=100 a) P(x)>=0.05
z-score is 1.645 => z= x−μ =¿ x=z ×σ +μ=1.645 ×100+600=764.5 σ
b) Seventy-five percent of the customers will have a credit score higher than what value
Z-score is -0.6745 => z= x−μ =¿ x=z ×σ +μ=−0.6745 ×100+600=532.55 σ
c) The middle 80 percent of credit scores lie
Z-score is ± 1,2816 => z= x−μ =¿ x=z ×σ +μ=± 1,2816× 100+600={728.16; 471.84} σ
The range that P(728.16 ≤ x ≥ 471.84 ¿=80 %
7.59 Between 11 p.m. and midnight on Thursday night, Mystery Pizza gets an average of 4.2
telephone orders per hour. (a) Find the median waiting time until the next telephone order. (b)
Find the upper quartile of waiting time before the next telephone order. (c) What is the upper 10
percent of waiting time until the next telephone order? Show all calculations clearly. λ=4.2
a) The median waiting time until the next telephone order:
P ( X < x)=1−e−4.2x=0.5=¿ x=0.165 (hours)
b) the upper quartile of waiting time before the next telephone order:
P ( X > x)=e−4.2x=0.25=¿ x=0.3301(hours )
c) The upper 10 percent of waiting time until the next telephone order:
P ( X > x)=e−4.2x=0.1=¿ x=0.5482(hours ) Chapter 8 Exercises
8.3 The diameter of bushings turned out by a manufacturing process is a normally distributed
random variable with a mean of 4.035 mm and a standard deviation of 0.005 mm. A sample of
25 bushings is taken once an hour. (a) Within what interval should 95 percent of the bushing
diameters fall? (b) Within what interval should 95 percent of the sample means fall? (c) What
conclusion would you reach if you saw a sample mean of 4.020? A sample mean of 4.055?
μ=4,035 σ =0.005 n=25
a) Interval should 95 percent of the bushing diameters fall => z =± α / 1.96 2
z= x−μ =¿ x=z ×σ + μ=± 1.96× 0.005+ 4.035=[ 4.0252; 4.0448] σ
b) Interval should 95 percent of the sample means fall? σ 0.005
z= x−μ =¿ x=z ×
+ μ=±1.96 ×
+4.035=[4.03304 ; 4.03696 ] σ √n √25 √n
c) In either case, we would conclude that our sample came from a population that did not
have a population mean equal to 4.035.
8.17 The Ball Corporation’s beverage can manufacturing plant in Fort Atkinson, Wisconsin, uses
a metal supplier that provides metal with a known thickness standard deviation σ = .000959 mm.
If a random sample of 58 sheets of metal resulted in x = 0.2731 mm, calculate the 99 percent
confidence interval for the true mean metal thickness.
x=0.2731 σ =0.000959 n=58 99% => z =± 2.575 α / 2
99% confidence interval for the true mean metal thickness: σ 0.000959 x ± z ×
=0.2731± 2.575× =[0.2728 ;0.2734] α / 2 √n √58
8.23 A sample of 21 minivan electrical warranty repairs for “loose, not attached” wires (one of
several electrical failure categories the dealership mechanic can select) showed a mean repair
cost of $45.66 with a standard deviation of $27.79. (a) Construct a 95 percent confidence interval
for the true mean repair cost. (b) How could the confidence interval be made narrower? (Data are
from a project by MBA student Tim Polulak.)
x=45.66 s=27.79 n=21 a) 95% => t =± 2.086 α / 2
95% confidence interval for the true mean repair cost: s 27.79 x ± t ×
=45.66 ±2.086 × =[33.0099 ;58.3101] α / 2 √ n √ 21
b) We can increase sample size or decrease 95% to make the confidence interval be narrower. Chapter 9 Exercises
9.17 GreenBeam Ltd. claims that its compact fluorescent bulbs average no more than 3.50 mg of
mercury. A sample of 25 bulbs shows a mean of 3.59 mg of mercury. (a) Write the hypotheses
for a right-tailed test, using GreenBeam’s claim as the null hypothesis about the mean. (b)
Assuming a known standard deviation of 0.18 mg, calculate the z test statistic to test the
manufacturer’s claim. (c) At the 1 percent level of significance (α =.01) does the sample exceed
the manufacturer’s claim? (d) Find the p-value
a) Hypotheses for a right-tailed test
Null hypothesis: Ho: μ=3.5 mg ;
Alternative hypothesis: H 1: μ>3.5 mg n=25 x=3.59 mg
z= x−μ = 3.59−3.5 =2.5
b) σ =0.18 mg => σ 0.18/√25 √n
c) α =1 %=¿ z =2.33 z =2.5 ∉( −∞ ;2.33] c stat
¿> we haveenough evidence ¿ reject Hoat 1% level=> Hence, at the 1 percent level of
significance (α = 0.01) the sample exceed the manufacturer’s claim
d) P-value is P(z>2.5)=0.00621
9.38 The average weight of a package of rolled oats is supposed to be at least 18 ounces. A
sample of 18 packages shows a mean of 17.78 ounces with a standard deviation of 0.41 ounce.
(a) At the 5 percent level of significance, is the true mean smaller than the specification? Clearly
state your hypotheses and decision rule. (b) Is this conclusion sensitive to the choice of α? (c)
Use Excel to find the p-value. Interpret it.
n=18 , s=0.41 x=17.78
Null hypothesis : Ho: μ=18
a) Alternative hypothesis: H 1: μ<18; α =5 %=¿ t =−1.74 c ´x −μ t =
=17.78−18 =−2.2765 ∉ (−1.74 stat ;+∞ ) s 0.41/√18
=> we have enough evidence to reject Ho at √ n
5% level => Hence, the 5 percent level of significance, the true mean smaller than the specification.
b) Yes, the conclusion is sensitive to the choice of α
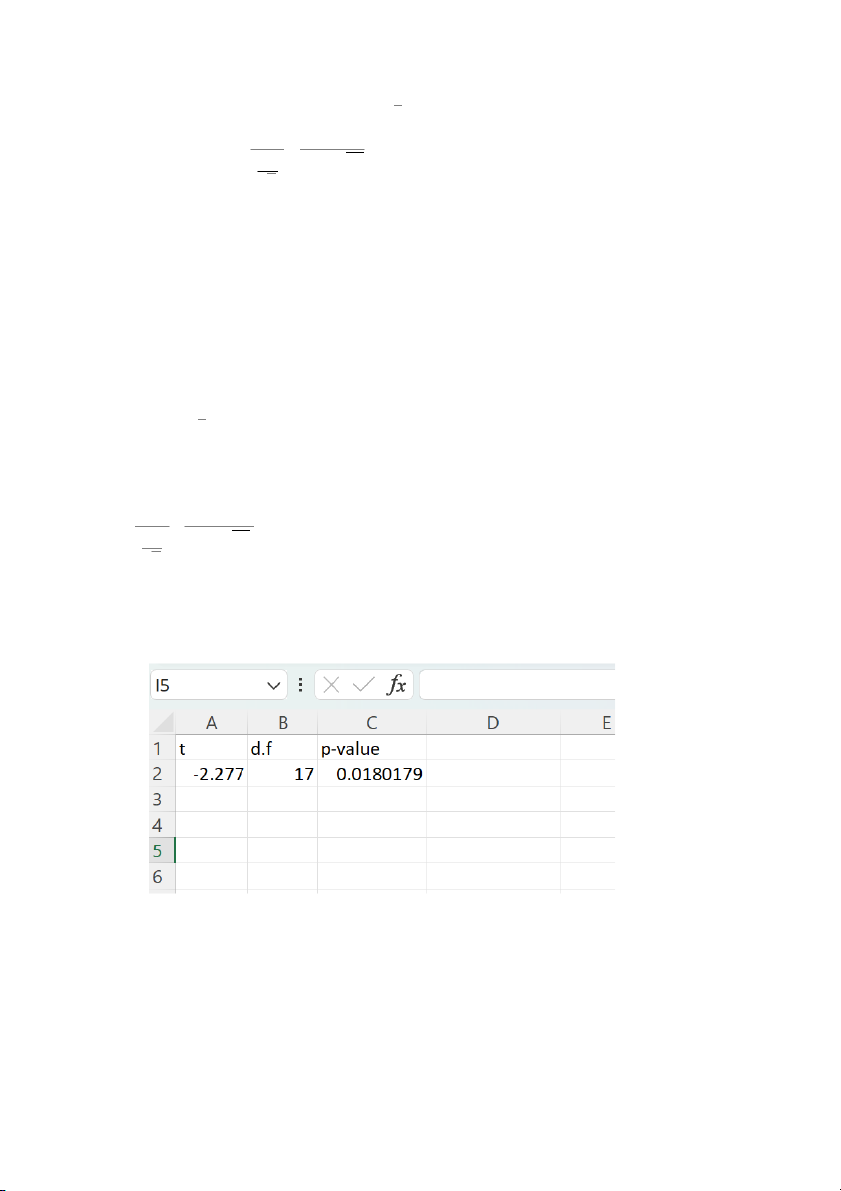
c) P-value is P(t <-2.2765,df=17)
Tài liệu liên quan:
-
Đề thi giữa kỳ học phần Statistics for Business năm 2015 | Trường Đại học Quốc tế, Đại học Quốc gia Thành phố Hồ Chí Minh
323 162 -
Đề thi giữa kỳ học phần Statistics for Business có đáp án | Trường Đại học Quốc tế, Đại học Quốc gia Thành phố Hồ Chí Minh
385 193 -
Đề thi giữa kỳ học phần Statistics for Business năm 2019 | Trường Đại học Quốc tế, Đại học Quốc gia Thành phố Hồ Chí Minh
270 135 -
Đề thi giữa kỳ học phần Statistics for Business | Trường Đại học Quốc tế, Đại học Quốc gia Thành phố Hồ Chí Minh
283 142 -
Bài tập tiểu luận nhóm học phần Statistics for Business | Trường Đại học Quốc tế, Đại học Quốc gia Thành phố Hồ Chí Minh
293 147